Cumulative charts
The Chart pane (on the ROC Curve tab) allows you to generate cumulative charts. These charts help you to assess model performance by exploring the model's cumulative characteristics—how successful would you be with the model compared to without it? Cumulative charts allow you to identify the advantages of using a predictive model.
Common use case for cumulative charts
Suppose you want to run a marketing campaign targeted at existing customers. Your customer database has 1,000 names. Because you know that the campaigns historically have only had a 20% response rate, you do not want to pay for printing and mailing to the entire base; instead you want to target only those most likely to respond positively.
- Use a predictive model to determine the probability of a positive or negative reaction from each customer.
- Sort by probability of a positive reaction.
- Target those customers with the highest probability.
Use cumulative charts
Use the Cumulative Gain and Cumulative Lift charts to determine how successful your model is. The X-axis of the charts shows the threshold value cutoffs of the model's predictions, and the Y-axis, either gain or lift, is calculated based on that percentage. The model shows the gain or lift (improvement over using no model) for each percentage cutoff level.
To view a cumulative chart:
-
Select a model on the Leaderboard and navigate to Evaluate > ROC Curve.
-
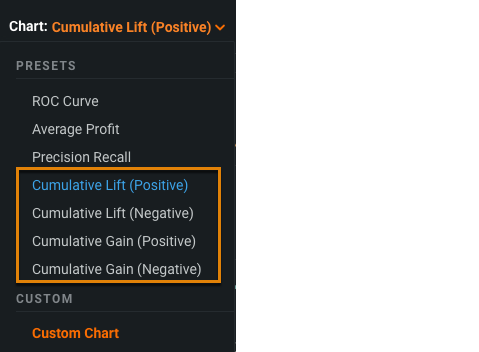
Select a type of cumulative chart from the Chart dropdown. You can select a Cumulative Gain or Cumulative Lift chart for either the positive or negative class:
-
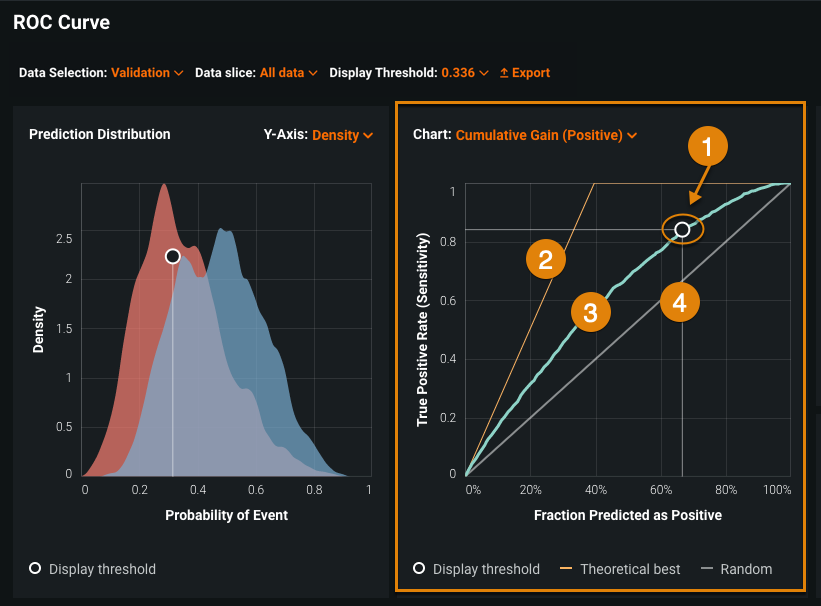
View the chart, in this case, a positive class Cumulative Gain curve:
Element Description 1 Display threshold Corresponds to the display threshold that governs the ROC Curve tab visualization tools. You can select a new display threshold by hovering over the curve and moving the circle to a new point on the curve, then clicking to select a new threshold. 2 Best curve Represents the theoretically best model. 3 Actual curve Represents the actual lift or gain curve. This example shows a positive Cumulative Lift curve. 4 Worst curve Represents a random model.
Cumulative Gain and Lift charts explained
The following sections provide an explanation of cumulative gains and lift. For more detailed examples, see Cumulative Gains and Lift Charts.
Cumulative Gain chart
Cumulative gain shows how many instances of a particular class you will identify when you look at different cutoff levels of your most confident predictions. For example:
Let's say there are 100 NCAA basketball teams and only 50 of them will be chosen for March Madness. You want to predict which 50 teams will make it. If you examined only your top 10 most confident guesses (predictions) and they all turned out to be perfect, you would have found 20% of the teams making the tournament.
- You got 10 correct picks out of the 50 teams making it,
10 / 50 = 20% Gain - Your gain at the top 10% of your most confident guesses is 20%
If you chose a different cutoff level and looked at your top 20 most confident guesses (and you were still perfect), your gain would be 40%.
- 20 correct picks out of the 50 teams making it,
20 / 50 = 40% Gain
By extension, if you can predict all the teams correctly, your gain is 100% when cutting off at the top 50% of your guesses.
- 50 correct picks out of 50 teams,
50 / 50 = 100% Gain
Random baseline
On the other hand, if you had no guessing skill and were basically choosing randomly, your top 10 most confident guesses might only get 5 teams correct (based on the same accuracy as the underlying distribution of the groups).
- 5 correct picks out of 50 teams,
5 / 50 = 10% Gain
The framework “assumes” that a random "baseline" will get the same accuracy as the underlying distribution of the groups. As a result, the random baseline prediction level will have a gain equal to whatever the cutoff level is (10% correct picks, 10% gain).
Cumulative Lift chart
Cumulative lift compares how much gain you've achieved relative to the random baseline. In the basketball example, your top 10 most confident guesses results in a lift equal to 2.0.
- 10 teams picked correctly out of
50 = 20% Gain - 20% gain for your predictions (your model) divided by 10% gain for the baseline (random model),
20 / 10 = 2.0 Lift
In other words, you'll get two times more correct guesses using your model than the random model.
If you have a situation where the two classes are evenly balanced, lift will max out at 2.0.
- Top 10% most confident predictions,
20% Gain → 20 / 10 = 2.0 Lift - Top 50% most confident predictions,
100% Gain → 100 / 50 = 2.0 Lift
If you're predicting at the baseline random level, lift will be 1; if you're predicting worse than random, lift will be less than 1.
Interpret the insight
Cumulative Lift and Cumulative Gain both consist of a lift curve and a baseline ("random"). The greater the area between the two, the better the model. The baseline is always a diagonal line, representing uniformly distributed overall response: if we contact x% of customers then we will receive x% of total positive responses. The charts display based on the selected class; with the class you are choosing whether to display those predictions with scores higher (positive) or lower (negative) than the classification threshold.
The Theoretical Best curve is determined by the class distribution. For example, for balanced classes if TPR is 10%, TRP would be 20%. This is because perfectly balanced classes means that there are two times more rows in general than rows of the class you're interested in (because there are only 2 classes and both have exactly the same number of rows). Therefore, a random predictor for any sample correctly returns half of the sample; an ideal returns all of the sample correctly 1/0.5=2.
If you were predicting a minority class, for example 40% of the labels, TPR @ 10% would be 25% (10 / 40). Generally, the larger the minority class, the steeper the Theoretical Best curve (it takes fewer perfect predictions to get total recall).
For both charts, the X-axis displays, at each point, the percentage of the data sample that is predicted to be categorized as the selected class (all the possible thresholds you can act on).
Cumulative Gain represents the sensitivity and specificity values for different percentages of predicted data. That is, the ratio of the cumulative number of targets (events) up to a certain threshold to the total number of targets (events) in the dataset. As a result, the model can help with various use cases, for example, targeting customers for a marketing campaign. If you can sort customers according to the probability of a positive reaction, you can then run the campaign only for the percentage of customers with the highest probability of response (instead of random targeting). In other words, if the model indicates that 80% of targets are covered in the top 20% of data, you can just send mail to 20% of total customers.
Cumulative Lift, derived from the Cumulative Gain chart, illustrates the effectiveness of a predictive model. It is calculated as the ratio between the results obtained with and without the model. In other words, lift measures how much better you can expect your predictions to be when using the model.
Technically speaking, Cumulative Lift is the ratio of gain percentage to the random expectation percentage, measured at various threshold value levels. For example, a Cumulative Lift of 4.0 for the top 2% thresholds means that when selecting 20% of the records based on the model, you can expect 4.0 times the total number of targets (events) you would have found by randomly selecting 20% of data without the model. In other words it shows how many times the model is better than the random choice of cases. To calculate exact values, take the gain of a model divided by the baseline.
Interpret Cumulative Gain
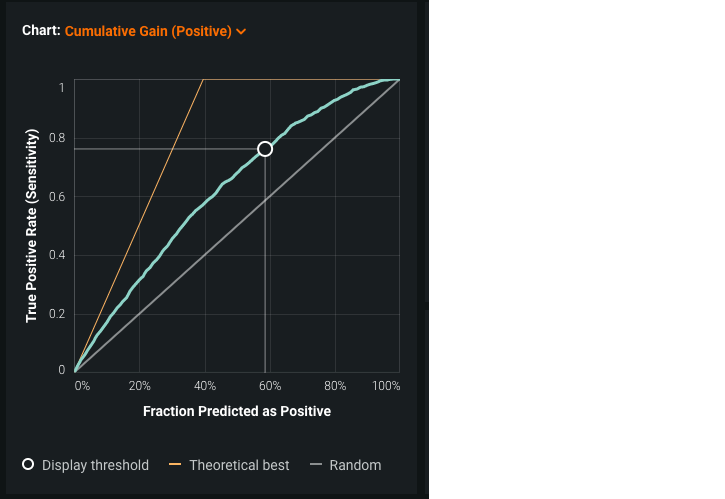
For the Cumulative Gain chart, the Y-axis displays the percentage of the selected class that the model correctly classified with the current threshold (sensitivity for positive selected class, specificity for negative).
In the chart above, you can see:
- If you act on 60% of model predictions, the result will be just below the 80% of true positives.
- According to the theoretical best line, there are 40% of predictions falling into the positive class in your data. In other words, you would only have to act on 40% of data to catch all occurrences of the positive class (if you have an ideal predictor, which is extremely rare).
Interpret Cumulative Lift
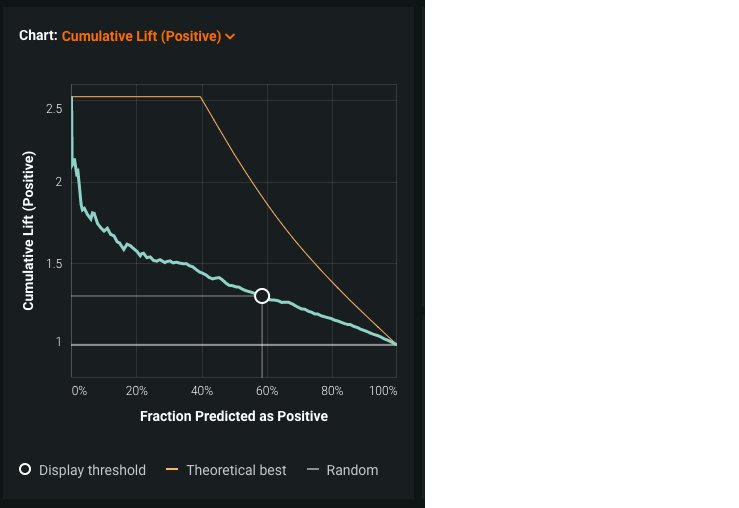
In the Cumulative Lift chart, the Y-axis shows the coefficient of improvement over a random model. For example, if you pick 10% of rows randomly, you expect to catch 10% of the class you're interested in. If the model's top 10% of predictions catch 28% of the selected class, the lift is indicated as 28/10 or 2.8. Because the values for Cumulative Lift are divided by the baseline, the random baseline—horizontal at a value of 1.0—becomes straight because it is divided by itself.
The chart above uses the same data as that used for Cumulative Gain—the lines are the same, the values are just adjusted. So, using roughly 60% of model predictions will result in roughly 1.3 more positive class responses than using random selection.


