Clustering
Clustering, an application of unsupervised learning, lets you explore your data by grouping and identifying natural segments. Use clustering to explore clusters generated from many types of data—numeric, categorical, text, image, and geospatial data—independently or combined. In clustering mode, DataRobot captures a latent behavior that's not explicitly captured by a column in the dataset.
You can also use clustering to generate the segments for a time series segmented modeling project. See Clustering for segmented modeling for details.
See the associated considerations for additional information.
How to use clustering models
Clustering is useful when data doesn't come with explicit labels and you have to determine what they should be. You can upload any dataset to get an understanding of your data because no target is needed. Examples of clustering include:
-
Detecting topics, types, taxonomies, and languages in a text collection. You can apply clustering to datasets containing a mix of text features and other feature types or a single text feature for topic modeling.
-
Determining appropriate segments to be used for time series segmented modeling.
-
Segmenting your customer base before running a predictive marketing campaign. Identify key groups of customers and send different messages to each group.
-
Capturing latent categories in an image collection.
-
Deploying a clustering model using MLOps to serve cluster assignment requests at scale, as a step in a more extensive pipeline.
Build a clustering model
The clustering workflow is similar to the anomaly detection workflow, also an unsupervised learning application.
To build a clustering model:
-
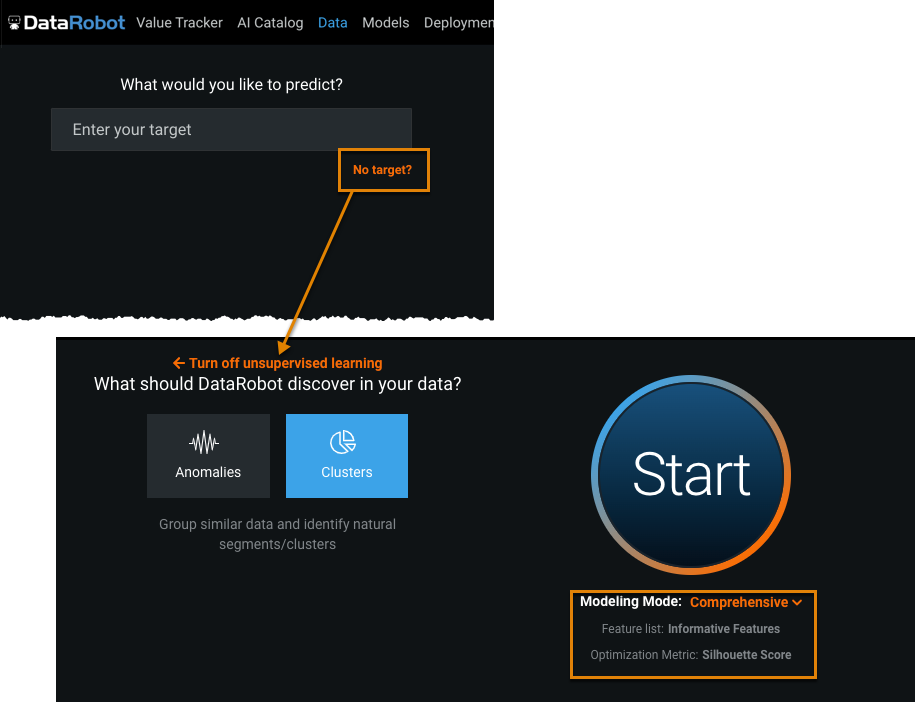
Upload data, click No target? and select Clusters.
Modeling Mode defaults to Comprehensive and Optimization Metric defaults to Silhouette Score.
-
Click Start.
DataRobot generates clustering models based on default cluster counts for your dataset size. You can also configure the number of clusters. For clustering, DataRobot divides the original dataset into training and validation partitions with no holdout partition.
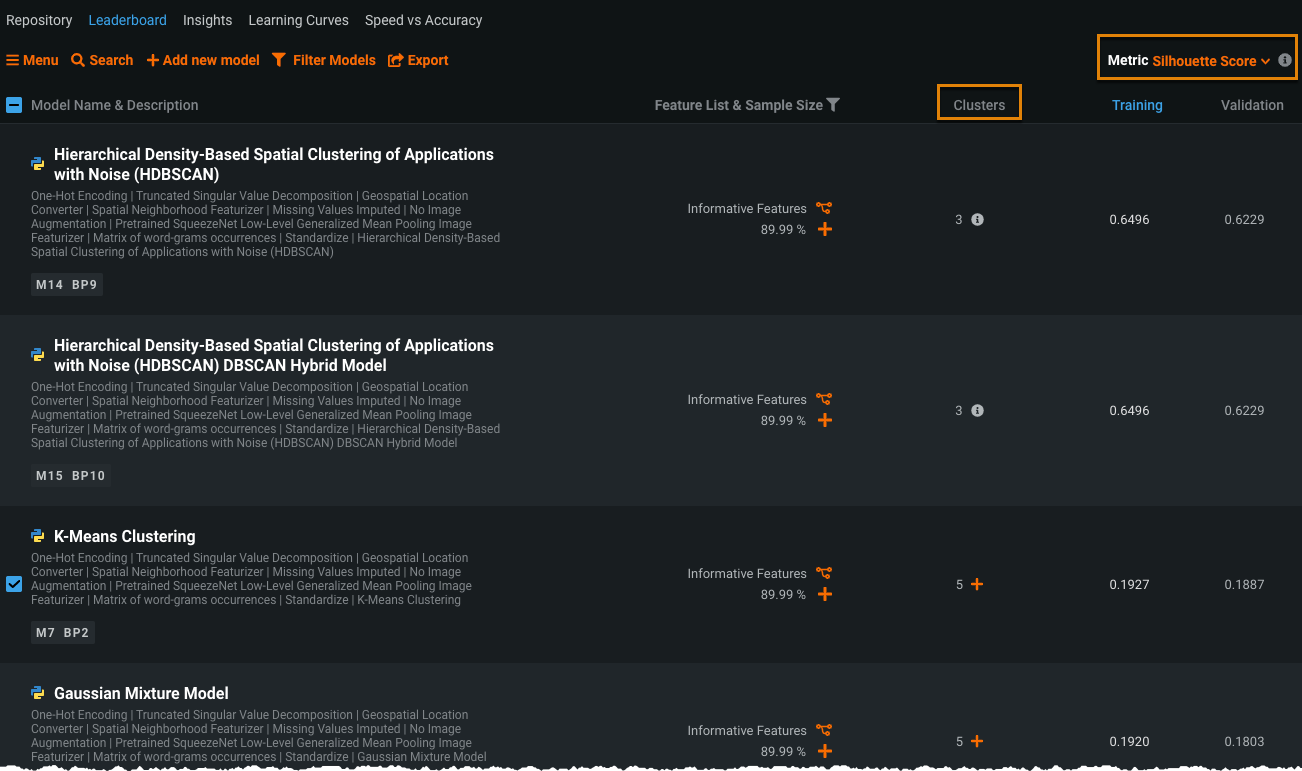
When modeling is complete, the Leaderboard displays the generated clustering models ranked by silhouette score:
The Clusters column indicates the number of clusters used by the clustering algorithm.
-
Select a model to investigate.
By default, the Describe > Blueprint tab displays.
-
Analyze visualizations to select a clustering model.
-
After evaluating and selecting a clustering model, deploy the model and make predictions on existing or new data as you would any other model. You can make predictions from the Leaderboard or the deployment.
Sample clustering blueprint
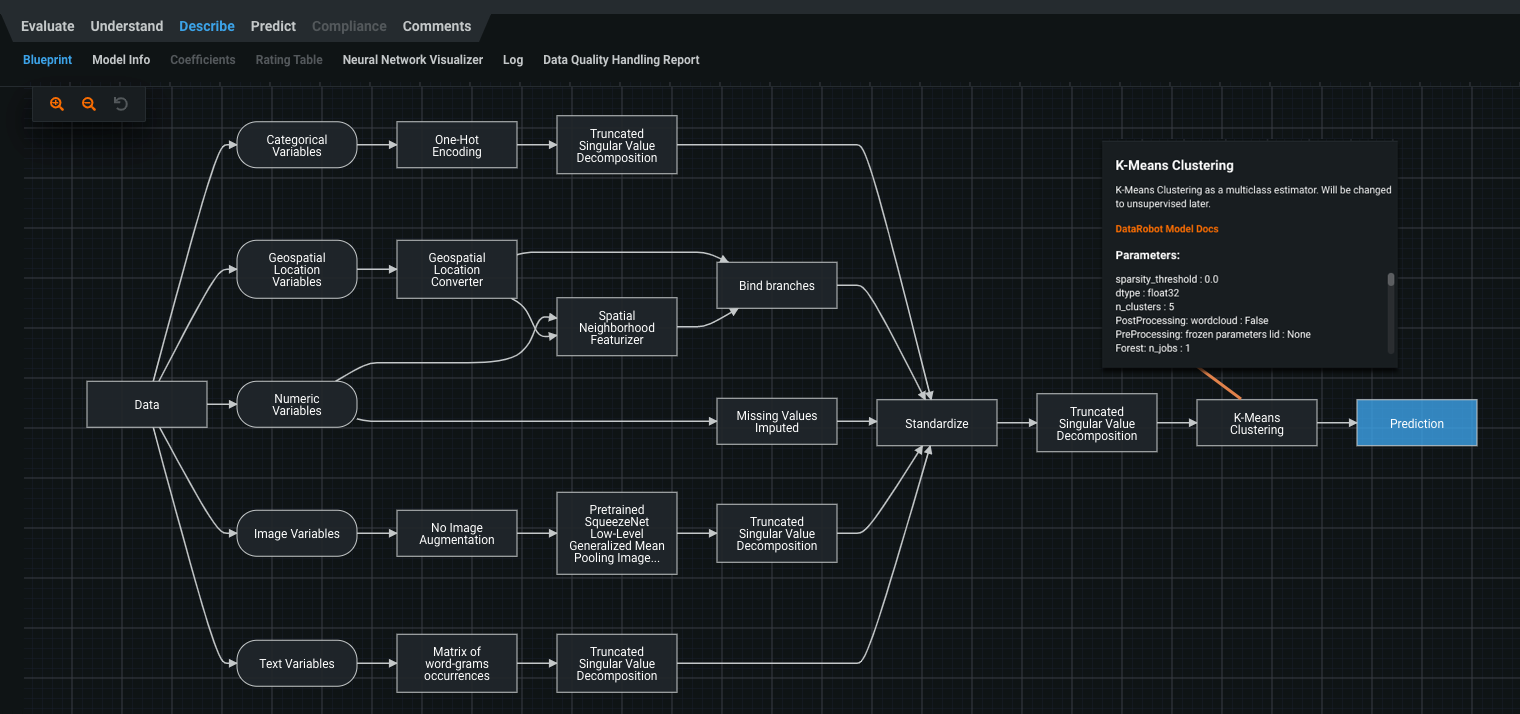
Following is an example of a clustering blueprint.
Click a blueprint node to access documentation on the algorithm or transform. This example shows details on the K-Means Clustering node.
This dataset contains categorical, geospatial location, numeric, image, and text variables. The clustering algorithm is applied after preprocessing and dimensionality reduction of the variable types to improve processing speed.
Visualizations for exploring clusters
The following visualization tools are useful for clustering projects:
Cluster Insights
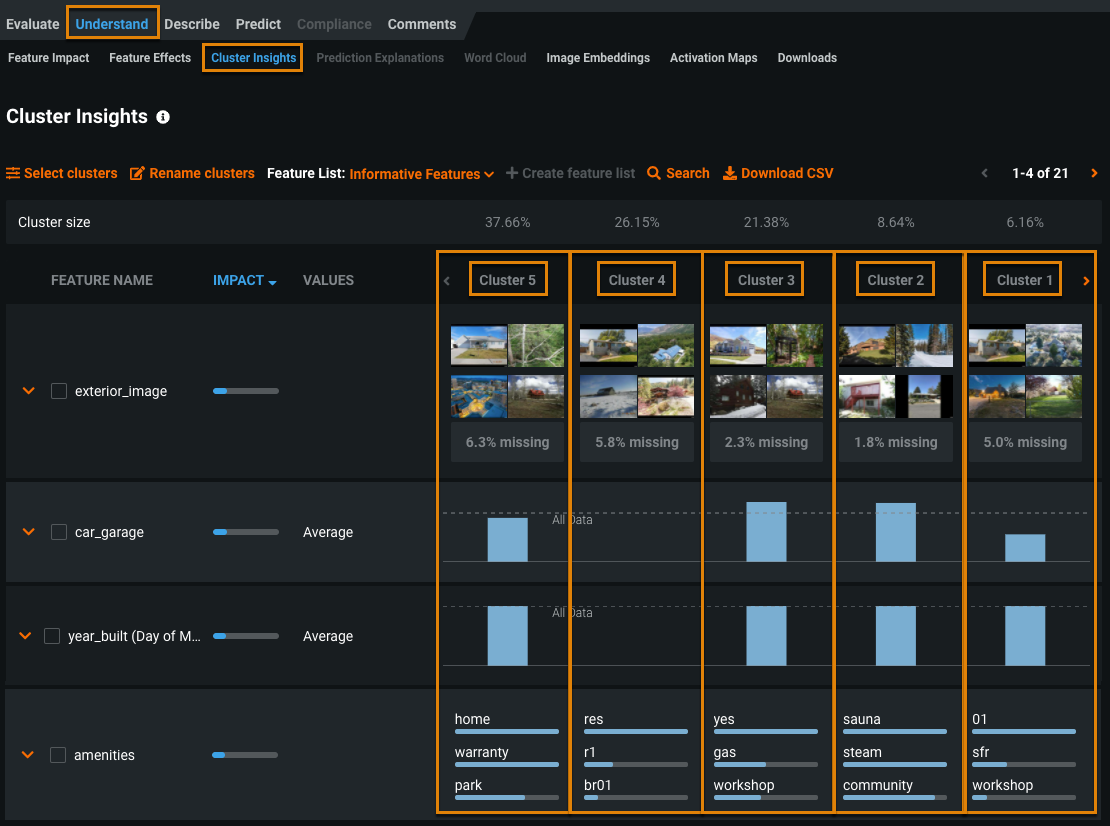
The Cluster Insights visualization (Understand > Cluster Insights) helps you investigate clusters generated during modeling.
Compare the feature values of each cluster to gain an understanding of the groupings.
Image Embeddings
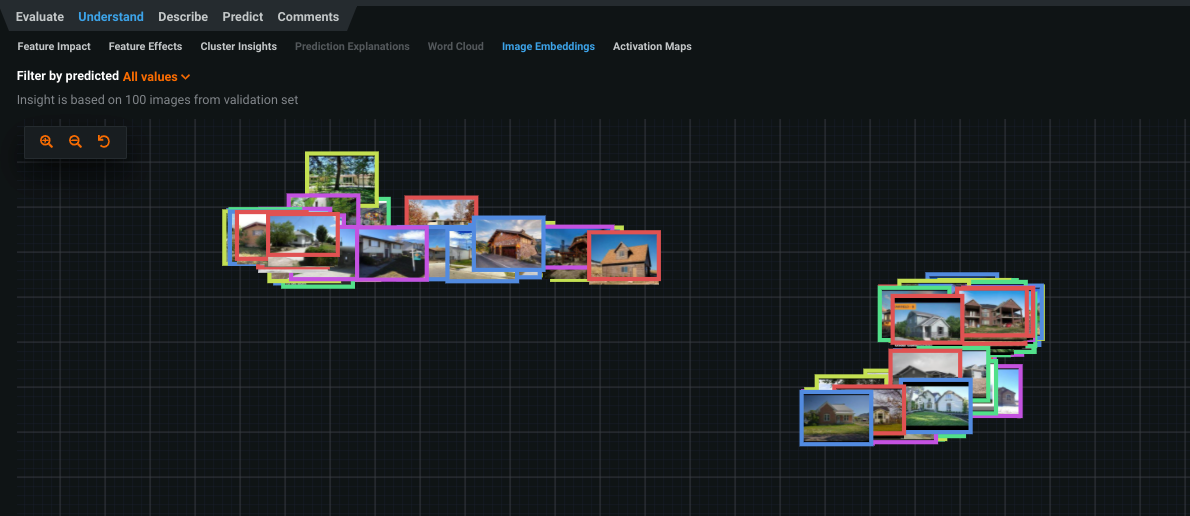
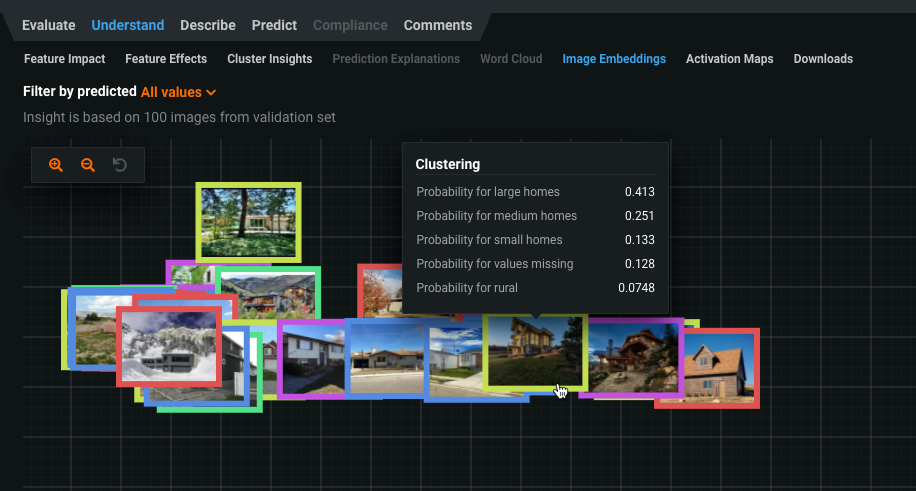
If your dataset contains images, use the Image Embeddings visualization (Understand > Image Embeddings) to see how the images from each cluster are sorted.
For clustering models, the frame of each image displays in a color that represents the cluster containing the image. Hover over an image to view the probability of the image belonging to each cluster.
Activation Maps
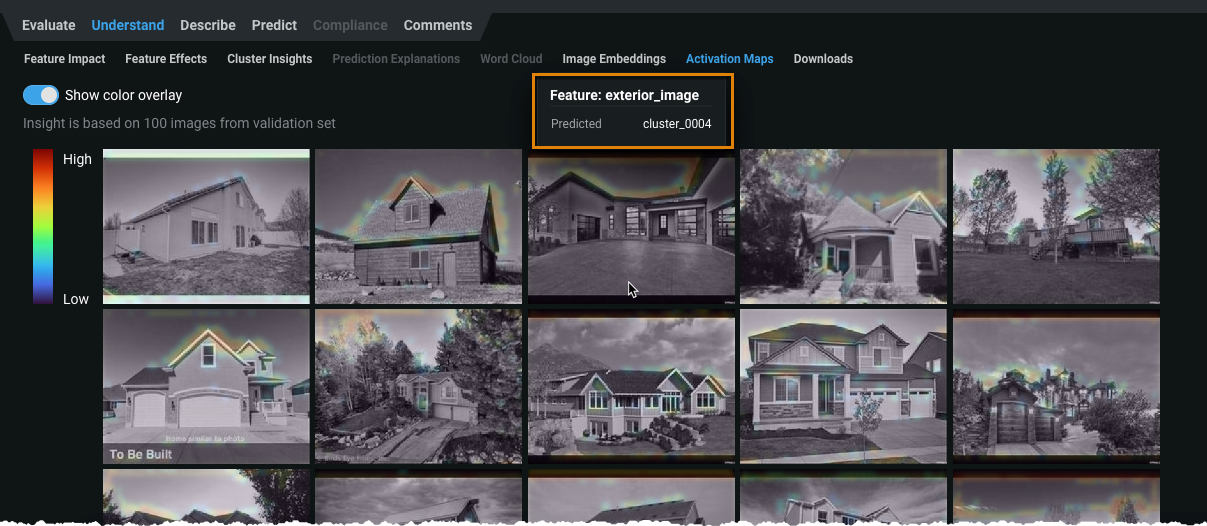
With Activation Maps, you can see which image areas the model is using when making prediction decisions, in this case, how best to cluster the data. Hover over an image to see which cluster the image was assigned to.
Note
For unsupervised projects, the default image preprocessing uses low-level featurization while supervised projects use multi-level featurization. See Granularity for details. See also the Visual AI reference.
Feature Impact
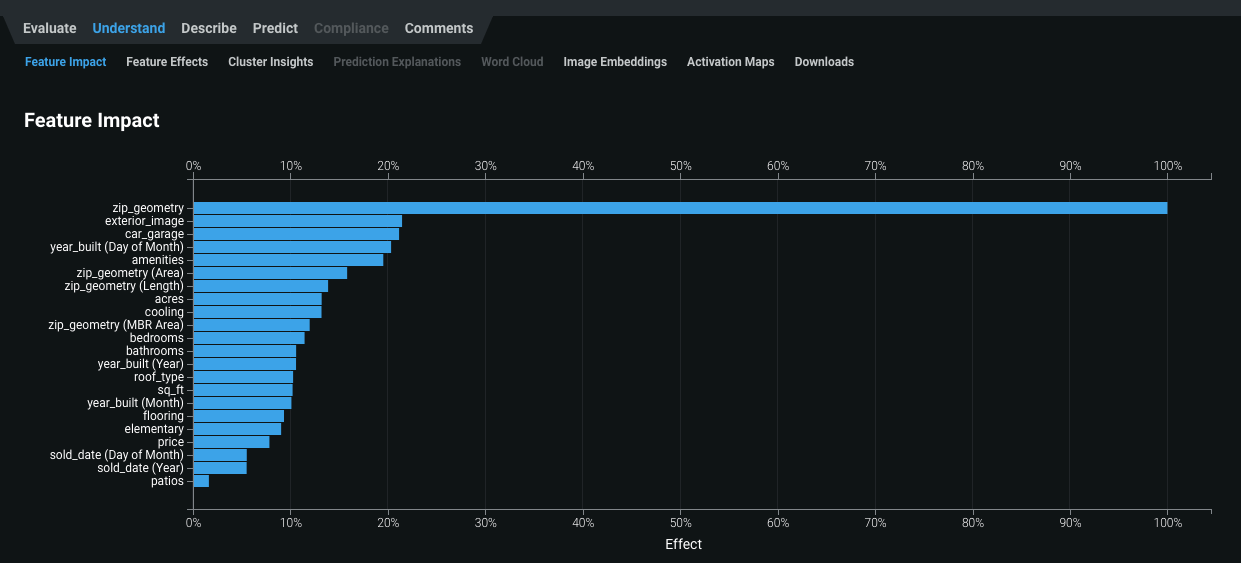
Use the Feature Impact tool (Understand > Feature Impact) to see which features had the most influence on the clustering outcomes:
How is Feature Impact calculated for clustering projects?
As with supervised projects, DataRobot permutes each feature and looks at how much the prediction changes based on the RMSE metric. The larger the change, the higher the impact of the feature.
Feature Associations
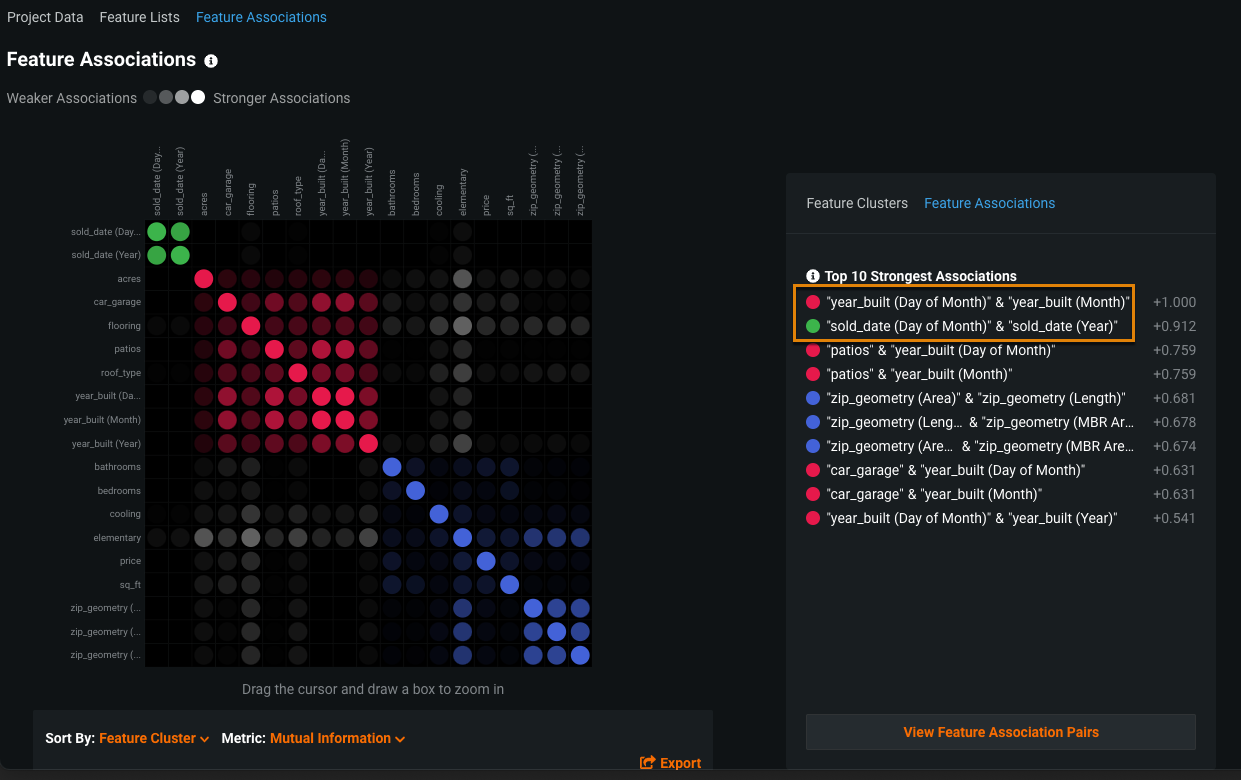
Because clustering can be computationally expensive, you might want to use the Feature Associations tool (Data > Feature Associations) to determine if there are redundant features that you can possibly remove.
In this example, year_built and sold_date derive features that are highly correlated and thus might not be useful to the clustering algorithms. If so, you can remove the features and rerun clustering.
Note
To generate feature associations for a clustering project (or any unsupervised learning project), DataRobot uses the first 50 features alphabetically. Unlike supervised learning where the ACE score is used to select features, unsupervised projects don't use targets and therefore cannot compute the ACE score.
Configure the number of clusters
Some clustering algorithms (i.e., K-Means) require a cluster count prior to modeling. Others (i.e., HDBSCAN—Hierarchical Density-Based Spatial Clustering of Applications with Noise) discover an effective number of clusters dynamically. You can learn more about these clustering algorithms in their blueprints.
How do you decide the number of clusters?
To detect the number of clusters, test out models that use different cluster counts and take a look at the distributions of the clusters. In some cases, you might want a balanced distribution. In other cases, you might want smaller, more fine-grained clusters. For example, for customer segmenting, a small cluster might be more actionable because you can target a smaller group of customers efficiently.
The following sections discuss how to set the cluster count:
Set the number of clusters in Advanced Options
Prior to starting a clustering run, you can customize the number of clusters you want DataRobot to use:
-
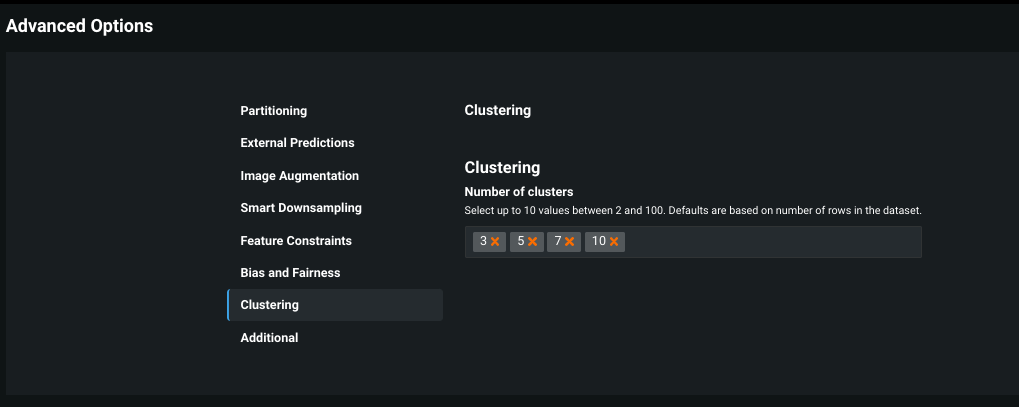
After you upload your data and set up clustering mode, click Advanced settings. In the Advanced Options section that displays, click Clustering on the left.
-
Enter one or more numbers in the Number of clusters field. You can enter up to 10 numbers. For each number you enter, DataRobot trains multiple models, one for each algorithm that supports setting a fixed number of clusters (such as K-Means or Gaussian Mixture Model).
Update the number of clusters and rerun a model
To rerun a model on a different number of clusters:
-
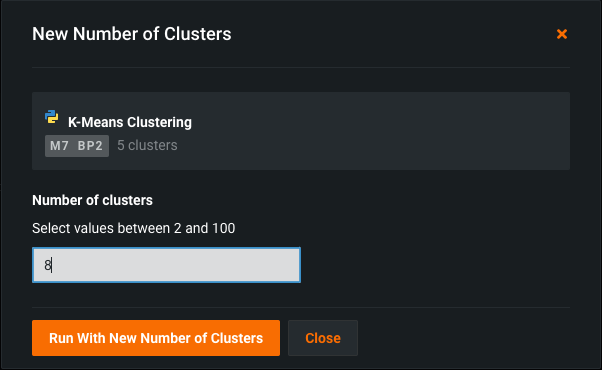
Click the + icon in the Clusters column of the model.
-
Enter the number of clusters to use for the run.
Update the number of clusters and rerun all models
To update the number of clusters and rerun all models:
-
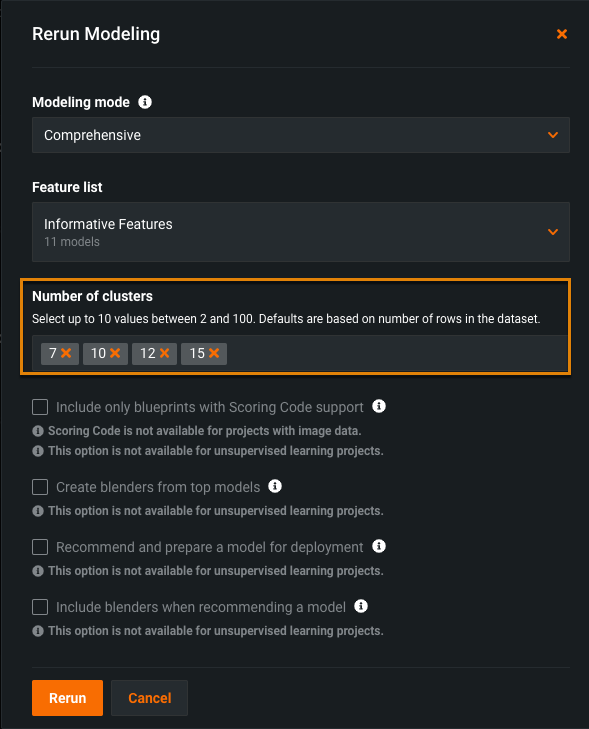
Click Rerun modeling on the Workers pane on the right.
-
Update the numbers of clusters you want the clustering algorithms to use and click Rerun.
For this example, DataRobot runs clustering algorithms using 7, 10, 12, and 15 clusters.
Feature considerations
When using clustering, consider the following:
- Datasets for clustering projects must be less than 5GB.
-
The following is not supported:
- Relational data (summarized categorical features, for example)
- Word Clouds
- Feature Discovery projects
- Prediction Explanations
- Scoring Code
- Composable ML
-
Clustering models can be deployed to dedicated prediction servers, but Portable Prediction Servers (PPS) and monitoring agents are not supported.
- The maximum number of clusters is 100.
See also the time series-specific clustering considerations.
