Feature Impact
Note
To retrieve the SHAP-based Feature Impact visualization, you must enable the Include only models with SHAP value support advanced option prior to model building.
Feature Impact shows, at a high level, which features are driving model decisions the most. By understanding which features are important to model outcome, you can more easily validate if the model complies with business rules. Feature Impact also helps to improve the model by providing the ability to identify unimportant or redundant columns that can be dropped to improve model performance.
Note
Be aware that Feature Impact differs from the feature importance measure shown in the Data page. The green bars displayed in the Importance column of the Data page are a measure of how much a feature, by itself, is correlated with the target variable. By contrast, Feature Impact measures how important a feature is in the context of a model.
There are three methodologies available for rendering Feature Impact—permutation, SHAP, and tree-based importance. To avoid confusion when the same insight is produced yet potentially returns different results, they are not displayed next to each other. Sections below describe the differences and how to compute each.
Feature Impact, which is available for all model types, is calculated using training data. It is an on-demand feature, meaning that you must initiate a calculation to see the results. Once you have had DataRobot compute the feature impact for a model, that information is saved with the project (you do not need to recalculate each time you re-open the project). It is also available for multiclass models and offers unique functionality.
Shared permutation-based Feature Impact
The Feature Impact and Prediction Explanations tabs share computational results (Prediction Explanations rely on the impact computation). If you calculate impact for one, the results are also available to the other. In addition to the Feature Impact tab, you can initiate calculations from the Deploy and Feature Effects tabs. Also, DataRobot automatically runs permutation-based Feature Impact the top-scoring Leaderboard model.
Interpret and use Feature Impact
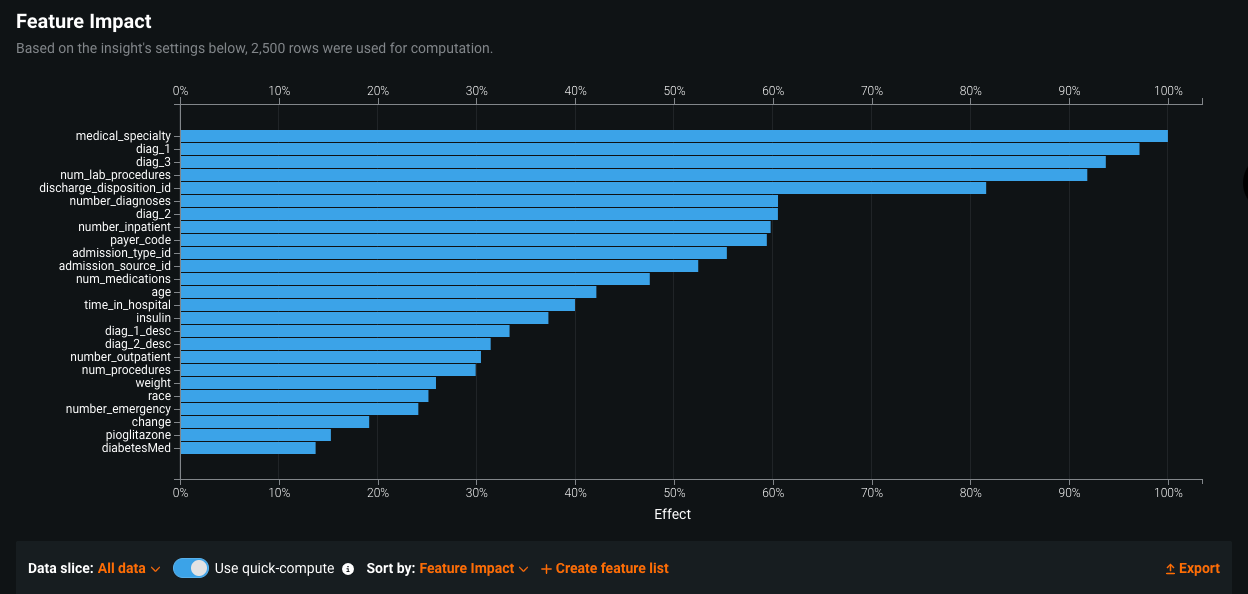
Feature Impact shows, at a high level, which features are driving model decisions. By default, features are sorted from the most to the least important. Accuracy of the top most important model is always normalized to 1.
Feature Impact informs:
-
Which features are the most important—is it demographic data, transaction data, or something else that is driving model results? Does it align with the knowledge of industry experts?
-
Are there opportunities to improve the model? There might be some features having negative accuracy or some redundant features. Dropping them might increase model accuracy and speed. Some features may have unexpectedly low importance, which may be worth investigating. Is there a problem in the data? Were data type defined incorrectly?
Consider the following when evaluating Feature Impact:
-
Feature Impact is calculated using a sample of the model's training data. Because sample size can affect results, you may want to recompute the values on a larger sample size.
-
Occasionally, due to random noise in the data, there may be features that have negative feature impact scores. In extremely unbalanced data, they may be largely negative. Consider removing these features.
-
The choice of project metric can have a significant effect on permutation-based on Feature Impact results. Some metrics, such as AUC, are less sensitive to small changes in model output and may therefore be less optimal for assessing how changing features affect model accuracy.
-
Under some conditions, Feature Impact results can vary due to the function of the algorithm used for modeling. This could happen, for example, in the case of multicollinearity. In this case, for algorithms using L1 penalty—such as some linear models—impact will be concentrated to one signal only while for trees, impact will be spread uniformly over the correlated signals.
Feature Impact methodologies
There are three methodologies available for computing Feature Impact in DataRobot—permutation, SHAP, and tree-based importance.
-
Permutation-based shows how much the error of a model would increase, based on a sample of the training data, if values in the column are shuffled.
-
SHAP-based shows how much, on average, each feature affects training data prediction values. For supervised projects, SHAP is available for AutoML projects only. See also the SHAP reference and SHAP considerations.
-
Tree-based variable importance uses node impurity measures (gini, entropy) to show how much gain each feature adds to the model.
Overall, DataRobot recommends using either permutation-based or SHAP-based Feature Impact as they show results for original features and methods are model agnostic.
Some notable differences between methodologies:
-
Permutation-based impact offers a model-agnostic approach that works for all modeling techniques. Tree-based importance only works for tree-based models, SHAP only returns results for models that support SHAP.
-
SHAP Feature Impact is faster and more robust on a smaller sample size than permutation-based Feature Impact.
-
Both SHAP- and permutation-based Feature Impact show importance for original features, while tree-based impact shows importance for features that have been derived during modeling.
DataRobot uses permutation by default, unless you:
- Set the mode to SHAP in the Advanced options link before starting a project.
- Are creating a project type that is unsupervised anomaly detection.
Feature Impact for unsupervised projects
Feature Impact for anomaly detection is calculated by aggregating SHAP values (for both AutoML and time series projects). This technique is used instead of permutation-based calculations because the latter requires a target column to calculate metrics. With SHAP, approximation is computed for each row out-of-sample and then averages them per column. The sample is taken uniformly across the training data.
Generate the Feature Impact chart
Note
Time series models have additional settings available.
For permutation- and SHAP-based Feature Impact:
-
Select the Understand > Feature Impact tab for a model.
-
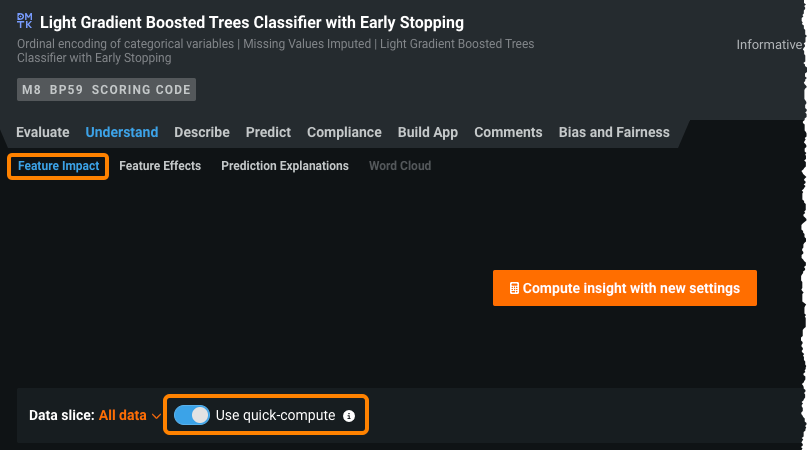
(Optional) Select whether to use quick-compute.
-
Click Compute Feature Impact. DataRobot displays the status of the computation in the right-pane, on the Worker Usage panel. In addition, the Compute box is replaced with a status indicator reporting the percentage of completed features.
-
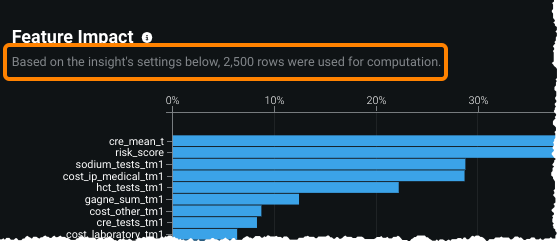
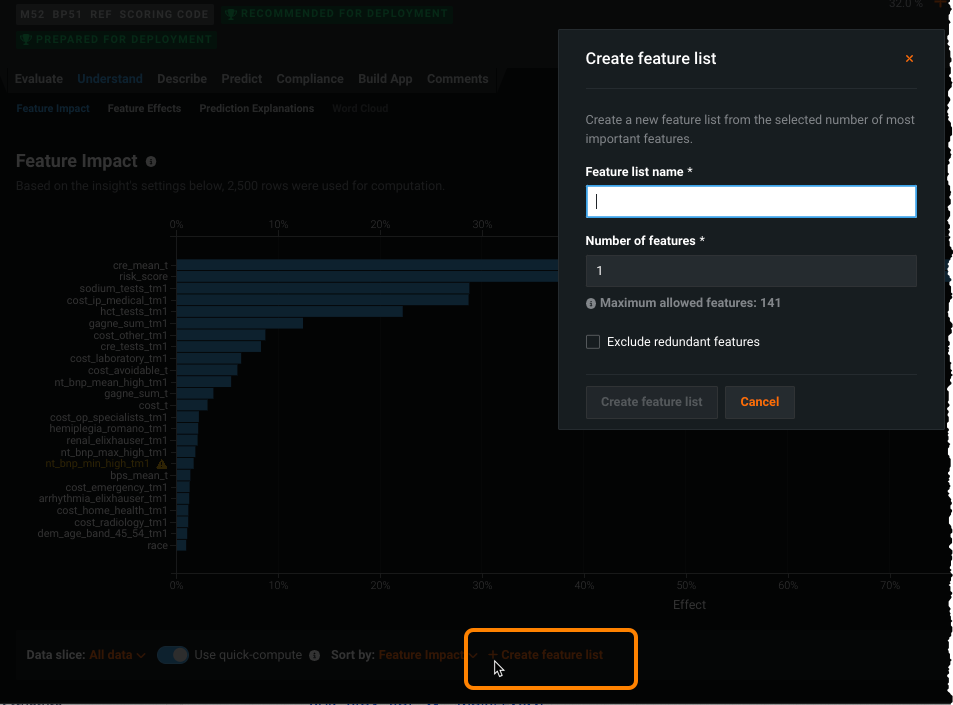
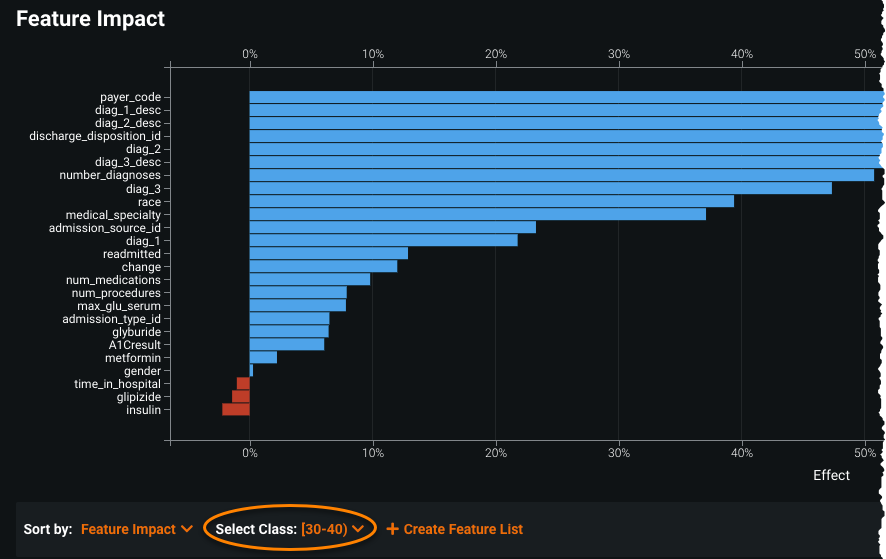
When DataRobot completes its calculations, the Feature Impact graph displays a chart of up to 25 of the model's most important features, ranked by importance. The chart lists feature names on the Y-axis and predictive importance (Effect) on the X-axis. It also indicates the number of rows used in the calculation.
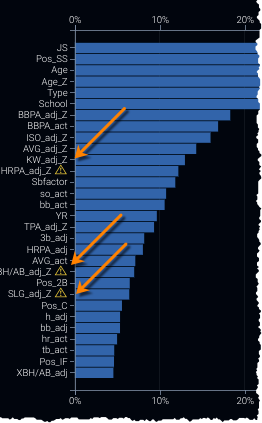
DataRobot may report redundant features in the output (indicated by an icon
 ). You can use the redundancy information to easily create special feature lists that remove those features.
 -
By default, the chart displays features based on impact (importance), but you can also sort alphabetically. Click on the Sort by dropdown and select Feature Name.
-
(Optional) Create or select a different data slice to view a subpopulation of the data.
-
(Optional) Click the Export button to download a CSV file containing up to 1000 of the model's most important features.
Tree-based variable importance information is available from the Insights > Tree-based Variable Importance.
Quick-compute
When working with Feature Impact, the Use quick-compute option controls the sample size used in the visualization. The row count used to build the visualization is based on the toggle setting and whether a data slice is applied.
For unsliced Feature Impact, when toggled:
-
On: DataRobot uses 2500 rows or the number of rows in the model training sample size, whichever is smaller.
-
Off: DataRobot uses 100,000 rows or the number of rows in the model training sample size, whichever is smaller.
When a data slice is applied, when toggled:
-
On: DataRobot uses 2500 rows or the number of rows available after a slice is applied, whichever is smaller.
-
Off: DataRobot uses 100,000 rows or the number of rows available after a slice is applied, whichever is smaller.
You may want to use this option, for example, to train Feature Impact at a sample size higher than the default 2500 rows (or less, if downsampled) in order to get more accurate and stable results.
Note
When you run Feature Effects before Feature Impact, DataRobot initiates the Feature Impact calculation first. In that case, the quick-compute option is available on the Feature Effects screen and sets the basis of the Feature Impact calculation.
Create a new feature list
Once you have computed feature impact for a model, you may want to create one or more feature lists based on the top feature importances for that model or, for permutation-based projects, with redundant features removed. (There is more information on feature lists here.) You can then re-run the model using the new feature list, potentially creating even more accurate results. Note also that if the smaller list does not improve model performance, it is still valuable since models with fewer features run faster. To create a new feature list from the Feature Impact page:
-
After DataRobot completes the feature impact computation, click Create Feature List.
-
Enter the number of features to include in your list. These are the top X features for impact (regardless of whether they are sorted alphabetically). You can select more than the 30 features displayed. To view more than the top 30 features, export a CSV and determine the number of features you want from that file.
-
(Optional) Check Exclude redundant features to build a list with redundant features removed. These are the features marked with the redundancy (
 ) icon.
 -
After you complete the fields, click Create feature list to create the list. When you create the new feature list, it becomes available to the project in all feature list dropdowns and can be viewed in the Feature List tab of the Data page.
Remove redundant features (AutoML)
When you run permutation-based Feature Impact for a model, DataRobot evaluates a subset of training rows (2500 by default, or up to 100,000 by request), calculating their impact on the target. If two features change predictions in a similar way, DataRobot recognizes them as correlated and identifies the feature with lower feature impact as redundant (![]() ). Note that because model type and sample size have an effect on feature impact scores, redundant feature identification differs across models and sample sizes.
). Note that because model type and sample size have an effect on feature impact scores, redundant feature identification differs across models and sample sizes.
Once redundant features are identified, you can create a new feature list that excludes them, and optionally, that includes user-specified top-N features. When you choose to exclude redundant features, DataRobot "recalculates" feature impact, which may result in different feature ranking, and therefore a different order of top features. Note that the new ranking does not update the chart display.
"Recalculating" Feature Impact
When you create a new feature list and choose to exclude redundant features, DataRobot uses the existing Feature Impact data calculations and some additional heuristics. The process works as follows:
- DataRobot identifies redundant features. In each group, DataRobot identifies the feature with the higher impact and chooses it as the "primary" feature. For example, you may have
Height (in),Height (cm), andHeight (mm), which are all redundant. DataRobot selects one—Height (cm)perhaps—as the feature to be kept, and marks each of the others as redundant withHeight (cm). - If you select Remove redundant features, DataRobot creates a feature list with all redundant features removed.
- For each removed feature, DataRobot assigns a portion* of its impact to the "primary" feature that it is redundant with.
- DataRobot re-ranks the remaining features based on Step 3. It is the new ranking that the top X features are selected from a visualized.
* For each dropped redundant feature, DataRobot adds (0.7 * corr) * <raw redundant feature impact> score to the "primary" feature. The value of corr is the degree of correlation between shuffled predictions of the primary feature and shuffled predictions of the redundant feature. For the features to be marked as redundant in the first place, corr >= 0.85.
Feature Impact with time series (permutation only)
Note
Data slices are available as a preview feature for OTV and time series projects.
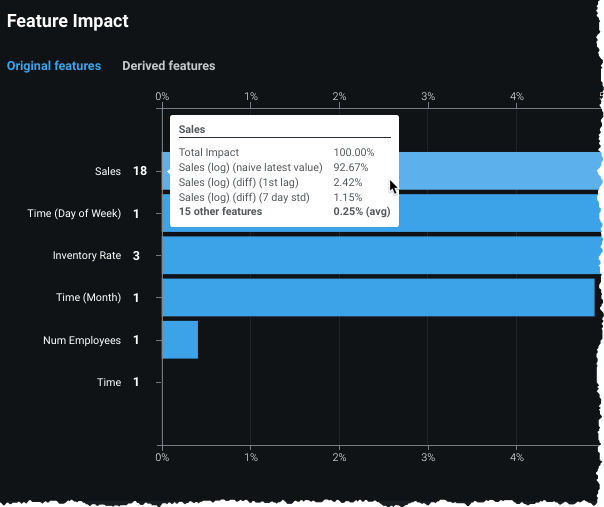
For time series models, you have an option to see results for original or derived features. When viewing original features, the chart shows all features derived from the original parent feature as a single entry. Hovering on a feature displays a tooltip showing the aggregated impact of the original and derived features (the sum of derived feature impacts).
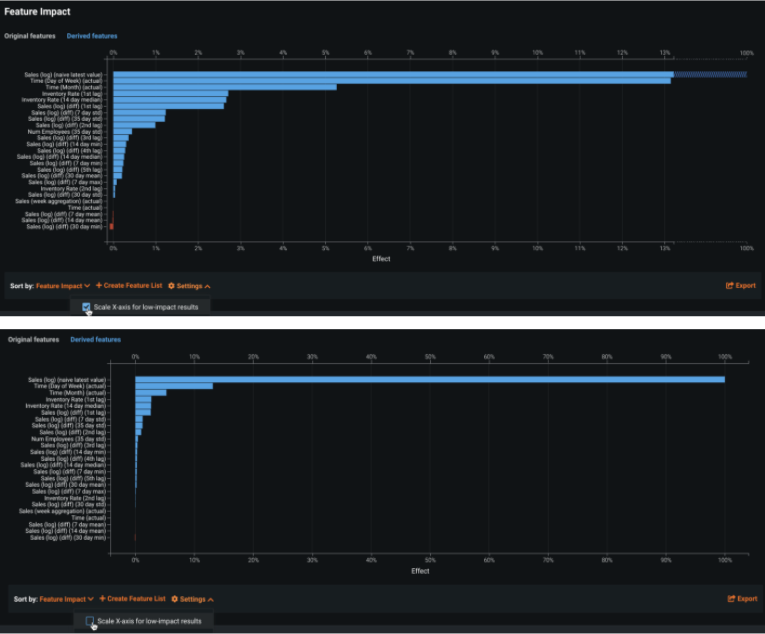
Additionally, you can rescale the plot (on by default), which will zoom in to show lower impact results, from the Settings link. This is useful in cases where the top feature has a significantly higher impact than other features, preventing the plot from displaying values for the lesser features.
Note that the Settings link is only available if scaling is available. The link is hidden or shown based on the ratio of Feature Impact values (whether they are high enough to need scaling). Specifically, it is only shown if highest_score / second_highest_score > 3.
Remove redundant features (time series)
The Exclude redundant features option for time series works similarly to the AutoML option, but applies it to date/time partitioned projects. For time series, the new feature list can be built from the derived features (the modeling dataset) and Feature Impact can then be recalculated to help improve modeling by using a selected set of impactful features.
Feature Impact with multiclass models (permutation only)
For multiclass models, you can calculate Feature Impact to find out how important a feature is not only for the model in general, but also for each individual class. This is useful for determining how features impact training on a per-class basis.
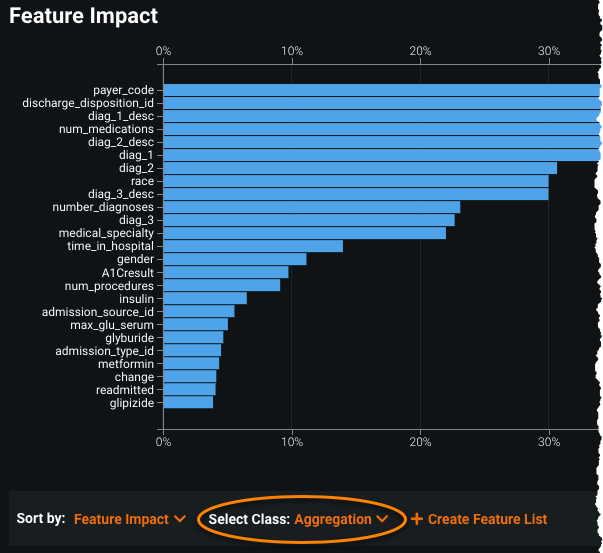
After calculating Feature Impact, an additional Select Class dropdown appears with the chart.
The Aggregation option displays the Feature Impact chart like any other model; it displays up to 25 of the model's most important features, listed most important to least. Select an individual class to see its individual Feature Impact scores on a new chart.
Click the Export button to download an image of the chart and a CSV file containing the most important features of the aggregation or an individual class. You can download a ZIP file that instead contains the Feature Impact scores and charts for every class and the aggregation.
Method calculations
This section contains technical details on computation for each of the three available methodologies:
- Permutation-based Feature Impact
- SHAP-based Feature Impact
- Tree-based variable importance
Permutation-based Feature Impact
Permutation-based Feature Impact measures a drop in model accuracy when feature values are shuffled. To compute values, DataRobot:
- Makes predictions on a sample of training records—2500 rows by default, maximum 100,000 rows.
- Alters the training data (shuffles values in a column).
- Makes predictions on the new (shuffled) training data and computes a drop in accuracy that resulted from shuffling.
- Computes the average drop.
- Repeats steps 2-4 for each feature.
- Normalizes the results (i.e., the top feature has an impact of 100%).
The sampling process corresponds to one of the following criteria:
- For balanced data, random sampling is used.
- For imbalanced binary data, smart downsampling is used; DataRobot attempts to make the distribution for imbalanced binary targets closer to 50/50 and adjusts the sample weights used for scoring.
- For zero-inflated regression data, smart downsampling is used; DataRobot groups the non-zero elements into the minority class.
- For imbalanced multiclass data, random sampling is used.
SHAP-based Feature Impact
SHAP-based Feature Impact measures how much, on average, each feature affects training data prediction value. To compute values, DataRobot:
- Takes a sample of records from the training data (5000 rows by default, with a maximum of 100,000 rows).
- Computes SHAP values for each record in the sample, generating the local importance of each feature in each record.
- Computes global importance by taking the average of
abs(SHAP values)for each feature in the sample. - Normalizes the results (i.e., the top feature has an impact of 100%).
Tree-based variable importance
Tree-based variable importance uses node impurity measures (gini, entropy) to show how much gain each feature adds to the model.
