Time series predictions
Availability information
Contact your DataRobot representative for information on enabling automated time series (AutoTS) modeling.
See these additional considerations for working with time series modeling.
Before making predictions, prepare your model, as described in the following sections.
About final models
The original ("final") model is trained without holdout data and therefore does not have the most recent data. Instead, it represents the first backtest. This is so that predictions match the insights, coefficients, and other data displayed in the tabs that help evaluate models. (You can verify this by checking the Final model representation on the New Training Period dialog to view the data your model will use.) If you want to use more recent data, retrain the model using start and end dates.
Note
Be careful retraining on all your data. In Time Series it is very common for historical data to have a negative impact on current predictions. There are a lot of good reasons not to retrain a model for deployment on 100% of the data. Think through how the training window can impact your deployments and ask yourself:
- "Is all of my data actually relevant to my recent predictions?
- Are there historical changes or events in my data which may negatively affect how current predictions are made, and that are no longer relevant?"
- Is anything outside my Backtest 1 training window size actually relevant?
Retrain before deployment
Once you have selected a model and unlocked holdout, you may want to retrain the model (although with hyperparameters frozen) to ensure predictive accuracy. Because the original model is trained without the holdout data, it therefore did not have the most recent data. You can verify this by checking the Final model representation on the New Training Period dialog to view the data your model will use.
To retrain the model, do the following:
-
On the Leaderboard, click the plus sign (+) to open the New Training Period dialog and change the training period.
-
View the final model and determine whether your model is trained on the most up-to-date data.
-
Enable Frozen run by clicking the slider.
-
Select Start/End Date and enter the dates for the retraining, including the dates of the holdout data. Remember to use the “+1” method (enter the date immediately after the final date you want to be included).
Model retraining
Retraining a model on the most recent data* results in the model not having out-of-sample predictions, which is what many of the Leaderboard insights rely on. That is, the child (recommended and rebuilt) model trained with the most recent data has no additional samples with which to score the retrained model. Because insights are a key component to both understanding DataRobot's recommendation and facilitating model performance analysis, DataRobot links insights from the parent (original) model to the child (frozen) model.
* This situation is also possible when a model is trained into holdout ("slim-run" models also have no stacked predictions).
The insights affected are:
- ROC Curve
- Lift Chart
- Confusion Matrix
- Stability
- Forecast Accuracy
- Series Insights
- Accuracy Over Time
- Feature Effect
Make Predictions tab
There are two methods for making predictions with time series models:
-
For prediction datasets that are less than 1GB, use the Make Predictions tab from the Leaderboard. This is the method described below.
-
For prediction datasets between 1GB and 5GB, consider deploying the model and using the batch predictions capabilities available from Deployments > Predictions.
Note
Be aware that using a forecasting range with time series predictions can result in a significant increase over the original dataset size. Use the batch predictions capabilities to avoid out-of-memory errors.
The Leaderboard Make Predictions tab works slightly differently than with traditional modeling. The following describes, briefly, using Make Predictions with time series; see the full Make Predictions tab details for more information.
Note
ARIMA model blueprints must be provided with full history when making batch predictions.
The Make Predictions tab provides summaries to help determine how much recent data—either time unit or rows, depending on how you configured your feature derivation and forecast point windows—is required in the prediction dataset and to review the forecast rows and KA settings. Note that the list of features displayed as KA only includes those KA features that are part of the feature list used to build the current model. The Forecast Settings tab provides an overview of the prediction dataset for help in changing settings as well as access to the auto-generated prediction file template.
In this example, the prediction dataset needs at least 42 days of historical data and can predict (return) up to 7 rows. That is because although the model was configured for 35 days before the forecast point, seven days are added to the required history because the model uses seven-day differencing. Generally, Historical rows = FDW size + seasonality, where seasonality is the longest periodicity detected. Note that rows needed for training are calculated as Historical rows = FDW size + seasonality + FW size.
The following provides an overview to making predictions with time series modeling:
-
Once you have selected a model to use for predictions, if you haven't already done so you are prompted to unlock holdout and retrain the model. It's a good idea to complete this step so that the model uses the most recent data, but it is not required.
-
Prepare and upload your prediction dataset. Either upload a prediction-ready dataset with the required forecast rows for predictions or let DataRobot build you a prediction file template.
-
(Optional) Change the forecast point—the date to begin making predictions from—from the DataRobot default.
Create a prediction-ready dataset
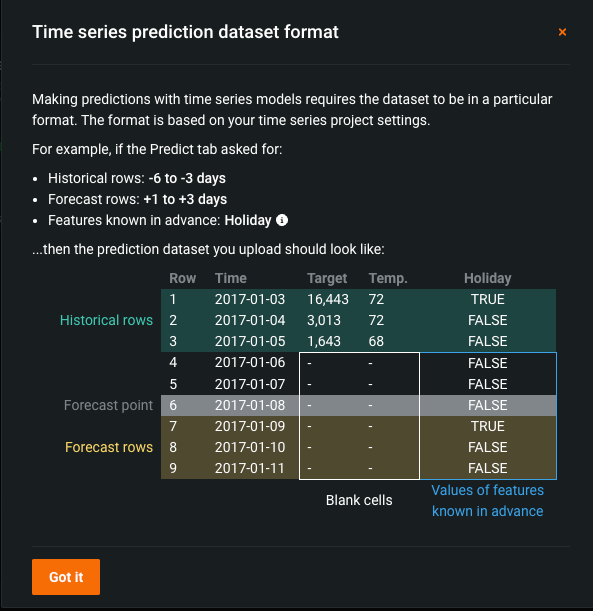
If you choose to manually create a prediction dataset, use the provided summary to determine the number of historical rows needed. (Optional) Open Forecast Settings to change the forecast point, making sure that the historical row requirements from your new forecast point are met in the prediction dataset. If needed, click See an example dataset for a visual representation of the format required for the CSV file.
The following example shows that you would leave the target and non-KA values in rows 7 through 9 (the "Forecast rows") blank; DataRobot fills in those rows with the prediction values when you compute predictions.
When your prediction dataset is in the appropriate format, click Import data from to select and upload it into DataRobot. Then, compute predictions.
Note
While KA features can have missing values in the prediction data inside of the forecast window, that configuration may affect prediction accuracy. DataRobot surfaces a warning and also an information message beneath the affected dataset. Also, if you have missing history when picking a forecast point that is later than the default, DataRobot will still allow you to compute predictions.
Prediction file template
If your forecast point setting requires additional forecast rows be added to the original prediction dataset, DataRobot automatically generates a template file that appends those needed rows. Use the auto-generated prediction template as-is or download and make modifications. To create the template, click Import data from to select and upload the intended dataset. DataRobot generates the template if it does not find at least one row after the default forecast point that does not include a target value (no empty forecast rows) and therefore can be a forecast row.
For example, let's say your forecast window is +5 ... +6 and the default forecast point is t0. Points t5 and t6 are missing, but points t1 and t are present. In this case, DataRobot generates the extended file because it found no forecast rows that satisfy t5 or t6 after the default forecast point.
For DataRobot to generate a template, the following conditions must be met:
- There are no supported forecast rows (empty target rows that fall within the forecast window).
- The generated template file size is less than the upload file limit.
Use the template as-is
Use the template as-is if you do not need to modify the forecast rows or add any KA features. DataRobot will set the forecast point and add the full number of rows required to satisfy the project's forecast window configuration.
Use the default auto-expansion if you are using the most recent data as your forecast point, have no gaps, and want the full number of rows. In this case, you can upload the dataset and compute predictions.
Modify the template
DataRobot generates the prediction file template as soon as you upload a prediction dataset. However, there are cases where you may want to modify that template before computing predictions:
-
You have identified a column as a KA feature and need to enter relevant information in the forecast rows.
-
You have multiple series and want to predict on fewer than every series in the dataset. (DataRobot adds the necessary number of rows for each series in the dataset.)
-
Based on your settings DataRobot would have generated several additional rows but you want to predict on fewer.
To modify a template:
-
Click Forecast Settings (Forecast Point Predictions tab), expand the Advanced options link, and download the auto-generated prediction file template:
-
Open the template and add any required information to the new forecast rows or remove rows you don't need as they will only slow predictions.
-
Save the modified template and upload it back into DataRobot using Import data from.
-
(Optional) Set the forecast point to something other than the default.
Forecast settings
DataRobot chooses a default forecast point (1) to base predictions on. The default date is a forecast point that is the most recent valid timestamp that maximizes the usage of time history within the feature derivation window. However, you can change the default to:
- A customized forecast point that sets a specific date (forecast point) from which you want to begin making predictions.
- A forecast range that sets a range of forecast distances within a selected date range.
Use the Forecast Settings modal (2) to configure a date setting other than the default setting.
Note
The default forecast point is either the most recent row in the dataset that contains a valid target value or, if you configured gaps during project setup, it is the row in the dataset that satisfies the feature derivation window’s history requirements. Note also that you must use the default forecast point for fractional-second forecasts.
Forecast Point Predictions
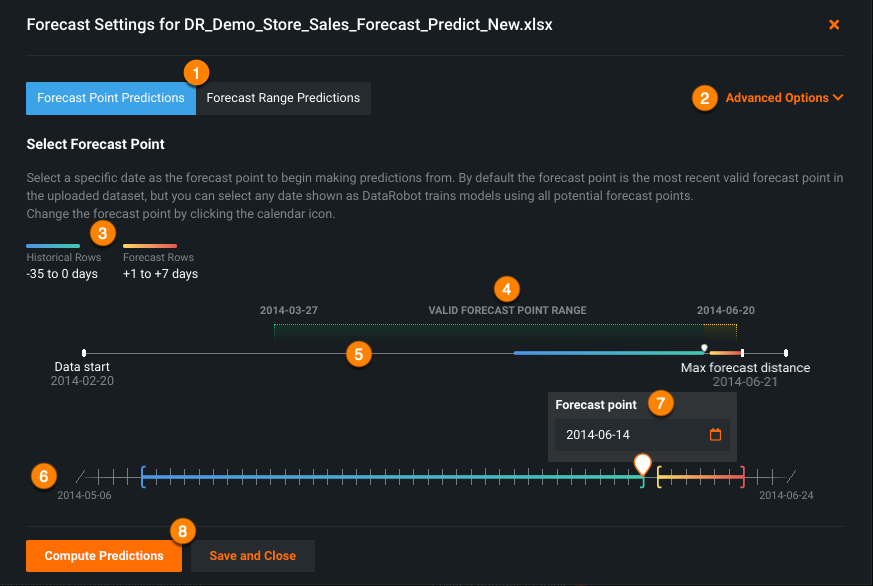
Use Forecast Point Predictions to select the specific date (forecast point) from which you want to begin making predictions. You can select any date shown since DataRobot trains models using all potential forecast points. Be sure, if you select a different forecast point, that your dataset has enough history. See the table for descriptions of each field.
Forecast Range Predictions
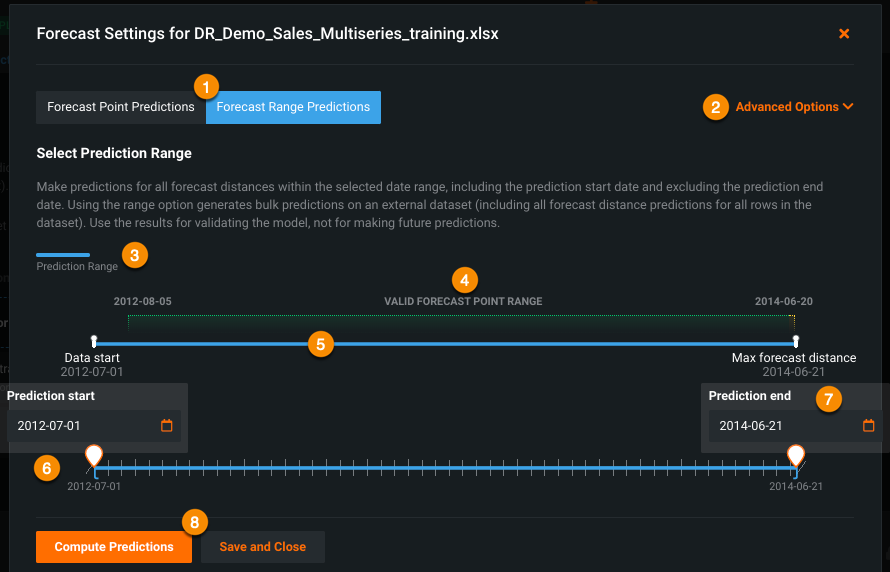
Use Forecast Range Predictions for making predictions on all forecast distances within the selected date range. This option provides bulk predictions on an external dataset, including all forecast distance predictions for all rows in the dataset. Use the results for validating the model, not for making future predictions.
Note
When using range predictions, DataRobot includes the prediction start date and excludes the prediction end date. In other words, the last date in the range is not a forecast point in the prediction output.
Forecast Range Predictions are helpful for validating model accuracy. DataRobot extracts the actual values for all points in time from the dataset. Set the prediction start and end dates to define the historical range of time for which you want bulk predictions. Because this model evaluation process uses actual values, DataRobot only generates predictions for timestamps that can support predictions for every forecast distance. See the table for descriptions of each field.
Forecast settings definitions
The following table describes the forecast point and forecast range configuration fields:
| Element | Description | |
|---|---|---|
| 1 | Prediction type selector | Selects either forecast point (specific start date) or forecast range (bulk predictions). |
| 2 | Advanced options | Expands to download the prediction file template (if created). |
| 3 | Row summary (forecast point) |
Provides the same summary information as that on the Make Predictions tab. Colors correspond to the visualization above (6), showing the historical and forecast rows set during original project creation. |
| 3 | Row summary (forecast range) |
A legend indicating the meaning of the line (5) above. |
| 4 | Valid forecast options | Indicates, in the context of the date span for the entire dataset (5), the range of dates that are valid forecast settings (dates that will produce valid predictions). While the dotted colored bar above the full range indicates possible valid options, dates within the yellow range are those that extend beyond DataRobot's suggested settings because they have missing history or KA features. Also, if there are gaps inside this range, the predictions may still fail (due to insufficient time history or no forecast row). |
| 5 | Dataset start and end | Within the context of the full range of dates (historical rows) found in the dataset, indicates the range of points you are choosing to forecast. In cases where DataRobot created a prediction file template, the dataset end date and template file end date are both represented. If the dataset end and max forecast distance are the same, the display does not show the dataset end. For forecast point settings, the historical and forecast rows summarized above (3) are also overlaid on the span. The overlay moves as the forecast point setting changes. |
| 6 | Historical and forecast zoom | A zoomed view of the relevant historical rows and forecast rows, intended to simplify selecting a forecast point. As you move the sliders or set a calendar date, the date line above (5), reflects the change. |
| 7 | Date selector | A calendar picker for setting the forecast point or forecast range (start and end dates). Invalid dates—those not indicated in the valid forecast range (4)—are disabled in the calendar. |
| 8 | Compute Predictions | Initiate prediction computation (same as Compute Predictions on the Make Predictions page). Or, save the settings and close the modal without computing predictions. New settings are reflected on the Make Predictions page, and clicking Compute Predictions from there at any future time will use these settings. Alternatively, click the X to close without saving changes. |
Understand dates in forecast settings
When you upload a prediction dataset, DataRobot detects the range of dates (the valid forecast range) available for use as the forecast point. It also determines a default forecast point, which is the latest timestamp available for making predictions with full history.
The following timestamps are marked in the visualization:
- Data start is the timestamp of the first row detected in the dataset.
- Data end is the timestamp of the last row detected in the dataset, whether it is the original or the auto-generated template.
- Max forecast distance is the timestamp of the last possible forecast distance in the dataset.
Before modifying the forecast point, review the basic time series modeling framework.
Some things to consider:
-
What is the most recent valid forecast point? The most recent valid forecast point is the maximum forecast point that can be used to run predictions without error. It may differ from the default forecast point because the default forecast point takes the time history usage into consideration.
-
Based on the forecast window, what is the timestamp of the last prediction that was output? The forecast window is defined relative to the forecast point; the last prediction timestamp is a function of both the forecast window and the timestamp inside the prediction dataset.
For example, consider a forecast window from 1 to 7 days. The forecast point is 2001-01-01, but the max date in the dataset is 2001-01-05. In this case, the max forecast timestamp is 2001-01-05 as there are no rows from 2001-01-06 to 2001-01-08.
-
Consider the length of your forecast window. That is, after the final row with actual values, do you have at least one forecast row (within the boundaries of the forecast window)? If you do, DataRobot will not generate a template; if you do not, DataRobot will generate forecast rows based on the project configuration.
Use the Forecast settings modal to get an overview of the prediction dataset, which aids in choosing settings like the forecast point and prediction start and end dates. In addition, DataRobot generates forecast rows after the final row with actual values (if there are no forecast rows based on the default forecast point), simplifying the prediction workflow. The actual values are the data taken from the last row of each and every series ID and duplicated to the forecast rows.
Time series prediction dataset validation
DataRobot validates a time series prediction dataset once it is uploaded, checking whether there are sufficient historical rows to produce the engineered features required by the project.
If seasonality is detected in the project, additional historical rows—longer than the feature derivation window (FDW)—are required. For example, a project with an FDW of [-14, 0] and 7-day seasonality will require 21 historical days in the prediction dataset to accommodate target differenced features (such as target (7 day diff) (mean)) and differencing features (such as target (14 day max) (diff 7 day mean)). If multiple seasonalities are detected, the longest seasonality is used to perform the validation check.
DataRobot does not require the presence of all historical rows when computing window statistics features (for example, target (7 day mean) or feature (14 day max)). Depending on the FDW settings, DataRobot predetermines the minimum required historical rows for predictions. If there are too many missing historical rows in the prediction dataset, predictions will error.
If a multiplicative trend is detected, DataRobot requires all historical target values in the prediction dataset to be strictly positive (> 0). Zero or negative target value(s) violate the model assumption that the dataset is multiplicative and the prediction generates an error. To correct it, check whether the training dataset is representative of the use case during prediction time or disable the advanced option Treat as exponential trend and recreate the project.
Compute and access predictions
When the forecast point is set and the dataset is in the correct format and successfully uploaded, it's time to compute predictions.
-
There are two methods for computing predictions. Click either:
- the Compute Predictions button on the Forecast Settings modal.
- the Compute Predictions link (next to the Forecast Settings link) on the Make Predictions page.
-
When processing completes, preview the historical data and predictions from the dataset or download a CSV of your predictions. To download, click Download to access predictions:
Note
Notes on prediction output:
• Depending on your permissions, you may see the column, "Original Format Timestamp". This provides the same values provided by the "Timestamp" column but uses the timestamp format from the original prediction dataset. Your administrator can enable this permission for you.
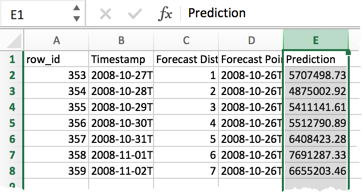
• When working with downloaded predictions, be aware that in time series projects, row_id does not represent the row position from the original project data (for training predictions) or uploaded prediction data for a given timestamp and/or series_id. Instead it is a derived value specific to the project.
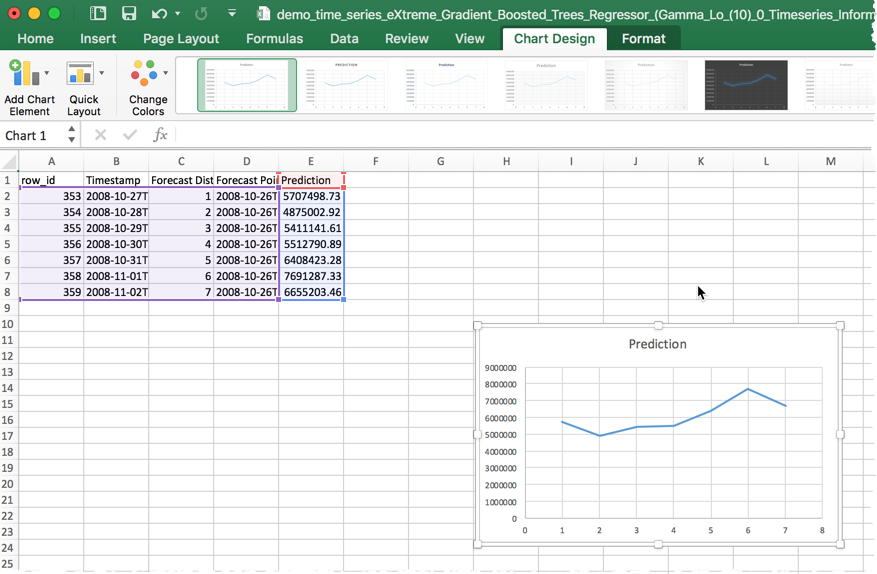
With some spreadsheet software you could go on to graph your prediction output. For example, the sample data shows predicted sales for the next day through the next 7 days, which can then be acted on for inventory and staffing decisions.
Prediction preview
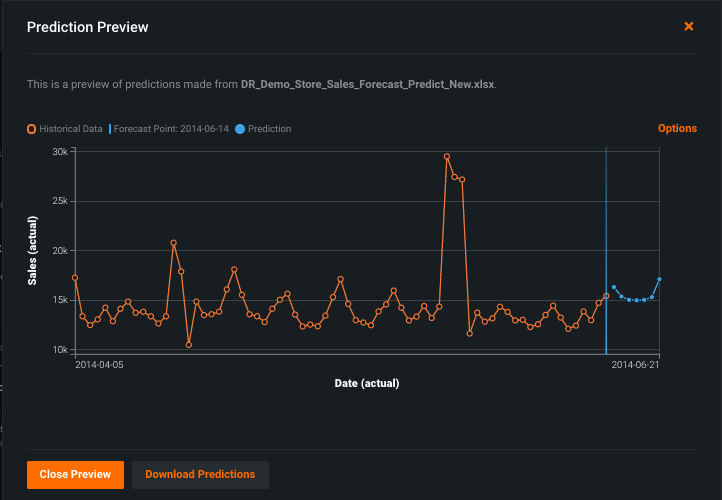
After you have computed predictions, click the Preview link to display a plot of the predictions over time, in the context of the historical data. This plot shows the prediction for each forecast distance at once, relative to a single forecast point.
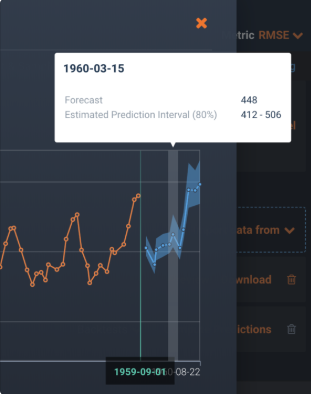
By default, the prediction interval (shaded in blue) represents the area in which 80% of predictions fall. The intervals estimate the range of values DataRobot expects actual values of the target to fall within. They are similar to a prediction's confidence interval, but are instead based on the residual errors measured during the model's backtesting.
For charts meeting the following criteria, the chart displays an estimated prediction interval:
-
All backtests must be trained. In this way, DataRobot can use all available validation rows and prevent different interval values based on the available information.
-
There must be at least 10 data points per forecast distance value.
If the above criteria are not met, DataRobot displays only the prediction values (orange points).
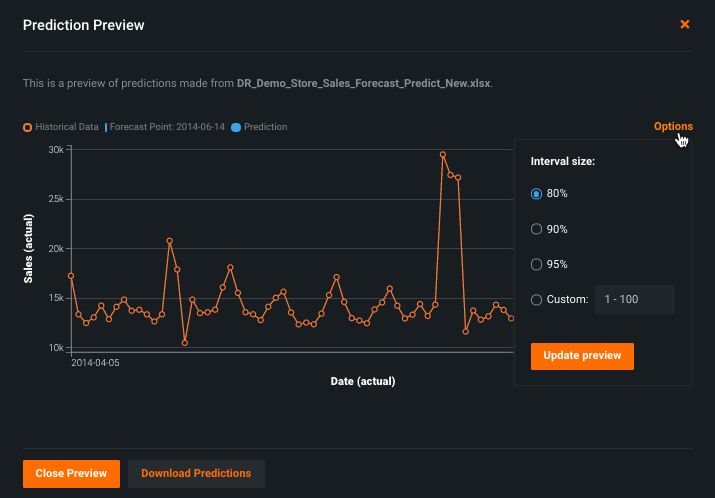
You can specify a prediction interval size, which specifies the desired probability of actual values falling within the interval range. Larger values are less precise, but more conservative. For example, the default value of 80% results in a lower bound of 10% and an upper bound of 90%. To change the predictions interval, click the Options link and DataRobot recalculates the display:
Note
You can also set the prediction interval when making predictions.
Prediction intervals are estimated based on the quantiles of the out-of-sample residuals and as a result may not be symmetrical. DataRobot calculates, independently, per series (if applicable) and per forecast distance, so intervals may increase with distance, and/or have a range specific to each series. If you predict on a new series, or a series in which there was no overlap with validation, DataRobot uses the average across all series.
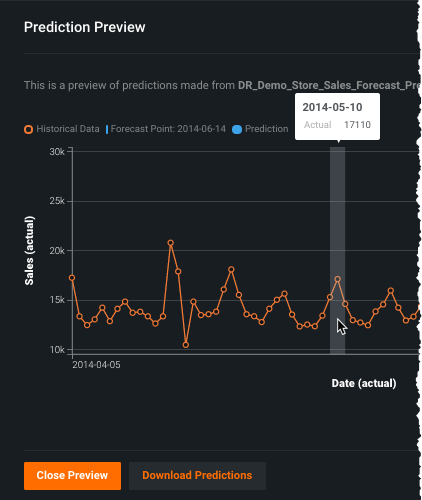
Hover over a point in the preview graph, left of the forecast point, to display the value from the historical data:
Or to the right of the forecast point to view the forecast (prediction):
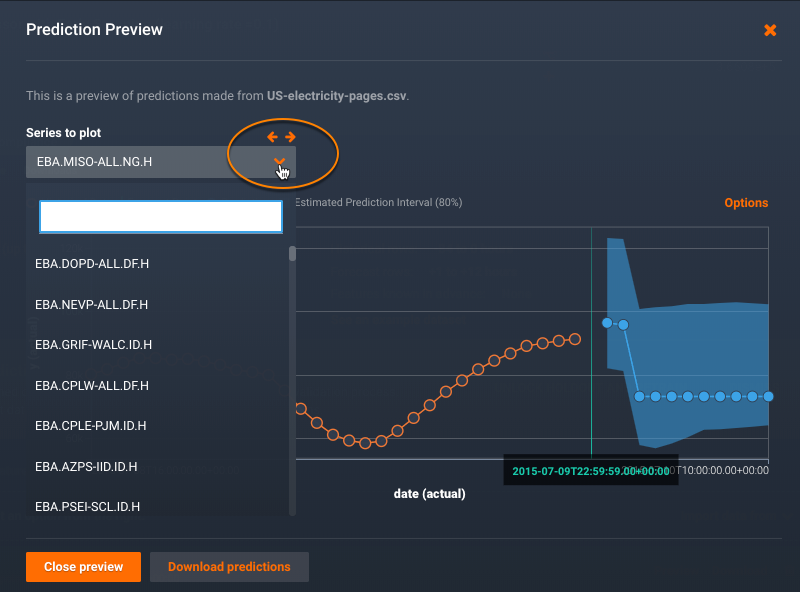
When used with multiseries modeling, you have an option to select which series to preview. This overview indicates how the target, feature, or accuracy changes over time for an individual series and provides a forecast for that series. From the dropdown, select a series. Or, page through the series options using the left and right arrows. By comparing the prediction intervals for each series, you can better identify the series with that provide the most accurate predictions.
Note that you can also download predictions from within the preview plot.


