Visual AI model insights
Visual AI provides several tools to help visually assess, understand, and evaluate model performance:
- Image embeddings allow you to view projections of images in two dimensions to see visual similarity between a subset of images and help identify outliers.
- Activation maps highlight regions of an image according to its importance to a model's prediction.
- Image Prediction Explanations illustrate what drives predictions, providing a quantitative indicator of the effect variables have on the predictions.
- The Neural Network Visualizer provides a visual breakdown of each layer in the model's neural network.
Image Embeddings and Activation Maps are also available from the Insights tab, allowing you to more easily compare models, for example, if you have applied tuning.
Additionally, the standard DataRobot insights (Confusion Matrix (for multiclass classificaiton), Feature Impact, and Lift Chart, for example) are all available.
Image Embeddings
Select Understand > Image Embeddings to view up to 100 images from the validation set projected onto a two-dimensional plane (using a technique that preserves similarity among images). This visualization answers the questions: What does the featurizer consider to be similar? Does this match human intuition? Is the featurizer missing something obvious?
Tip
See the reference material for more information.
In addition to presenting the actual values for an image, DataRobot calculates the predicted values and allows you to:
- Filter by these values.
- Modify the prediction threshold and filter.
The border color on an image indicates its prediction probability. All images with a probability higher than the prediction threshold have colored borders. Images with a predicted probability below the threshold don't have any border and can also be filtered out to disappear from the canvas entirely. In clustering projects, the colored border visually indicates members of a cluster.
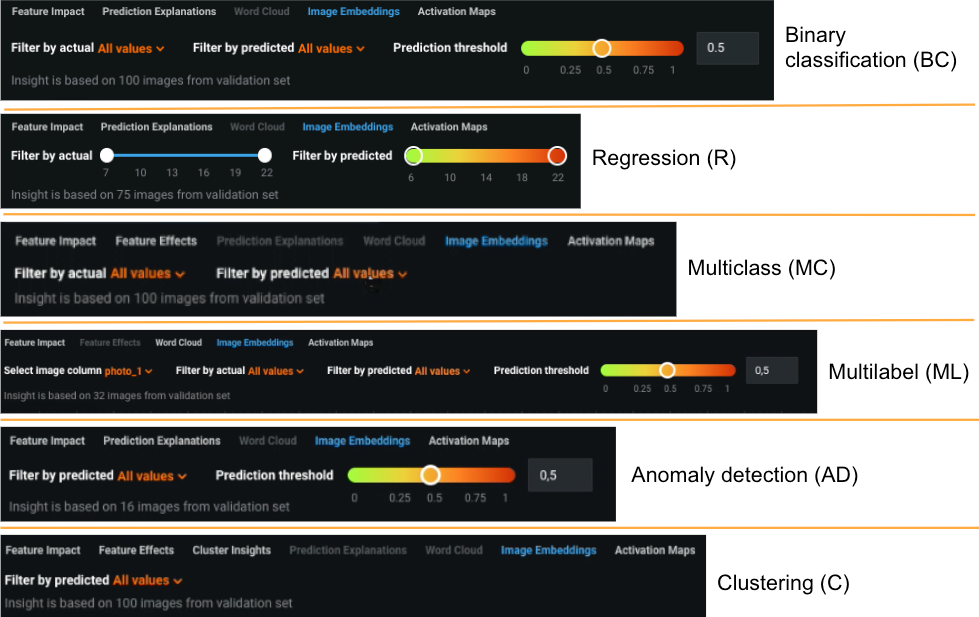
Filters allow you to narrow the display based on predicted and actual class values. Use filters to limit the display by specific classes, actual values, predicted values, and values that fall within a prediction threshold. Image Embeddings filter options differs depending on the project type. The options are illustrated below with a project type code, and are described in the table following:
| Element | Description | Project type |
|---|---|---|
| Filter by actual (dropdown) | Displays images whose actual values belong to the selected class. All classes display by default. | BC, MC, ML |
| Filter by actual (slider) | Displays images whose actual values fall within a custom range. | R |
| Filter by predicted (dropdown) | Displays images whose predicted values belong to the selected class. Modifying the prediction threshold (not applicable to multiclass) changes the output. | BC, MC, ML, AD, C |
| Filter by predicted (slider) | Displays images whose predicted value falls within the selected range. | R |
| Prediction threshold | Helps visualize how predictions would change if you adjust the probability threshold. As the threshold moves, the predicted outcome changes and the canvas (border colors) update. In other words, changing the threshold may change predicted label for an image. For anomaly detection projects, use the threshold to see what becomes an anomaly as the threshold changes. | BC, ML, AD |
| Select image column | If the dataset has multiple image columns, displays embeddings only for those images matching the column. | ML |
Working with the canvas
The Image Embeddings canvas displays projections of images in two dimensions to help you visualize similarities between groups of images and to identify outliers. You can use controls to get a more granular view of the images. The following controls are available:
-
Use zoom controls to get access to all images:
Enlarge, reduce, or reset the space between images on the canvas so that you can more easily see details between the images or get access to an image otherwise hidden behind another image. This action can also be achieved with your mouse (CMD + scroll for Macs and SHIFT + scroll for Windows).
-
To move areas of the display into focus, click and drag.
-
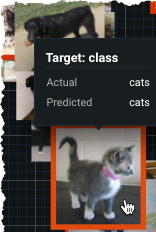
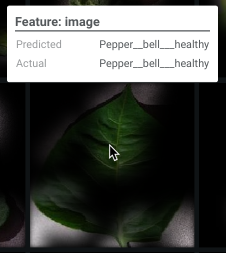
Hover on an image to see the actual and predicted class information. Use these tooltips to compare images to see whether DataRobot is grouping images as you would expect:
-
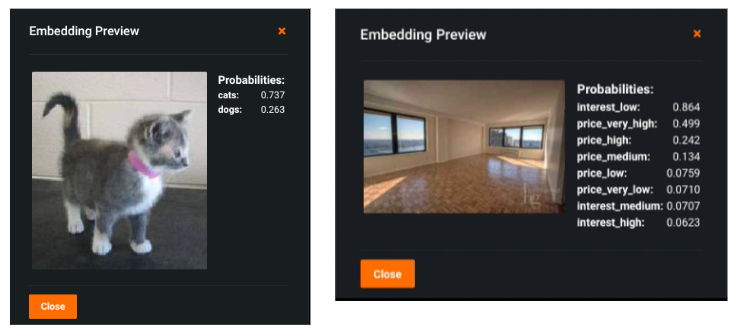
Click an image to see prediction probabilities for that image. The output is dependent on the project type. For example, compare a binary classification to a multilabel project:
The predicted values displayed in the preview are updated with any changes you make to the prediction threshold.
Activation Maps
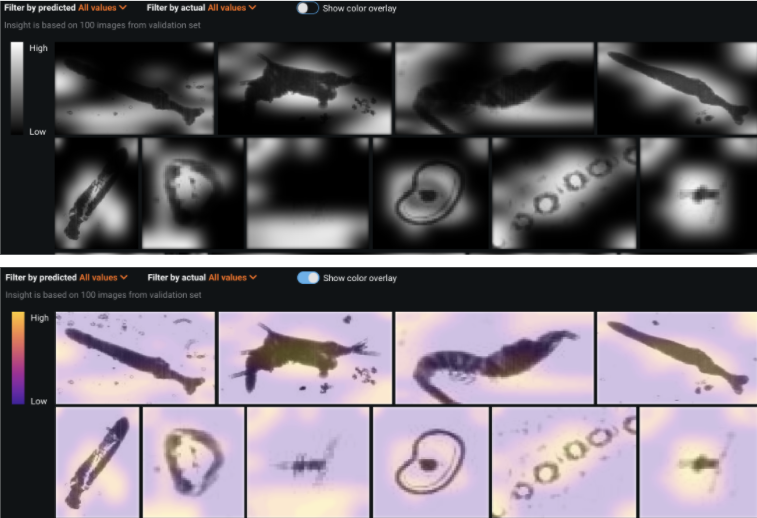
With Activation Maps, you can see which image areas the model is using when making predictions—which parts of the images are driving the algorithm prediction decision.
An activation map can indicate whether your model is looking at the foreground or background of an image or whether it is focusing on the right areas. For example, is it looking only at “healthy” areas of a plant when there is disease and because it does not use the whole leaf, classifying it as "no disease"? Is there a problem with overfitting or target leakage? These maps help to determine whether the model would be more effective if it were tuned.
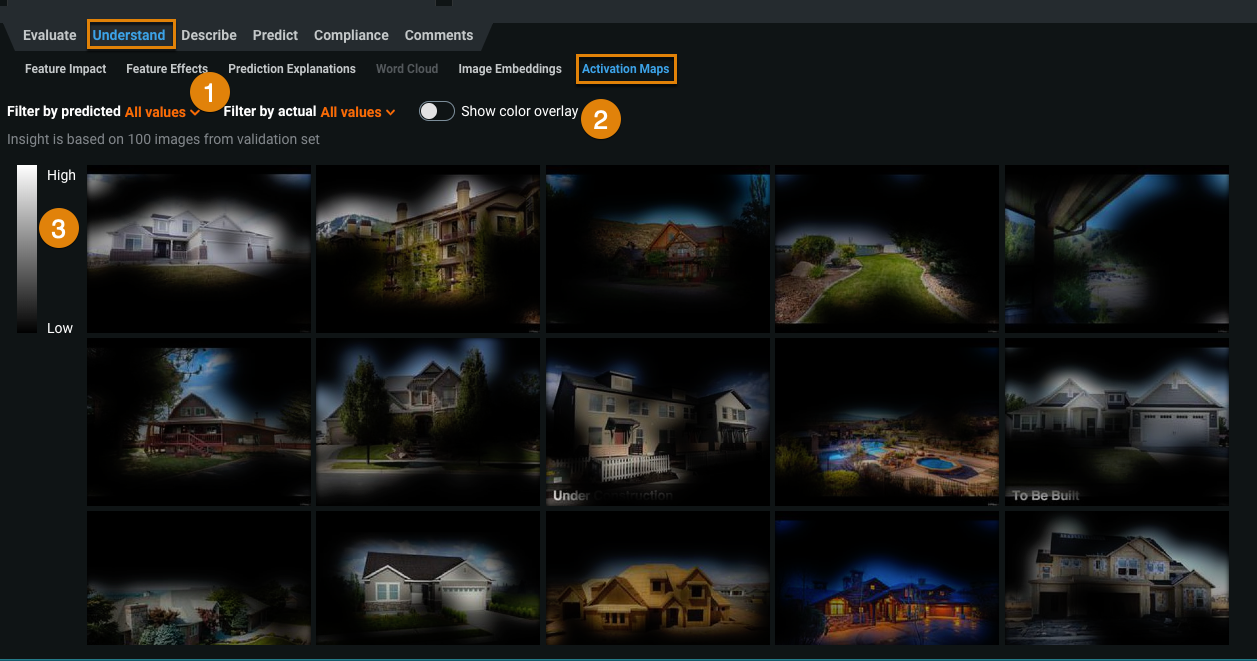
To use the maps, select Understand > Activation Maps for a model. DataRobot previews up to 100 sample images from the project's validation set.
| Element | Description | |
|---|---|---|
| 1 | Filter by predicted or actual | Narrows the display based on the predicted and actual class values. See Filters for details. |
| 2 | Show color overlay | Sets whether to display the attention map in either black and white or full color. See Color overlay for details. |
| 3 | Attention scale | Shows the extent to which a region is influencing the prediction. See Attention scale for details. |
See the reference material for detailed information about Visual AI.
Filters
Filters allow you to narrow the display based on the predicted and the actual class values. The initial display shows the full sample (i.e., both filters are set to all). You can instead set the display to filter by specific classes, limiting the display. Some examples:
| "Predicted" filter | "Actual" filter | Display results |
|---|---|---|
| All | All | All (up to 100) samples from the validation set |
| Tomato Leaf Mold | All | All samples in which the predicted class was Tomato Leaf Mold |
| Tomato Leaf Mold | Tomato Leaf Mold | All samples in which both the predicted and actual class were Tomato Leaf Mold |
| Tomato Leaf Mold | Potato Blight | Any sample in which DataRobot predicted Tomato Leaf Mold but the actual class was potato blight |
Hover over an image to see the reported predicted and actual classes for the image:
Color overlay
DataRobot provides two different views of the attention maps—black and white (which shows some transparency of original image colors) and full color. Select the option that provides the clearest contrast. For example, for black and white datasets, the alternative color overlay may make areas more obvious (instead of using a black-to-transparent scale). Toggle Show color overlay to compare.
Attention scale
The high-to-low attention scale indicates how much of a region in an image is influencing the prediction. Areas that are higher on the scale have a higher predictive influence—the model used something that was there (or not there, but should have been) to make the prediction. Some examples might include the presence or absence of yellow discoloration on a leaf, a shadow under a leaf, or an edge of a leaf that curls in a certain way.
Another way to think of scale is that it reflects how much the model "is excited by" a particular region of the image. It’s a kind of prediction explanation—why did the model predict what it did? The map shows that the reason is because the algorithm saw x in this region, which activated the filters sensitive to visual information like x.
Neural Network Visualizer
The Describe > Neural Network Visualizer tab illustrates the order of, and connections between, layers for each layer in a model's neural network. It helps to understand if the network layers are connected in the expected order in that it describes the order of connections and the input and outputs for each layer in the network.
With the visualizer you can visualize the structure by:
- Clicking and dragging left and right to see all layers.
-
Clicking to expand or collapse a grouped layer, displaying/hiding all layers in the group.
-
Clicking Display all layers to load the blueprint with all layers expanded.
-
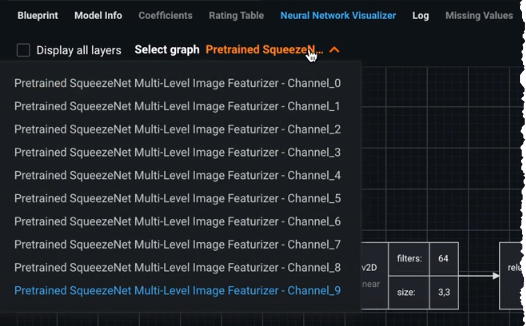
For blueprints that contain multiple neural networks, a Select graph dropdown becomes available, allowing you to display the associated visualization for that neural network.
