Data Drift tab
As training and production data change over time, a deployed model loses predictive power. The data surrounding the model is said to be drifting. By leveraging the training data and prediction data (also known as inference data) that is added to your deployment, the Data Drift dashboard helps you analyze a model's performance after it has been deployed.
How does DataRobot track drift?
DataRobot tracks two types of drift:
-
Target drift: DataRobot stores statistics about predictions to monitor how the distribution and values of the target change over time. As a baseline for comparing target distributions, DataRobot uses the distribution of predictions on the holdout.
-
Feature drift: DataRobot stores statistics about predictions to monitor how distributions and values of features change over time. The supported feature data types are numeric, categorical, and text. As a baseline for comparing distributions of features:
-
For training datasets larger than 500MB, DataRobot uses the distribution of a random sample of the training data.
-
For training datasets smaller than 500MB, DataRobot uses the distribution of 100% of the training data.
-
How many features can DataRobot track?
The following limits apply to tracking and receiving features in DataRobot:
-
Managed AI Platform (SaaS): By default, DataRobot tracks up to 25 features.
-
Self-Managed AI Platform (on-premise): By default, DataRobot tracks up to 25 features; however, self-managed installations can increase the limit to 200 features using the
PREDICTION_API_MONITOR_RAW_MAX_FEATUREsetting in the DataRobot configuration. In addition, the maximum number of features that DataRobot can receive is set usingPREDICTION_API_POST_MAX_FEATURESand the absolute maximum number of features DataRobot can receive is 300. For agent-monitored deployments, the 300 feature limit applies, even if you configure the agent to send more than 300 features usingMLOPS_MAX_FEATURES_TO_MONITOR.
Target and feature tracking are enabled by default. You can control these drift tracking features by navigating to a deployment's Data Drift > Settings tab.
Availability information
If feature drift tracking is turned off, a message displays on the Data Drift tab to remind you to enable feature drift tracking.
To receive email notifications on data drift status, configure notifications, schedule monitoring, and configure data drift monitoring settings.
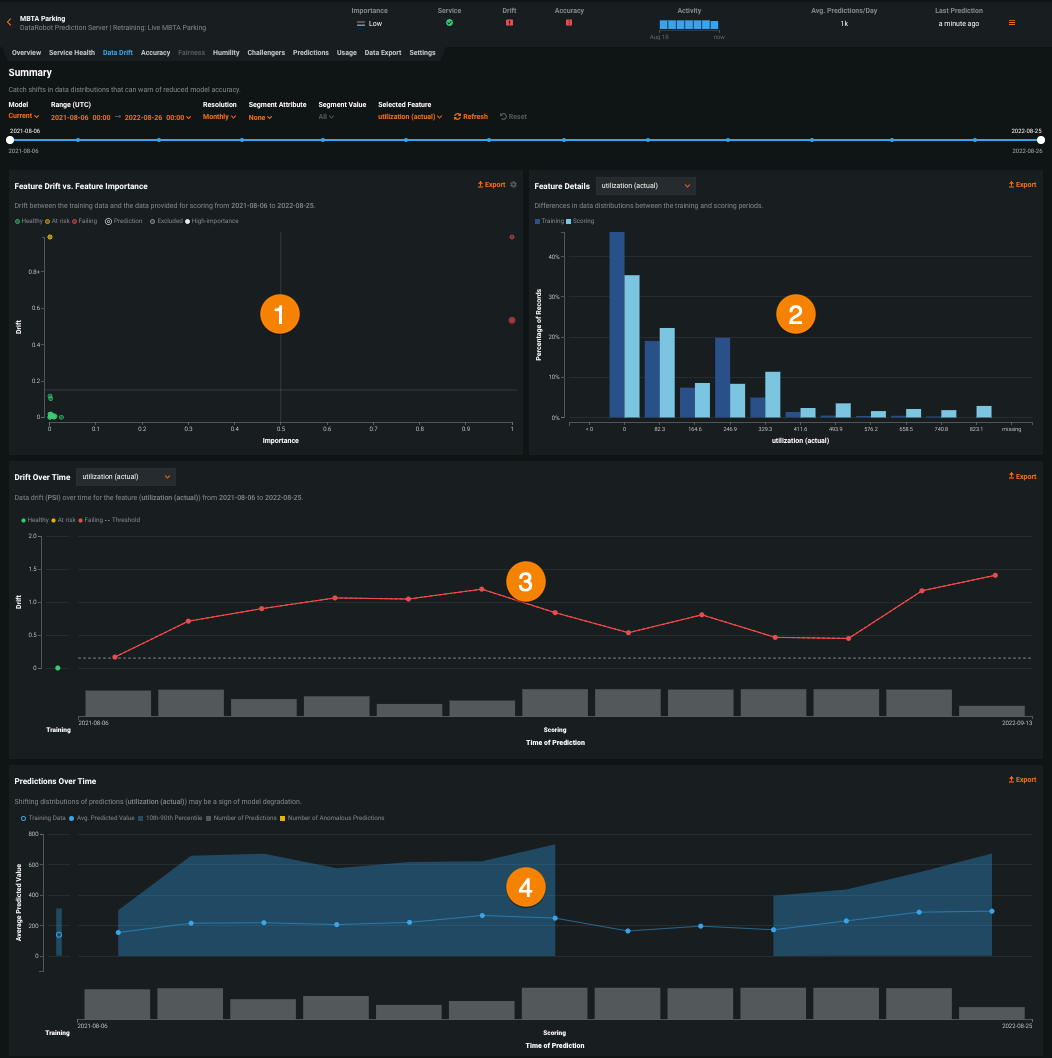
The Data Drift dashboard provides four interactive and exportable visualizations that help identify the health of a deployed model over a specified time interval.
Note
The Export button allows you to download each chart on the Data Drift dashboard as a PNG, CSV, or ZIP file.
| Chart | Description | |
|---|---|---|
| 1 | Feature Drift vs. Feature Importance | Plots the importance of a feature in a model against how much the distribution of feature values has changed, or drifted, between one point in time and another. |
| 2 | Feature Details | Plots percentage of records, i.e., the distribution, of the selected feature in the training data compared to the inference data. |
| 3 | Drift Over Time | Illustrates the difference in distribution over time between the training dataset of the deployed model and the datasets used to generate predictions in production. This chart tracks the change in the Population Stability Index (PSI), which is a measure of data drift. |
| 4 | Predictions Over Time | Illustrates how the distribution of a model's predictions has changed over time (target drift). The display differs depending on whether the project is regression or binary classification. |
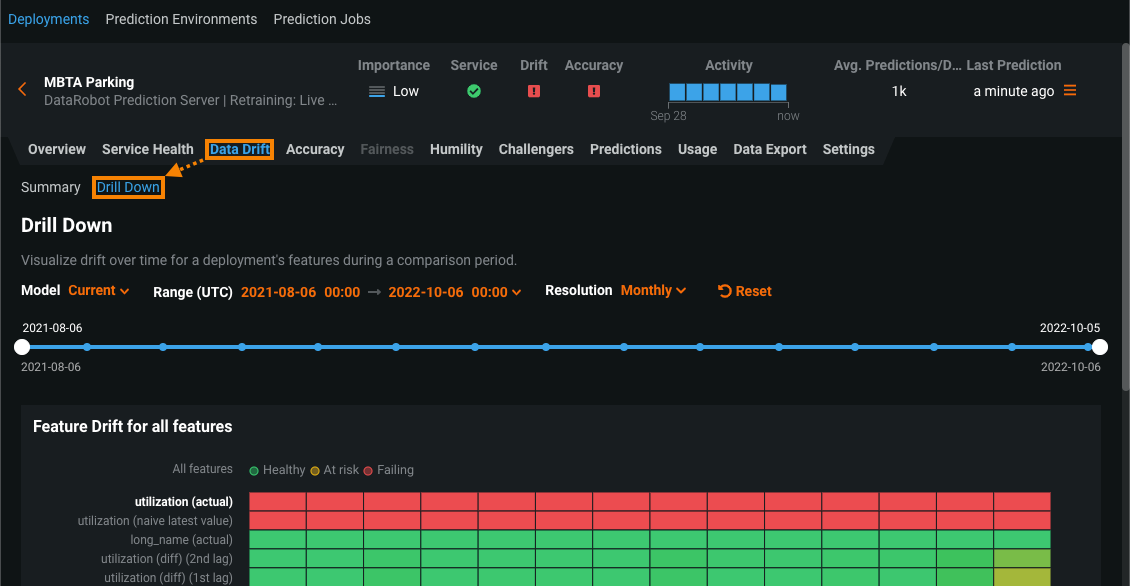
In addition to the visualizations above, you can use the Data Drift > Drill Down tab to compare data drift heat maps across the features in a deployment to identify drift trends.
Configure the Data Drift dashboard
You can customize how a deployment calculates data drift status by configuring drift and importance thresholds and additional definitions on the Data Drift > Settings page. You can also use the following controls to configure the Data Drift dashboard as needed:
| Control | Description | |
|---|---|---|
| 1 | Model version selector | Updates the dashboard displays to reflect the model you selected from the dropdown. |
| 2 | Date Slider | Limits the range of data displayed on the dashboard (i.e., zooms in on a specific time period). |
| 3 | Range (UTC) | Sets the date range displayed for the deployment date slider. |
| 4 | Resolution | Sets the time granularity of the deployment date slider. |
| 5 | Selected Feature | Sets the feature displayed on the Feature Details chart and the Drift Over Time chart. |
| 6 | Refresh | Initiates an on-demand update of the dashboard with new data. Otherwise, DataRobot refreshes the dashboard every 15 minutes. |
| 7 | Reset | Reverts the dashboard controls to the default settings. |
The Data Drift dashboard also supports segmented analysis, allowing you to view data drift while comparing a subset of training data to the predictions data for individual attributes and values using the Segment Attribute and Segment Value dropdowns.
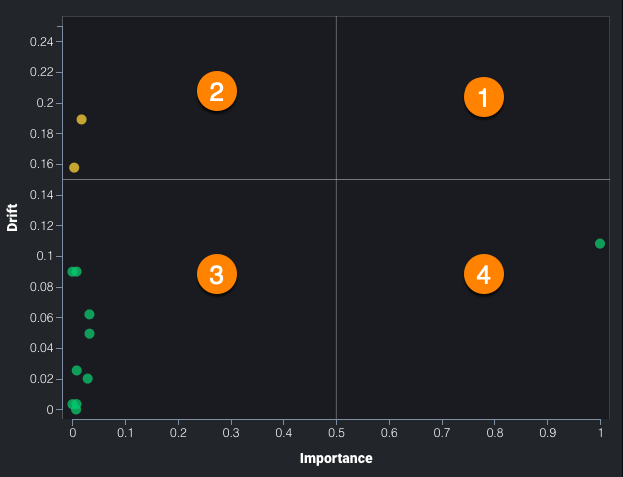
Feature Drift vs Feature Importance chart
The Feature Drift vs. Feature Importance chart monitors the 25 most impactful numerical, categorical, and text-based features in your data.
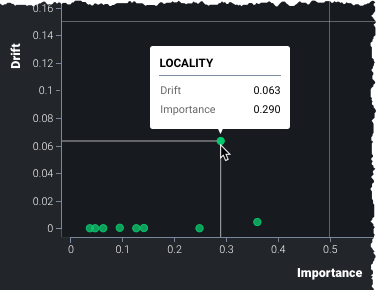
Use the chart to see if data is different at one point in time compared to another. Differences may indicate problems with your model or in the data itself. For example, if users of an auto insurance product are getting younger over time, the data that built the original model may no longer result in accurate predictions for your newer data. Particularly, drift in features with high importance can be a warning flag about your model accuracy. Hover over a point in the chart to identify the feature name and report the precise values for drift (Y-axis) and importance (X-axis).
Feature Drift
The Y-axis reports the Drift value for a feature. This value is a calculation of the Population Stability Index (PSI), a measure of the difference in distribution over time.
Drift metric support
While the DataRobot UI only supports the Population Stability Index (PSI) metric, the DataRobot API supports Kullback-Leibler Divergence, Hellinger Distance, Histogram Intersection, and Jensen–Shannon Divergence. In addition, using the Python API client, you can retrieve a list of supported metrics.
Feature Importance
The X-axis reports the Importance score for a feature, calculated when ingesting the learning (or training) data. DataRobot calculates feature importance differently depending on the model type. For DataRobot models and custom models, the Importance score is calculated using Permutation Importance. For external models, the importance score is an ACE Score. The dot resting at the Importance value of 1 is the target prediction ![]() . The most important feature in the model will also appear at 1 (as a solid green dot).
. The most important feature in the model will also appear at 1 (as a solid green dot).
Interpret the quadrants
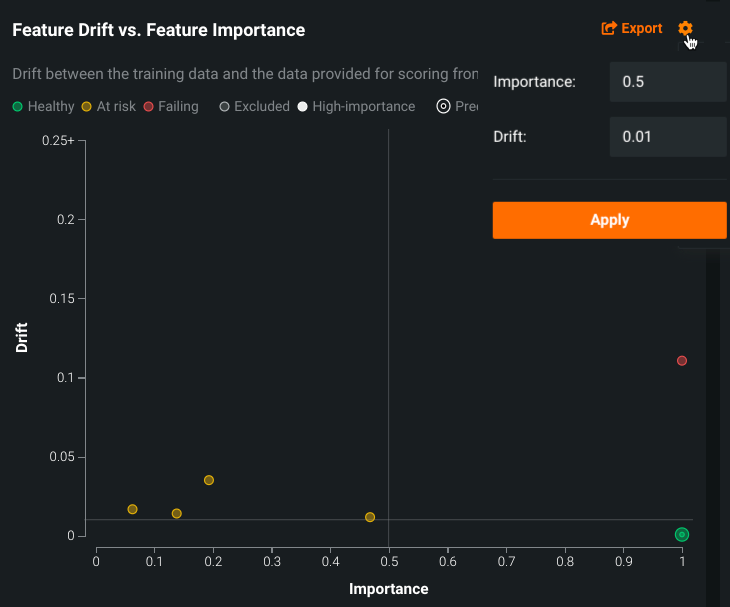
The quadrants represented in the chart help to visualize feature-by-feature data drift plotted against the feature's importance. Quadrants can be loosely interpreted as follows:
| Quadrant | Read as... | Color indicator |
|---|---|---|
| 1 | High importance feature(s) are experiencing high drift. Investigate immediately. | Red |
| 2 | Lower importance feature(s) are experiencing drift above the set threshold. Monitor closely. | Yellow |
| 3 | Lower importance feature(s) are experiencing minimal drift. No action needed. | Green |
| 4 | High importance feature(s) are experiencing minimal drift. No action needed, but monitor features that approach the threshold. | Green |
Note that points on the chart can also be gray or white. Gray circles represent features that have been excluded from drift status calculation, and white circles represent features set to high importance.
If you are the project owner, you can click the gear icon in the upper right chart corner to reset the quadrants. By default, the drift threshold defaults to .15. The Y-axis scales from 0 to the higher of 0.25 and the highest observed drift value. These quadrants can be customized by changing the drift and importance thresholds.
Feature Details chart
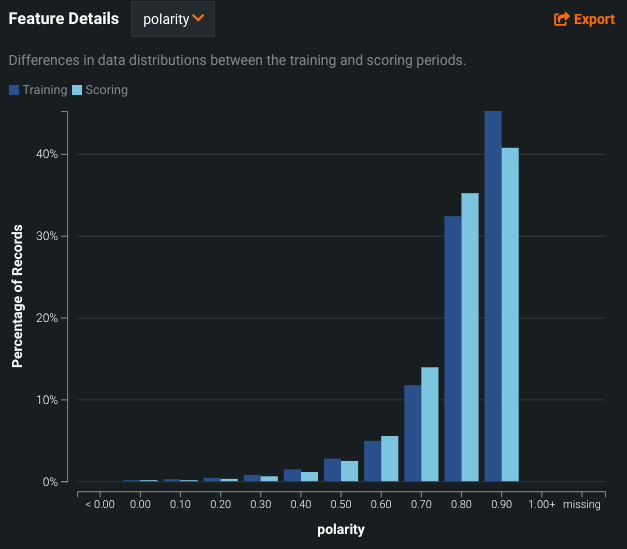
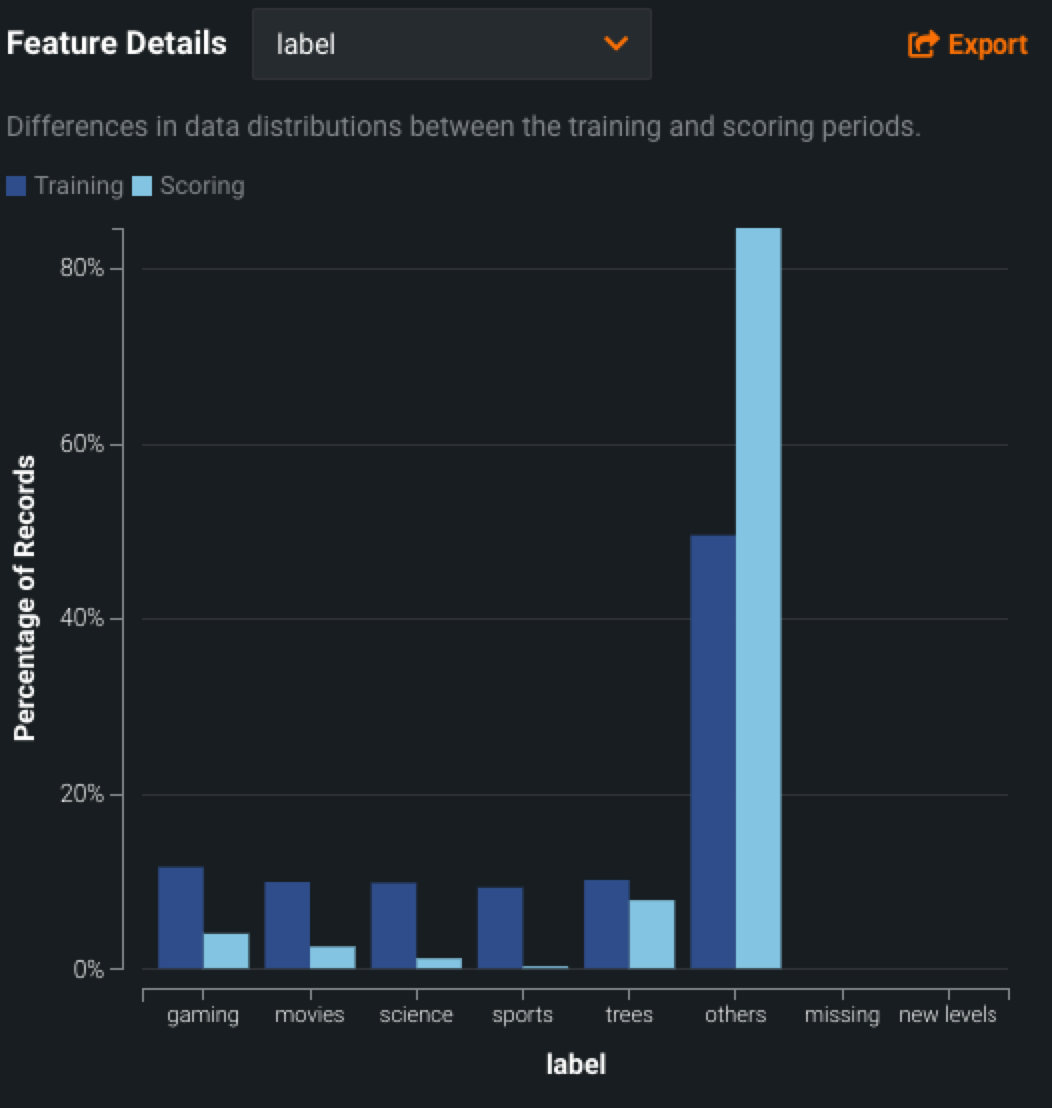
The Feature Details chart provides a histogram that compares the distribution of a selected feature in the training data to the distribution of that feature in the inference data.
Numeric features
For numeric data, DataRobot computes an efficient and precise approximation of the distribution of each feature. Based on this, drift tracking is conducted by comparing the normalized histogram for the training data to the scoring data using the selected drift metrics.
The chart displays 13 bins for numeric features:
-
10 bins capture the range of items observed in the training data.
-
Two bins capture very high and very low values—extreme values in the scoring data that fall outside the range of the training data. For example, to define the high and low value bins, the values are compared against the training data ranges,
min_trainingandmax_training. The low value bin contains values below themin_trainingrange and the high value bin contains values above themax_trainingrange. -
One bin for the missing count, containing all records with missing feature values.
How are values added to the histogram bins?
The Data drift tab uses Ben-Haim/Tom-Tov Centroid Histograms.
Categorical features
Unlike numeric data, where binning cutoffs for a histogram result from a data-dependent calculation, categorical data is inherently discrete in form (that is, not continuous), so binning is based on a defined category. Additionally, there could be missing or unseen category levels in the scoring data.
The process for drift tracking of categorical features is to calculate the fraction of rows for each categorical level ("bin") in the training data. This results in a vector of percentages for each level. The 25 most frequent levels are directly tracked—all other levels are aggregated to an Other bin. This process is repeated for the scoring data, and the two vectors are compared using the selected drift metric.
For categorical features, the chart includes two unique bins:
-
The Other bin contains all categorical features outside the 25 most frequent values. This aggregation is performed for drift tracking purposes; it doesn't represent the model's behavior.
-
The New level bin only displays after you make predictions with data that has a new value for a feature not in the training data. For example, consider a dataset about housing prices with the categorical feature
City. If your inference data contains the valueBostonand your training data did not, theBostonvalue (and other unseen cities) are represented in the New level bin.
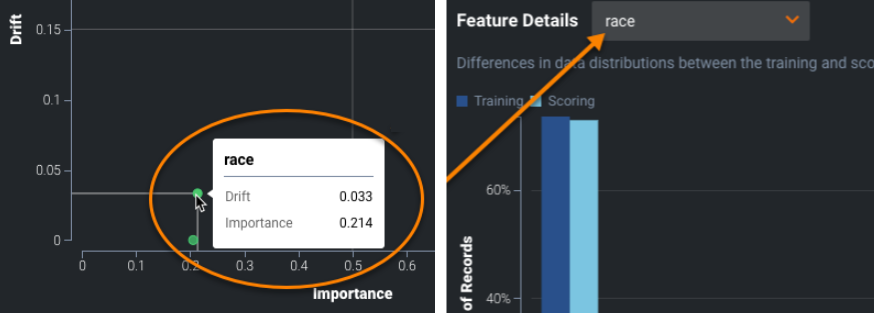
To use the chart, select a feature from the dropdown. The list, which defaults to the target feature, includes any of the features tracked. Click a point in the Feature Drift vs. Feature Importance chart:
Text features
Text features are a high-cardinality problem, meaning the addition of new words does not have the impact of, for example, new levels found in categorical data. The method DataRobot uses to track drift of text features accounts for the fact that writing is subjective and cultural and may have spelling mistakes. In other words, to identify drift in text fields, it is more important to identify a shift in the whole language rather than in individual words.
Drift tracking for a text feature is conducted by:
- Detecting occurrences of the 1000 most frequent words from rows found in the training data.
- Calculating the fraction of rows that contain these terms for that feature in the training data and separately in the scoring data.
- Comparing the fraction in the scoring data to that in the training data.
The two vectors of occurrence fractions (one entry per word) are compared with the available drift metrics. Prior to applying this methodology, DataRobot performs basic tokenization by splitting the text feature into words (or characters in the case of Japanese or Chinese).
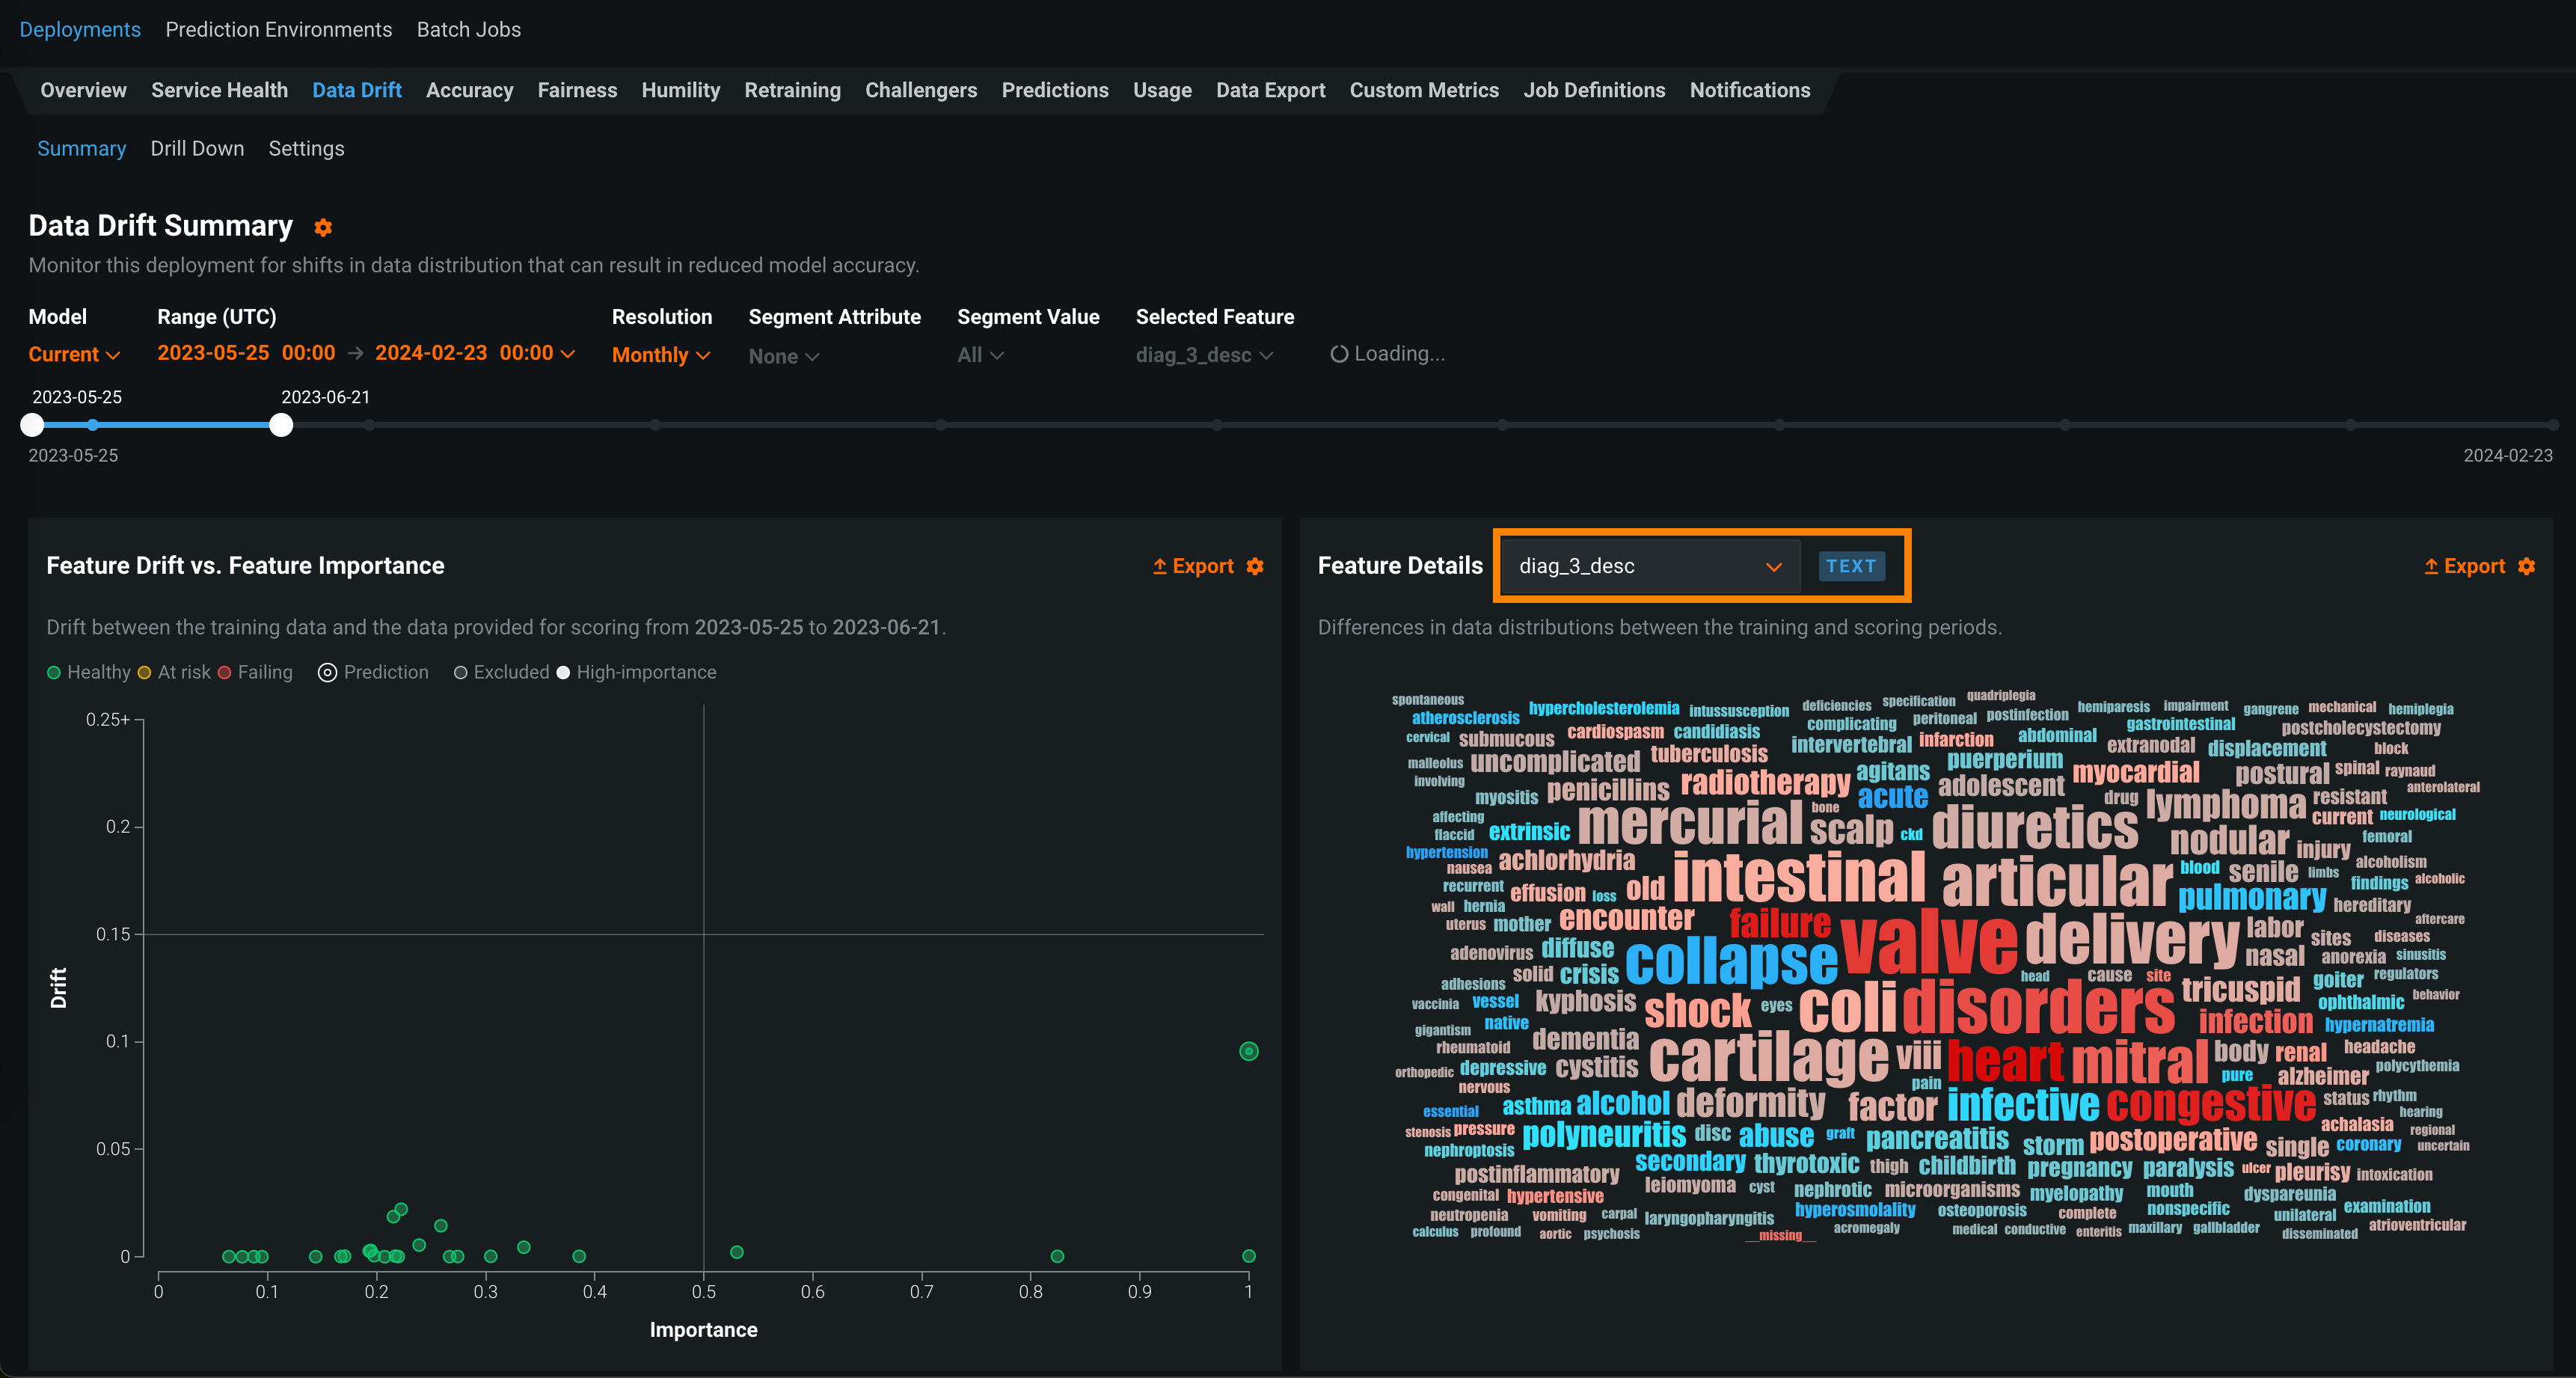
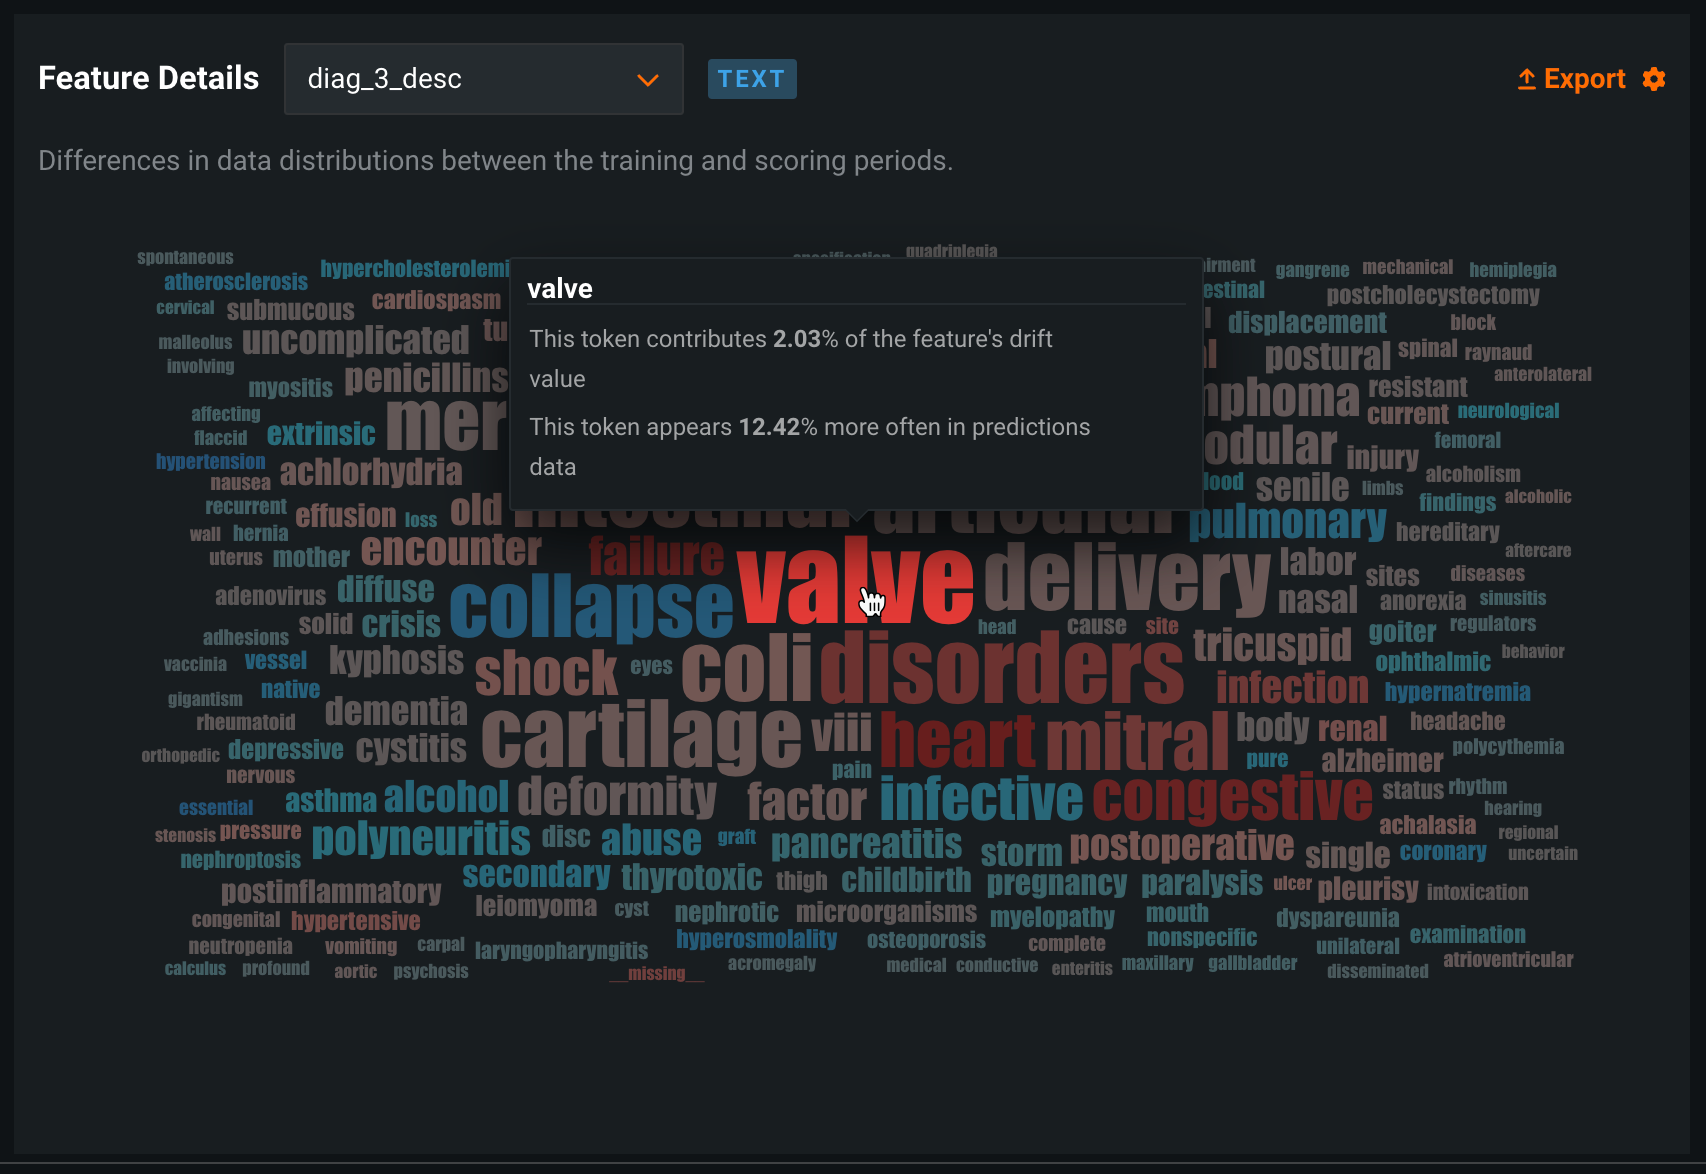
For text features, the Feature Details chart replaces the feature drift bar chart with a word cloud visualizing data distributions for each token and revealing how much each individual token contributes to data drift in a feature.
To access the feature drift word cloud for a text feature:
-
Open the Data Drift tab of a drift-enabled deployment.
-
On the Summary tab, in the Feature Details chart, select a text feature from dropdown list.
Note
You can also select a text feature from the Selected Feature dropdown list in the Data Drift dashboard controls.
-
Use the dashboard controls to configure the Data Drift dashboard.
-
To interpret the feature drift word cloud for a text feature, you can hold the pointer over a token to view the following details:
Tip
When your pointer is over the word cloud, you can scroll up to zoom in and view the text of smaller tokens.
Chart element Description Token The tokenized text. Text size represents the token's drift contribution and text color represents the dataset prevalence. Stop words are hidden from this chart. Drift contribution How much this particular token contributes to the feature's drift value, as reported in the Feature Drift vs. Feature Importance and Drift Over Time charts. Data distribution How much more often this particular token appears in the training data or the predictions data. - Blue: This token appears
X% more often in training data. - Red: This token appears
X% more often in predictions data.
- Blue: This token appears
Note
Next to the Export button, you can click the settings icon (![]() ) and clear the Display text features as word cloud check box to disable the feature drift word cloud and view the standard chart:
) and clear the Display text features as word cloud check box to disable the feature drift word cloud and view the standard chart:
Drift Over Time chart
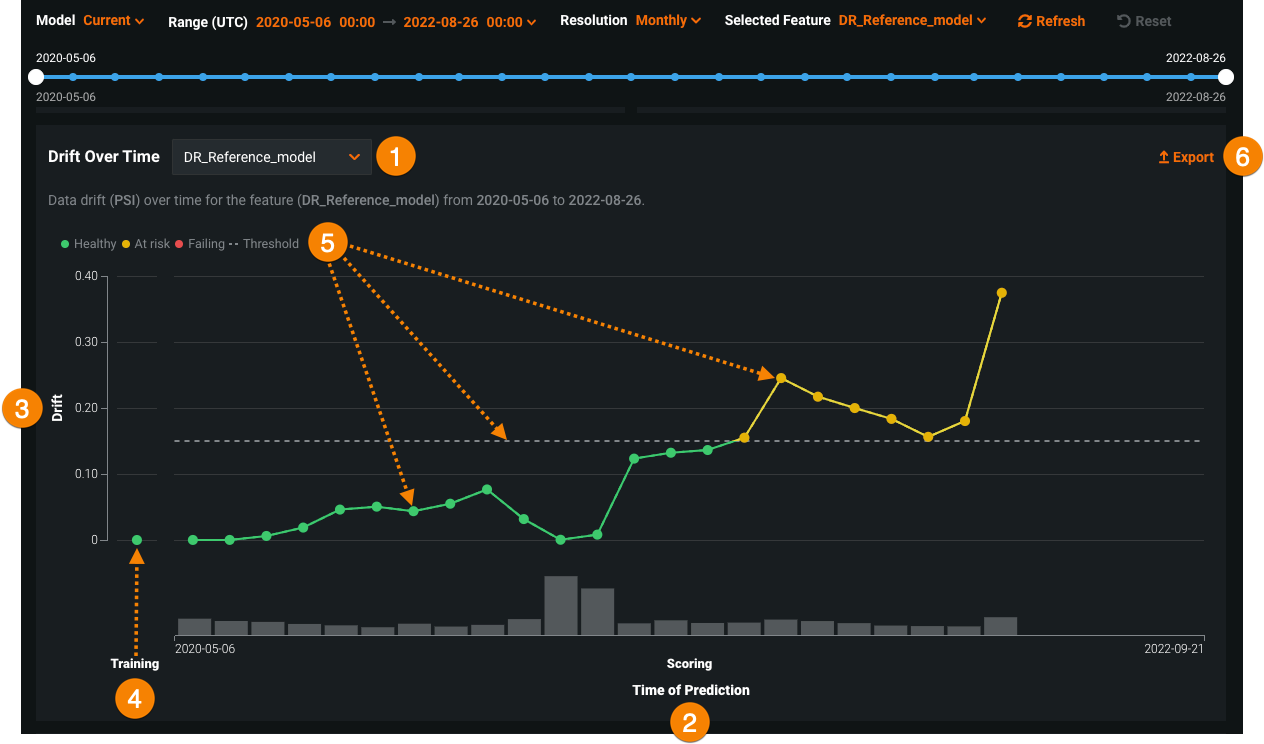
The Drift Over Time chart visualizes the difference in distribution over time between the training dataset of the deployed model and the datasets used to generate predictions in production. The drift away from the baseline established with the training dataset is measured using the Population Stability Index (PSI). As a model continues to make predictions on new data, the change in the PSI over time is visualized for each tracked feature, allowing you to identify data drift trends.
As data drift can decrease your model's predictive power, determining when a feature started drifting and monitoring how that drift changes (as your model continues to make predictions on new data) can help you estimate the severity of the issue. You can then compare data drift trends across the features in a deployment to identify correlated drift trends between specific features. In addition, the chart can help you identify seasonal effects (significant for time-aware models). This information can help you identify the cause of data drift in your deployed model, including data quality issues, changes in feature composition, or changes in the context of the target variable. The example below shows the PSI consistently increasing over time, indicating worsening data drift for the selected feature.
The Drift Over Time chart includes the following elements and controls:
| Chart element | Description | |
|---|---|---|
| 1 | Selected Feature | Selects a feature for drift over time analysis, which is then reported in the Drift Over Time chart and the Feature Details chart. |
| 2 | Time of Prediction / Sample size (X-axis) |
Represents the time range of the predictions used to calculate the corresponding drift value (PSI). Below the X-axis, a bar chart represents the number of predictions made during the corresponding Time of Prediction. For more information on how time of prediction is represented in time series deployments, see the Time of prediction for time series deployments note. |
| 3 | Drift (Y-axis) |
Represents the range of drift values (PSI) calculated for the corresponding Time of Prediction. |
| 4 | Training baseline | Represents the 0 PSI value of the training baseline dataset. |
| 5 | Drift status information | Displays the drift status and threshold information for the selected feature. Drift status visualizations are based on the monitoring settings configured by the deployment owner. The deployment owner can also set the drift and importance thresholds in the Feature Drift vs Feature Importance chart settings. The possible drift status classifications are:
|
| 6 | Export | Exports the Drift Over Time chart. |
Time of prediction for time series deployments
The default prediction timestamp method for time series deployments is forecast date (i.e., forecast point + forecast distance), not the time of the prediction request. Forecast date allows a common time axis to be used between the training data and the basis of data drift and accuracy statistics. For example, using forecast date, if the prediction data has dates from June 1 to June 10, the forecast point is set to June 10, and the forecast distance is set to +1 - + 7 days, predictions are available and data drift is tracked for June 11 - 17.
You can select from the following prediction timestamp options when deploying a model:
- Use value from date/time feature: Default. Use the date/time provided as a feature with the prediction data (e.g., forecast date) to determine the timestamp.
- Use time of prediction request: Use the time you submitted the prediction request to determine the timestamp.
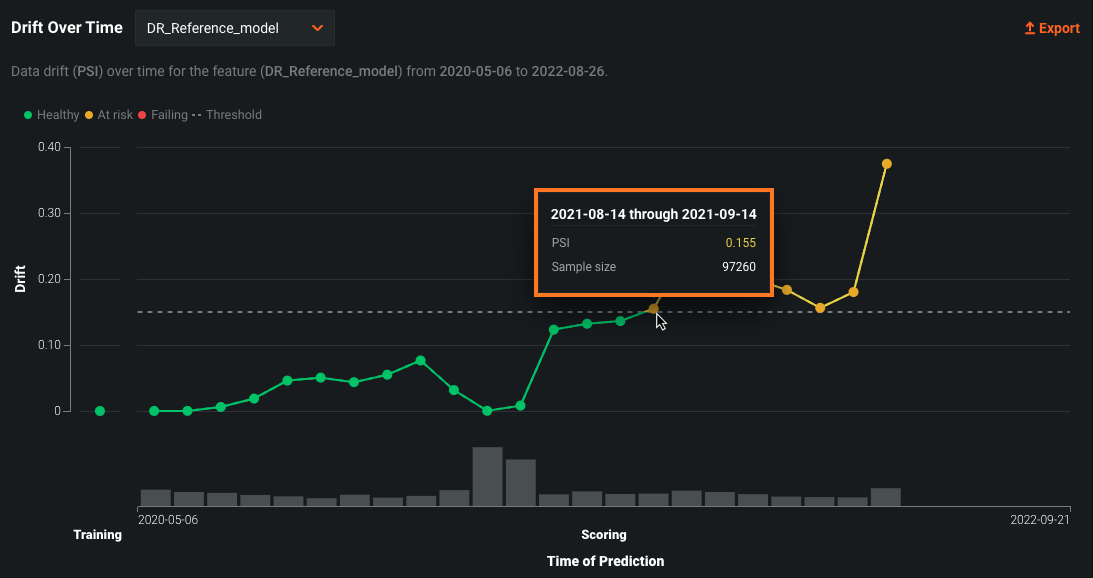
To view additional information on the Drift Over Time chart, hover over a marker in the chart to see the Time of Prediction, PSI, and Sample size:
Tip
The X-axis of the Drift Over Time chart aligns with the X-axis of the Predictions Over Time chart below to make comparing the two charts easier. In addition, the Sample size data on the Drift Over Time chart is equivalent to the Number of Predictions data from the Predictions Over Time chart.
Predictions Over Time chart
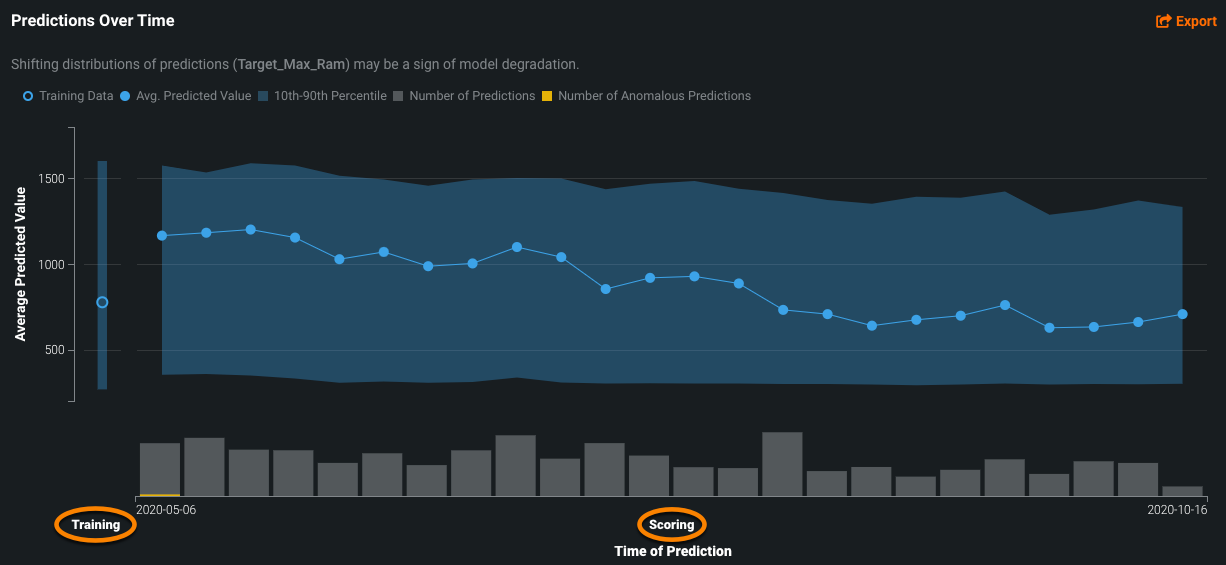
The Predictions Over Time chart provides an at-a-glance determination of how the model's predictions have changed over time. For example:
Dave sees that his model is predicting
1(readmitted) noticeably more frequently over the past month. Because he doesn't know of a corresponding change in the actual distribution of readmissions, he suspects that the model has become less accurate. With this information, he investigates further whether he should consider retraining.
Although the charts for binary classification and regression differ slightly, the takeaway is the same—are the plot lines relatively stable across time? If not, is there a business reason for the anomaly (for example, a blizzard)? One way to check this is to look at the bar chart below the plot. If the point for a binned period is abnormally high or low, check the histogram below to ensure there are enough predictions for this to be a reliable data point.
Time of Prediction
The Time of Prediction value differs between the Data drift and Accuracy tabs and the Service health tab:
-
On the Service health tab, the "time of prediction request" is always the time the prediction server received the prediction request. This method of prediction request tracking accurately represents the prediction service's health for diagnostic purposes.
-
On the Data drift and Accuracy tabs, the "time of prediction request" is, by default, the time you submitted the prediction request, which you can override with the prediction timestamp in the Prediction History and Service Health settings.
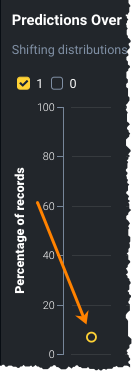
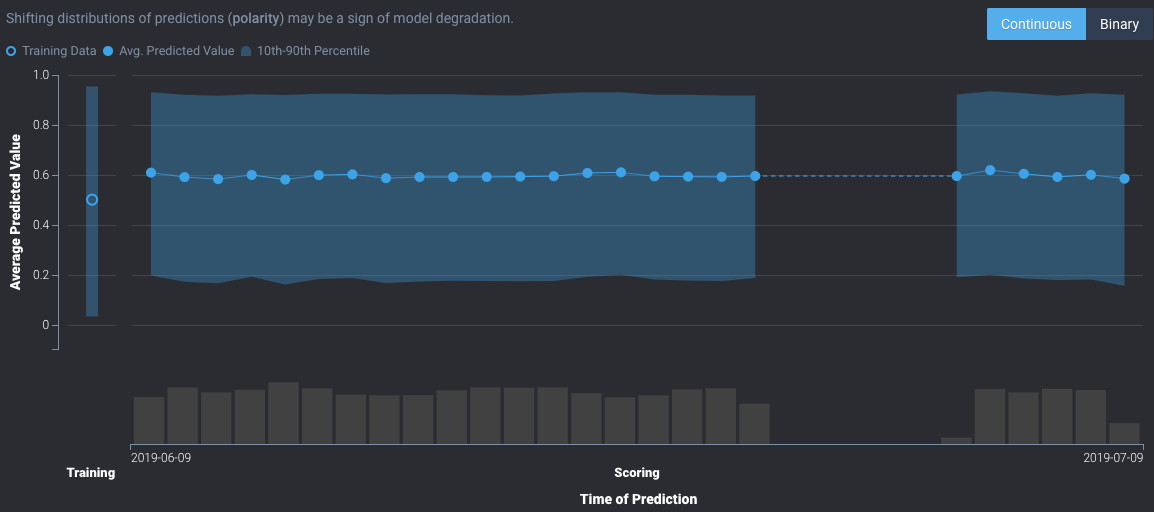
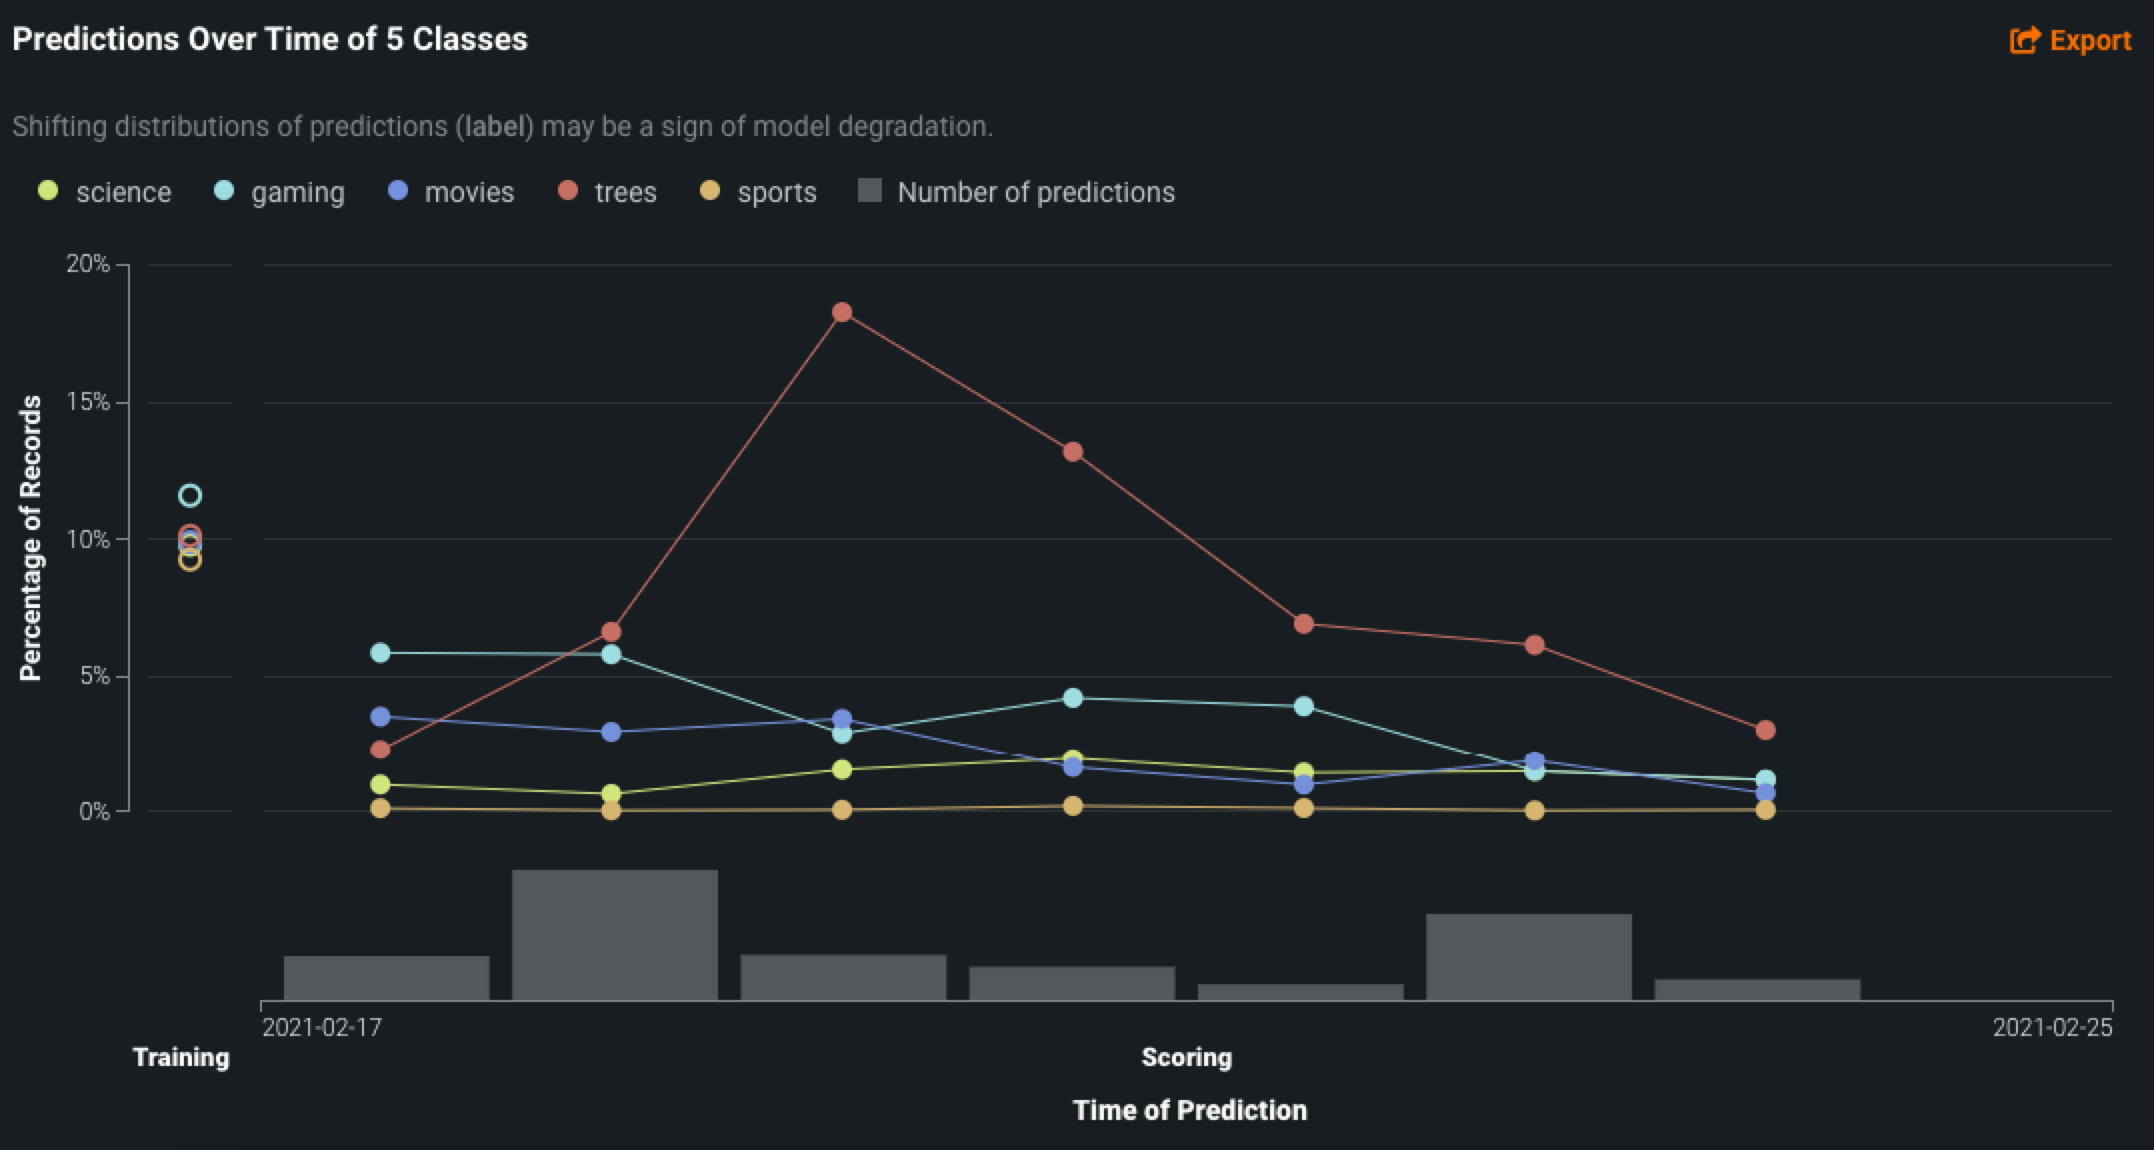
Additionally, both charts have Training and Scoring labels across the X-axis. The Training label indicates the section of the chart that shows the distribution of predictions made on the holdout set of training data for the model. It will always have one point on the chart. The Scoring label indicates the section of the chart showing the distribution of predictions made on the deployed model. Scoring indicates that the model is in use to make predictions. It will have multiple points along the chart to indicate how prediction distributions change over time.
For regression projects
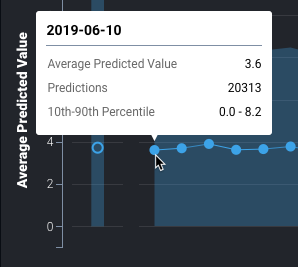
The Predictions Over Time chart for regression projects plots the average predicted value, as well as a visual indicator of the middle 80% range of predicted values for both training and prediction data. If training data is uploaded, the graph displays both the 10th-90th percentile and the mean value of the target (![]() ).
).
Hover over a point on the chart to view its details:
- Date: The starting date of the bin data. Displayed values are based on counts from this date to the next point along the graph. For example, if the date on point A is 01-07 and point B is 01-14, then point A covers everything from 01-07 to 01-13 (inclusive).
- Average Predicted Value: For all points included in the bin, this is the average of their values.
- Predictions: The number of predictions included in the bin. Compare this value against other points if you suspect anomalous data.
- 10th-90th Percentile: Percentile of predictions for that time period.
Note that you can also display this information for the mean value of the target by hovering on the point in the training data.
For binary classification projects
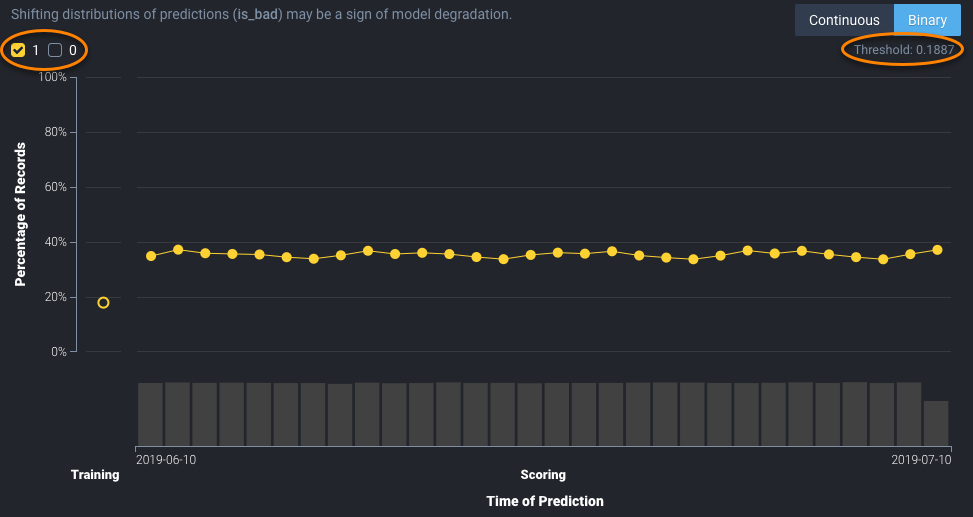
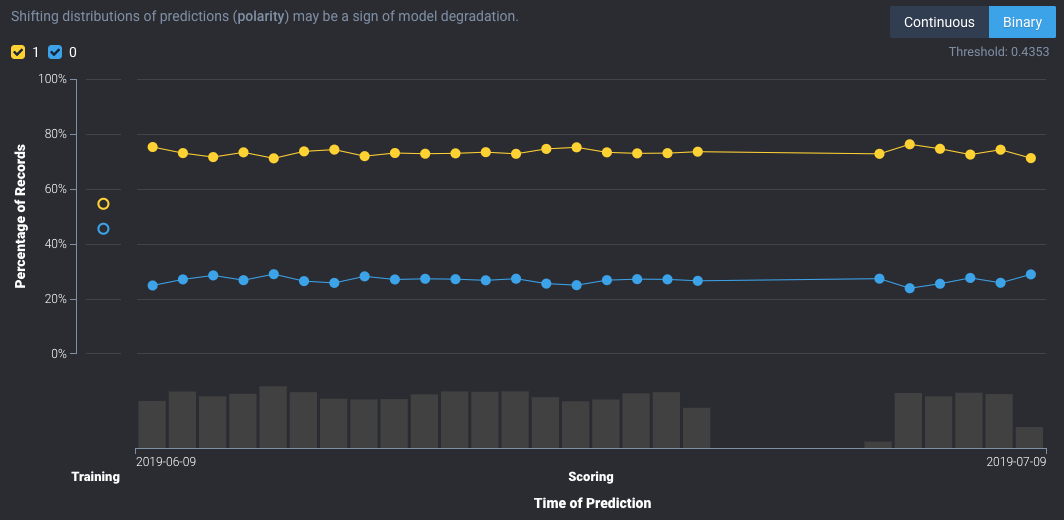
The Predictions Over Time chart for binary classification projects plots the class percentages based on the labels you set when you added the deployment (in this example, 0 and 1). It also reports the threshold set for prediction output. The threshold is set when adding your deployment to the inventory and cannot be revised.
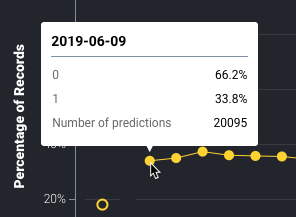
Hover over a point on the chart to view its details:
- Date: The starting date of the bin data. Displayed values are based on counts from this date to the next point along the graph. For example, if the date on point A is 01-07 and point B is 01-14, then point A covers everything from 01-07 to 01-13 (inclusive).
- <class-label>: For all points included in the bin, the percentage of those in the "positive" class (
0in this example). - <class-label>: For all points included in the bin, the percentage of those in the "negative" class (
1in this example). - Number of Predictions: The number of predictions included in the bin. Compare this value against other points if you suspect anomalous data.
Additionally, the chart displays the mean value of the target in the training data. As with all plotted points, you can hover over it to see the specific values.
The chart also includes a toggle in the upper-right corner that allows you to switch between continuous and binary modes (only for binary classification deployments):
Continuous mode shows the positive class predictions as probabilities between 0 and 1, without taking the prediction threshold into account:
Binary mode takes the prediction threshold into account and shows, of all predictions made, the percentage for each possible class:
Prediction warnings integration
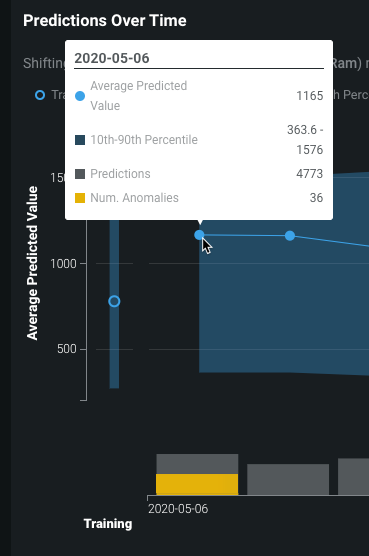
If you have enabled prediction warnings for a deployment, any anomalous prediction values that trigger a warning are flagged in the Predictions Over Time bar chart.
Prediction warnings availability
Prediction warnings are only available for deployments using regression models. This feature does not support classification or time series models.
The yellow section of the bar chart represents the anomalous predictions for a point in time.
To view the number of anomalous predictions for a specific time period, hover over the point on the plot corresponding to the flagged predictions in the bar chart.
Use the version selector
You can change the data drift display to analyze the current, or any previous, version of a model in the deployment. Initially, if there has been no model replacement, you only see the Current option. The models listed in the dropdown can also be found in the History section of the Overview tab. This functionality is only supported with deployments made with models or model images.
Use the time range and resolution dropdowns
The Range and Resolution dropdowns help diagnose deployment issues by allowing you to change the granularity of the three deployment monitoring tabs: Data Drift, Service Health, and Accuracy.
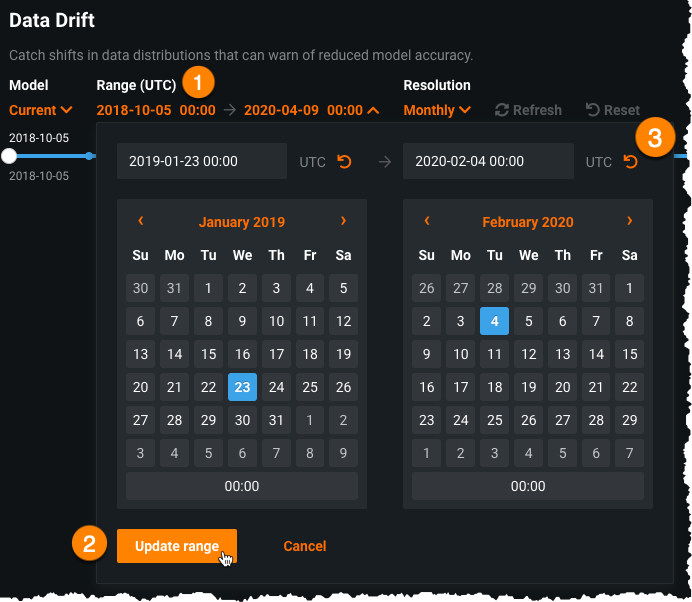
Expand the Range dropdown (1) to select the start and end dates for the time range you want to examine. You can specify the time of day for each date (to the nearest hour, rounded down) by editing the value after selecting a date. When you have determined the desired time range, click Update range (2). Select the Range reset icon (![]() ) (3) to restore the time range to the previous setting.
) (3) to restore the time range to the previous setting.
Note
The date picker only allows you to select dates and times between the start date of the deployment's current version of a model and the current date.
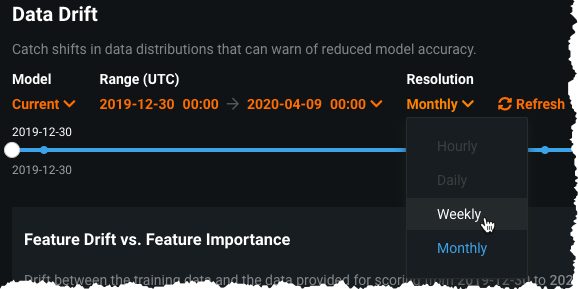
After setting the time range, use the Resolution dropdown to determine the granularity of the date slider. Select from hourly, daily, weekly, and monthly granularity based on the time range selected. The following Resolution settings are available, based on the selected range:
| Resolution | Selected range requirement |
|---|---|
| Hourly | Less than 7 days. |
| Daily | Between 1-60 days (inclusive). |
| Weekly | Between 1-52 weeks (inclusive). |
| Monthly | At least 1 month and less than 120 months. |
When you choose a new value from the Resolution dropdown, the resolution of the date selection slider changes. Then, you can select start and end points on the slider to hone in on the time range of interest.
Note that the selected slider range also carries across the Service Health and Accuracy tabs (but not across deployments).
Use the date slider
The date slider limits the time range used for comparing prediction data to training data. The upper dates displayed in the slider, left and right edges, indicate the range currently used for comparison in the page's visualizations. The lower dates, left and right edges, indicate the full date range of prediction data available. The circles mark the "data buckets," which are determined by the time range.
To use the slider, click a point to move the line or drag the endpoint left or right.
The visualizations use predictions from the starting point of the updated time range as the baseline reference point, comparing them to predictions occurring up to the last date of the selected time range.
You can also move the slider to a different time interval while maintaining the periodicity. Click anywhere on the slider between the two endpoints to drag it (you will see a hand icon on your cursor).
In the example above, you see the slider spans a 3-month time interval. You can drag the slider and maintain the time interval of 3 months for different dates.
By default, the slider is set to display the same date range that is used to calculate and display drift status. For example, if drift status captures the last week, then the default slider range will span from the last week to the current date.
You can move the slider to any date range without affecting the data drift status display on the health dashboard. If you do so, a Reset button appears above the slider. Clicking it will revert the slider to the default date range that matches the range of the drift status.
Use the class selector
Multiclass deployments offer class-based configuration to modify the data displayed on the Data Drift graphs.
Predictions over Time multiclass graph:
Feature Details multiclass graph:
Drill down on the Data Drift tab
The Data Drift > Drill Down chart visualizes the difference in distribution over time between the training dataset of the deployed model and the datasets used to generate predictions in production. The drift away from the baseline established with the training dataset is measured using the Population Stability Index (PSI). As a model continues to make predictions on new data, the change in the drift status over time is visualized as a heat map for each tracked feature, allowing you to identify data drift trends.
Because data drift can decrease your model's predictive power, determining when a feature started drifting and monitoring how that drift changes (as your model continues to make predictions on new data) can help you estimate the severity of the issue. Using the Drill Down tab, you can compare data drift heat maps across the features in a deployment to identify correlated drift trends. In addition, you can select one or more features from the heat map to view a Feature Drift Comparison chart, comparing the change in a feature's data distribution between a reference time period and a comparison time period to visualize drift. This information helps you identify the cause of data drift in your deployed model, including data quality issues, changes in feature composition, or changes in the context of the target variable.
To access the Drill Down tab:
-
Click Deployments, and then select a drift-enabled deployment from the Deployments inventory.
-
In the deployment, click Data Drift, and then click Drill Down:
-
On the Drill Down tab:
Configure the drill down display settings
The Drill Down tab includes the following display controls:
| Control | Description | |
|---|---|---|
| 1 | Model | Updates the heatmap to display the model you selected from the dropdown. |
| 2 | Date slider | Limits the range of data displayed on the dashboard (i.e., zooms in on a specific time period). |
| 3 | Range (UTC) | Sets the date range displayed for the deployment date slider. |
| 4 | Resolution | Sets the time granularity of the deployment date slider. |
| 5 | Reset | Reverts the dashboard controls to the default settings. |
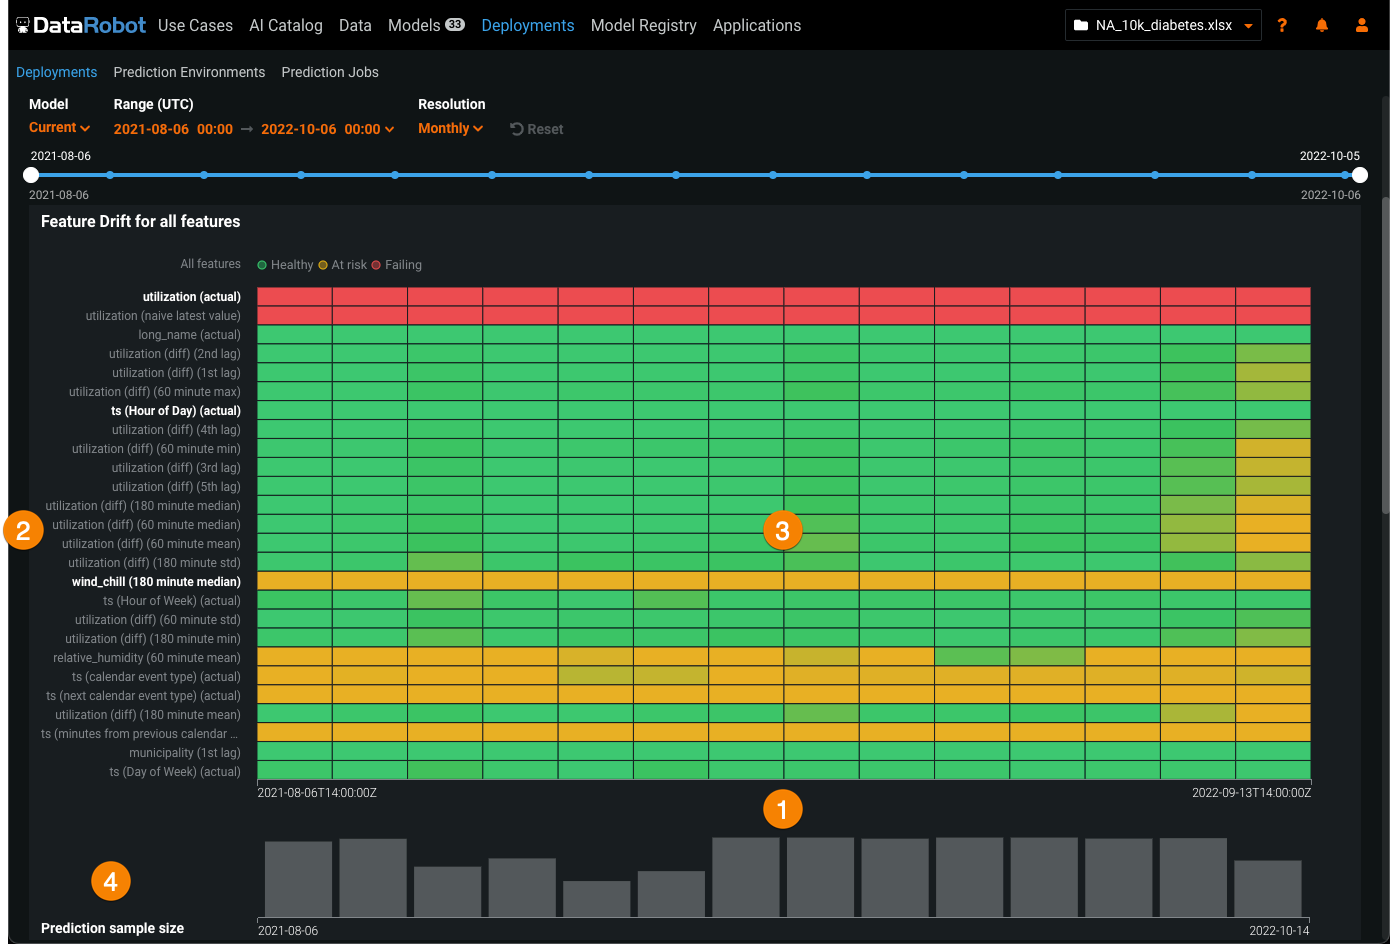
Use the feature drift heat map
The Feature Drift for all features heat map includes the following elements and controls:
| Element | Description | |
|---|---|---|
| 1 | Prediction time (X-axis) |
Represents the time range of the predictions used to calculate the corresponding drift value (PSI). Below the X-axis, the Prediction sample size bar chart represents the number of predictions made during the corresponding prediction time range. |
| 2 | Feature (Y-axis) |
Represents the features in a deployment's dataset. Click a feature name to generate the feature drift comparison below. |
| 3 | Status heat map | Displays the drift status over time for each of a deployment's features. Drift status visualizations are based on the monitoring settings configured by the deployment owner. The deployment owner can also set the drift and importance thresholds in the Feature Drift vs Feature Importance chart settings. The possible drift status classifications are:
|
| 4 | Prediction sample size | Displays the number of rows of prediction data used to calculate the data drift for the given time period. To view additional information on the prediction sample size, hover over a bin in the chart to see the time of prediction range and the sample size value. |
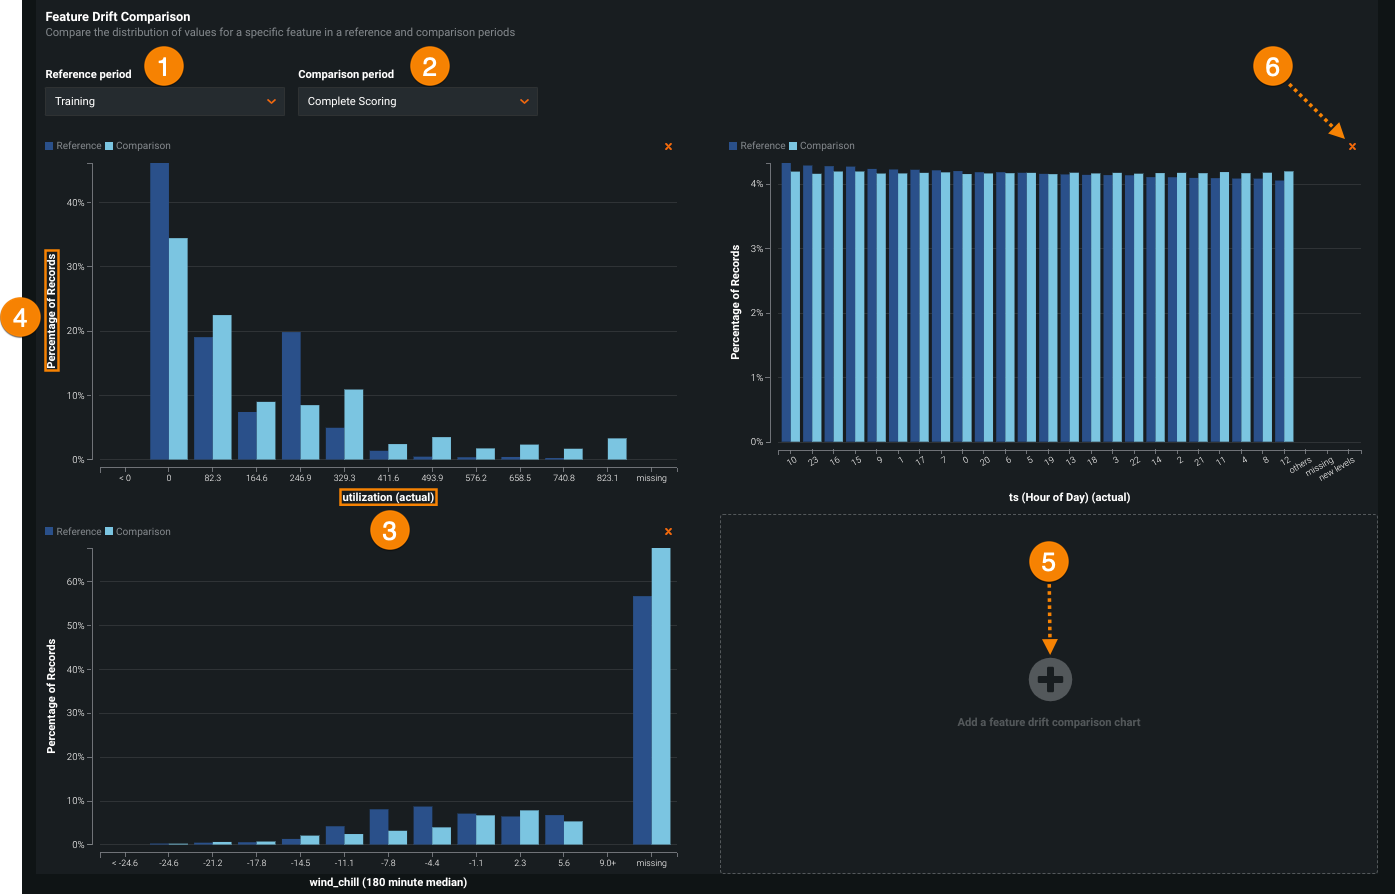
Use the feature drift comparison chart
The Feature Drift Comparison section includes the following elements and controls:
| Element | Description | |
|---|---|---|
| 1 | Reference period | Sets the date range of the period to use as a baseline for the drift comparison charts. |
| 2 | Comparison period | Sets the date range of the period to compare data distribution against the reference period. You can also select an area of interest on the heat map to serve as the comparison period. |
| 3 | Feature values (X-axis) |
Represents the range of values in the dataset for the feature in the Feature Drift Comparison chart. |
| 4 | Percentage of Records (y-axis) |
Represents the percentage of the total dataset represented by a range of values and provides a visual comparison between the selected reference and comparison periods. |
| 5 | Add a feature drift comparison chart | Generates a Feature Drift Comparison chart for a selected feature. |
| 6 | Remove this chart | Removes a Feature Drift Comparison chart. |
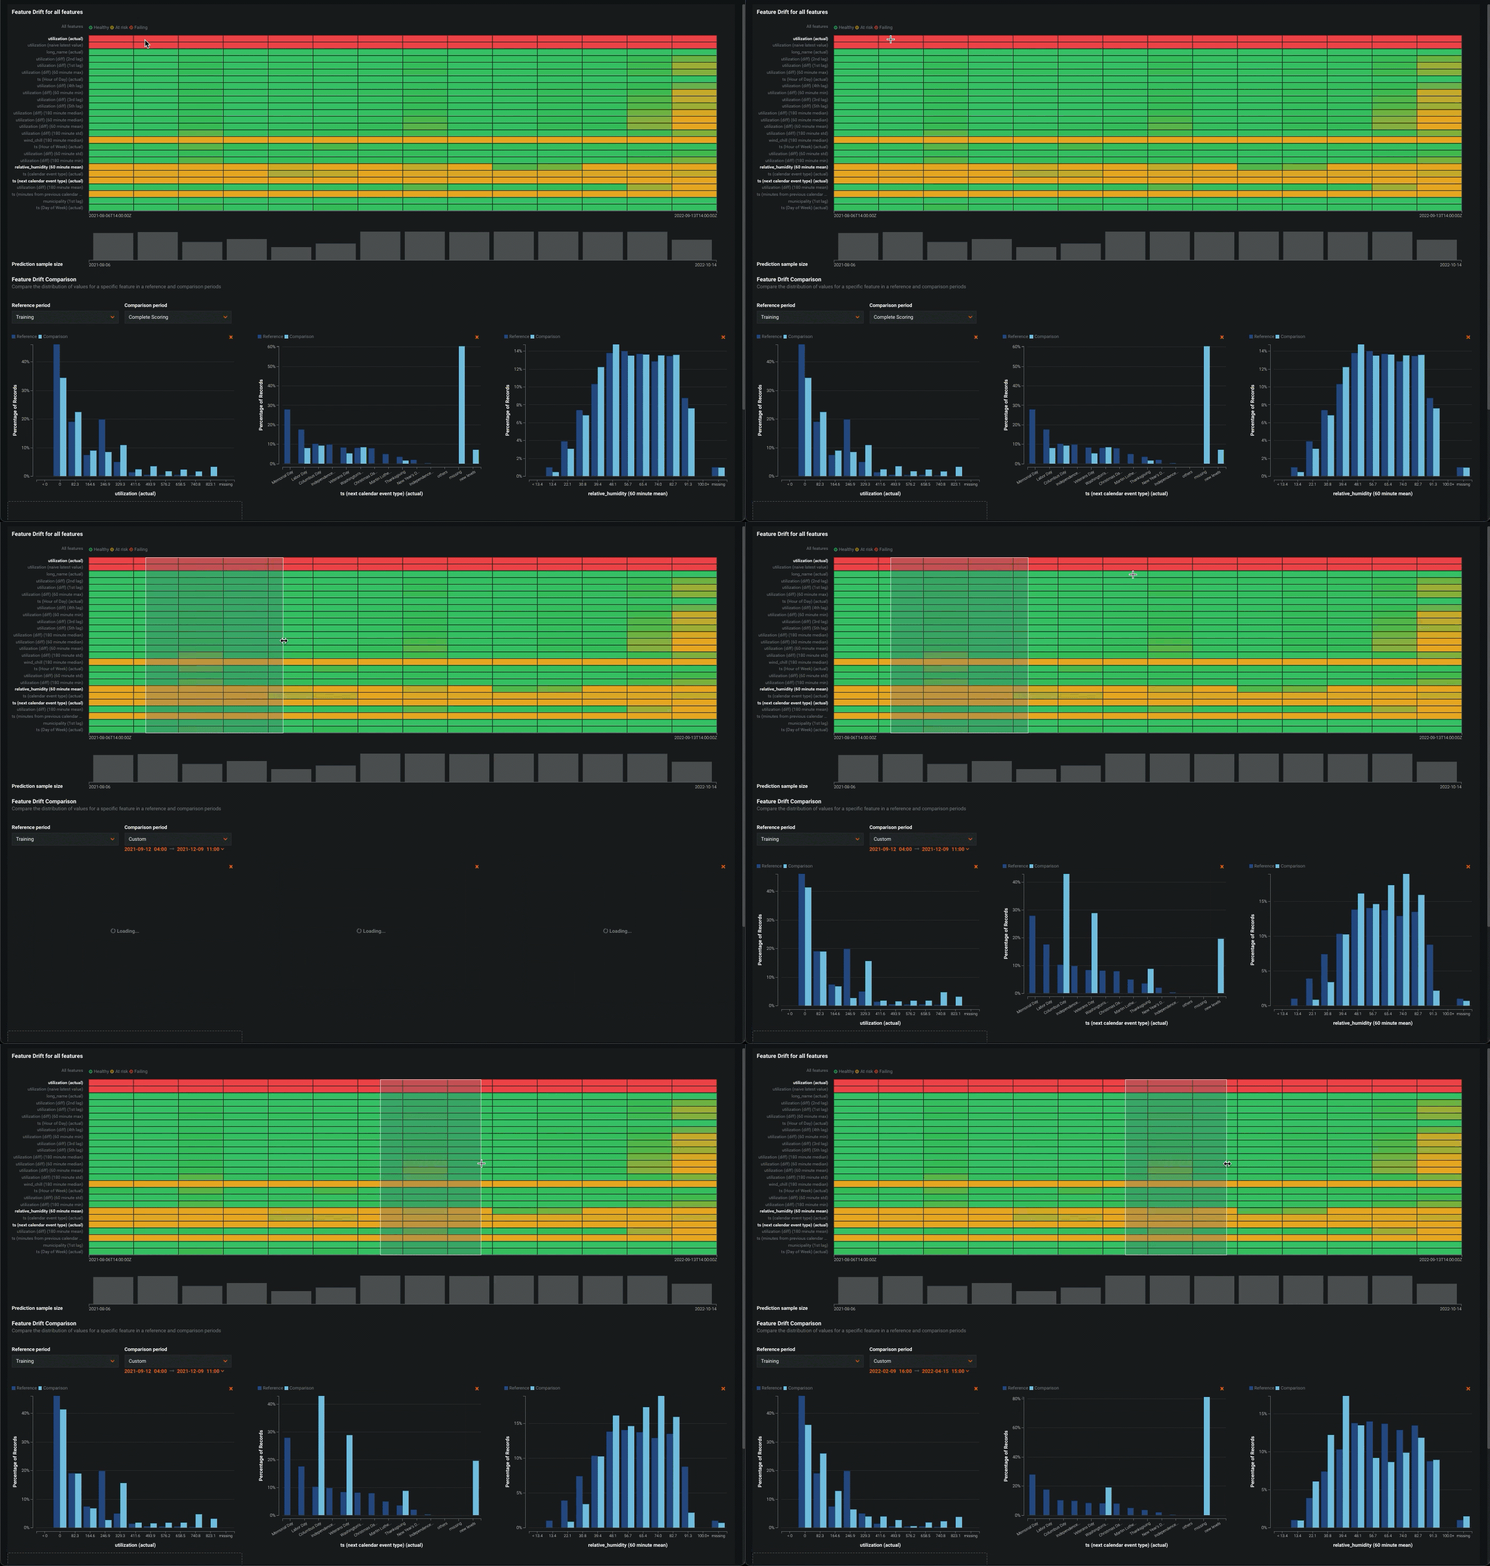
Set the comparison period on the feature drift heat map
To select an area of interest on the heat map to serve as the comparison period, click and drag to select the period you want to target for feature drift comparison:
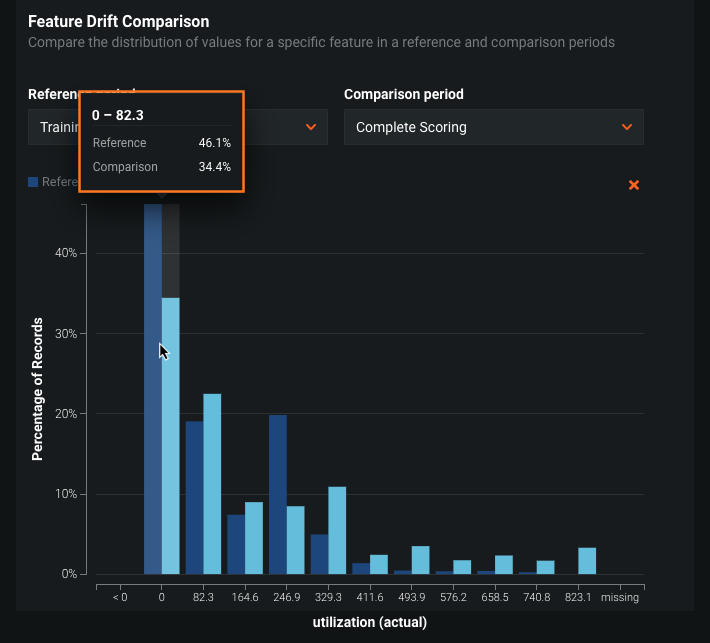
To view additional information on a Feature Drift Comparison chart, hover over a bar in the chart to see the range of values contained in that bar, the percentage of the total dataset those values represent in the Reference period, and the percentage of the total dataset those values represent in the Comparison period:
