Fairness tab
Availability information
The Fairness tab is only available for DataRobot MLOps users. Contact your DataRobot representative for more information about enabling this feature.
After you configure a deployment's fairness settings, you can use the Fairness tab to configure tests that allow models to monitor and recognize, in real time, when protected features in the dataset fail to meet predefined fairness conditions. When viewing the Deployment inventory with the Governance lens, the Fairness column provides an at-a-glance indication of how each deployment is performing based on the fairness tests set up in the Settings > Data tab.
To view more detailed information for an individual model or investigate why a model is failing fairness tests, click on a deployment in the inventory list and navigate to the Fairness tab.
Note
To receive email notifications on fairness status, configure notifications, schedule monitoring, and configure fairness monitoring settings.
Investigate bias
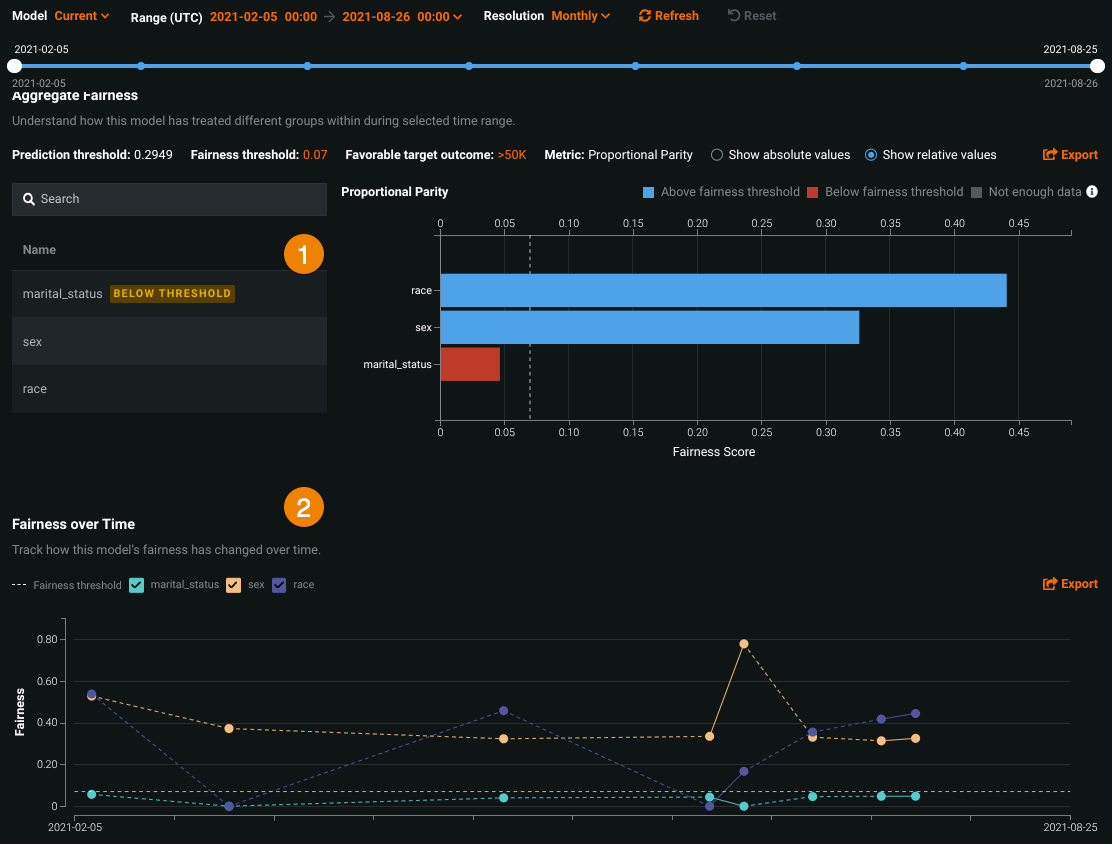
The Fairness tab helps you understand why a deployment is failing fairness tests and which protected features are below the predefined fairness threshold. It provides two interactive and exportable visualizations that help identify which feature is failing fairness testing and why.
| Chart | Description | |
|---|---|---|
| 1 | Per-Class Bias chart | Uses the fairness threshold and fairness score of each class to determine if certain classes are experiencing bias in the model's predictive behavior. |
| 2 | Fairness Over Time chart | Illustrates how the distribution of a protected feature's fairness scores have changed over time. |
If a feature is marked as below threshold, the feature does not meet the predefined fairness conditions.
Select the feature on the left to display fairness scores for each segmented attribute and better understand where bias exists within the feature.
To further modify the display, see the documentation for the version selector.
View per-class bias
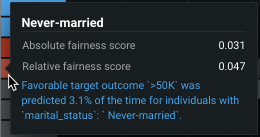
The Per-Class Bias chart helps to identify if a model is biased, and if so, how much and who it's biased towards or against. For more information, see the existing documentation on per-class bias.
Hover over a point on the chart to view its details:
View fairness over time
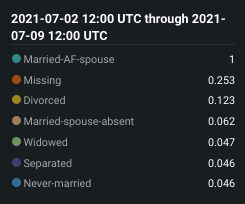
After configuring fairness criteria and making predictions with fairness monitoring enabled, you can view how fairness scores of the protected feature or feature values have changed over time for a deployment. The X-axis measures the range of time that predictions have been made for the deployment, and the Y-axis measures the fairness score.
Hover over a point on the chart to view its details:
You can also hide specific features or feature values from the chart by unchecking the box next to its name:
The controls work the same as those available on the Data Drift tab.
Feature considerations
- Bias and Fairness monitoring is only available for binary classification models and deployments.
- To upload actuals for predictions, an association ID is required. It is also used to calculate True Positive & Negative Rate Parity and Positive & Negative Predictive Value Parity.


