Derived features
The Feature Discovery process uses a variety of heuristics to determine the list of features to derive in a DataRobot project. The results depend on a number of factors such as detected feature types, characteristics of the features, relationships between datasets, data size constraints, and more.
See also Feature engineering controls and Feature reduction sections.
Analysis of derived features
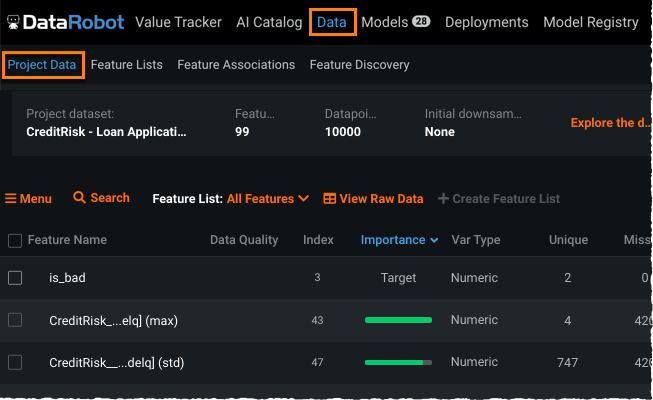
After EDA2 completes, the Data page lists newly discovered and derived features with their corresponding importance scores on the Project Data tab.
All derived features are now listed. The name is comprised of the dataset alias and type of transformation. (See the aggregation reference for more detail.) If the display is concatenated, you can hover on a feature to see the complete name:
Some tabs available on the Data page function the same as projects that don't use Feature Discovery:
DataRobot provides additional tabs and tools available on the Data tab that help you analyze Feature Discovery projects:
- Feature Lineage on the Project Data tab shows how your engineered features were derived.
- The Feature Discovery tab provides a feature derivation log and a summary of dataset relationships.
Feature Lineage
The Feature Lineage tab is available when you access a feature on the Project Data tab. The Project Data tab provides a list of all available project features—original, user- or auto-transformed, and derived by the Feature Discovery process. Click to expand a feature and explore its characteristics. For each feature, depending on type, there are a variety of sub-tabs available, one of which is the Feature Lineage tab.
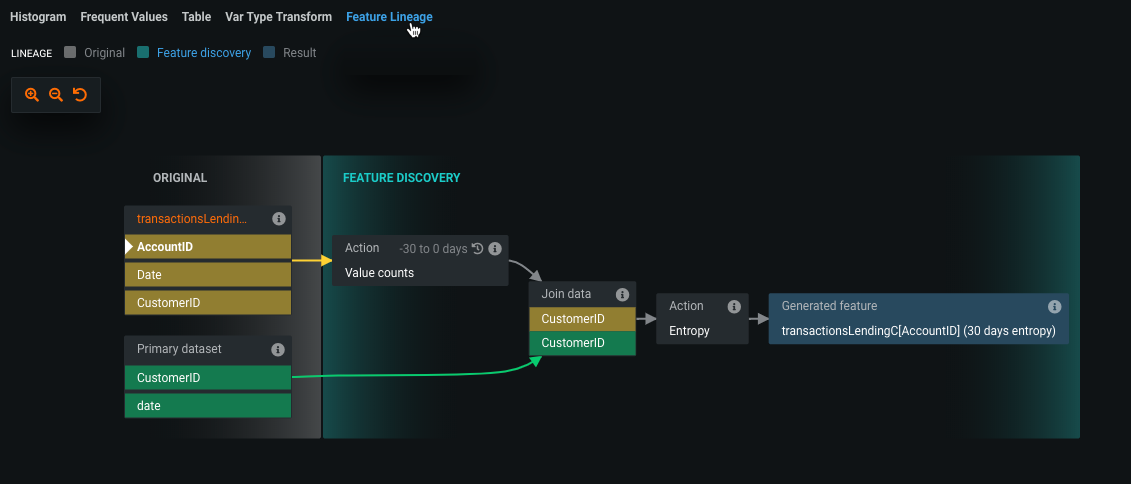
The Feature Lineage tab provides a visual description of how the feature was derived and the datasets that were involved in the feature derivation process. It visualizes the steps followed to generate the features (on the right) from the original dataset (on the left). Each element represents an action or a JOIN.
Click a feature to expand it and then click the Feature Lineage tab. For example:
You can work with the results as follows:
-
Under Original, DataRobot displays the primary and secondary datasets. Click the name of the secondary dataset to see its Info page in the AI Catalog.
-
Hover on any info (
i) icon to see details of the element. -
Click on elements of the visualization to understand the lineage. Parent actions are to the left of the element you click. Click once on a feature to show its parent feature, click again to return to the full display.
Clicking the yellow CustomerID, by contrast, illustrates the JOIN and resulting derived feature.
-
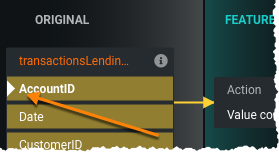
The white triangle indicates that the next action (e.g., max, count, etc.) will be performed on this feature.
-
Elements marked with the clock icon (
 ) are time-aware (i.e., derived using time index).
Feature Discovery tab
The Feature Discovery tab on the Data page provides dataset relationship details, a feature derivation summary, and a feature derivation log.
Dataset relationship details
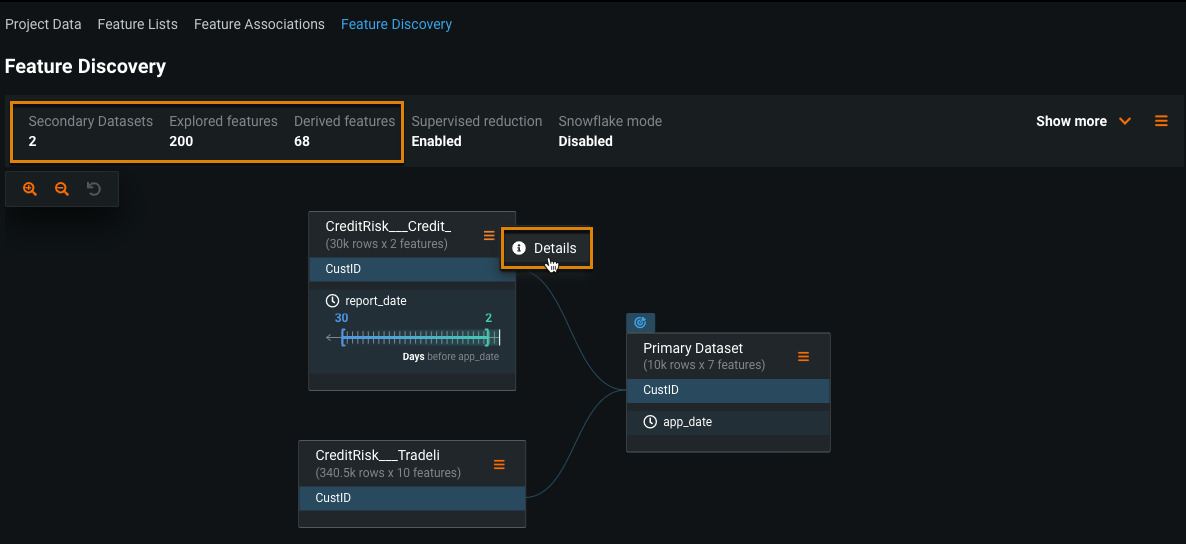
The Feature Discovery tab provides a visualization of the dataset relationships. The tab shows the number of secondary datasets, explored features, and derived features that resulted from Feature Discovery.
Click Details in the menu on the dataset's tile for more information about the dataset.
Feature derivation summary
Before generating features for the full primary dataset, DataRobot evaluates a sample of the dataset to identify and discard:
- Low impact features
- Redundant features
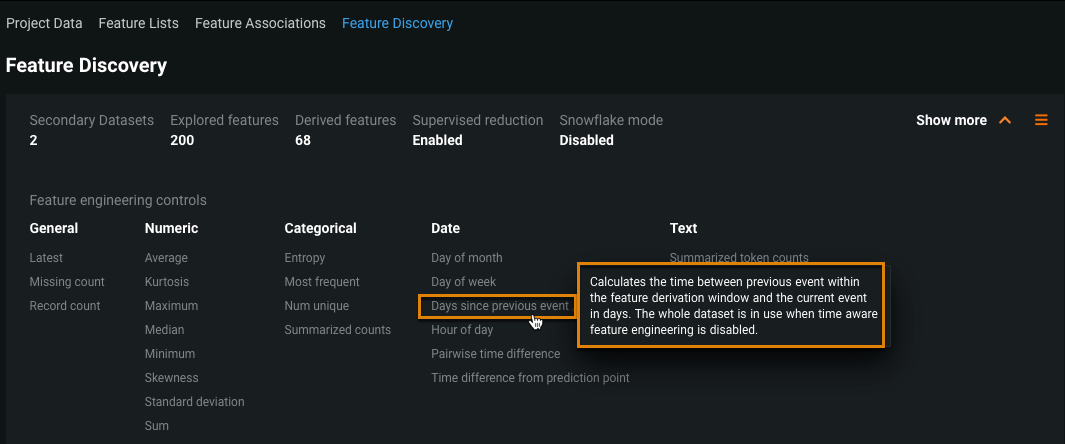
Click Show more in the Feature Discovery tab to display the feature engineering controls used to explore the features.
In the example above, 200 features were evaluated (explored) and 132 were discarded in the feature reduction process, resulting in 68 derived features on the full dataset. DataRobot automatically adds those 68 derived features to the Informative Features feature list.
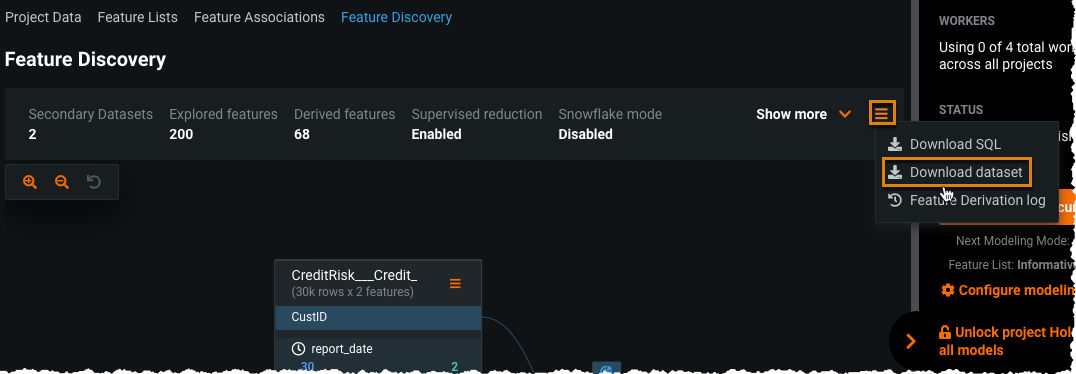
Click the Download dataset option in the menu on the right to download the dataset generated by the Feature Discovery process—that is, the multiple new features derived from the secondary datasets.
The downloaded CSV contains the original dataset and the Feature Discovery-derived features; it excludes discarded features and those that resulted from the Search for interaction option.
Feature derivation log
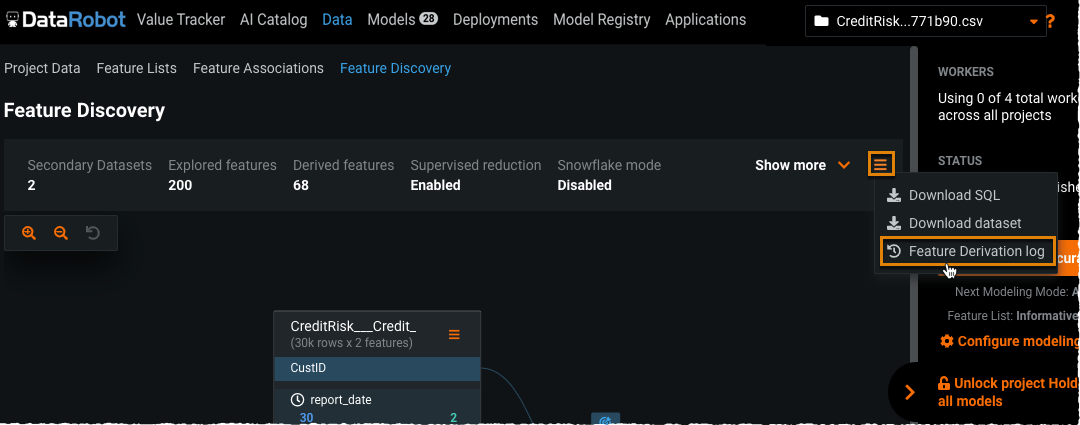
Click the Feature Derivation log option in the menu on the right for details of the feature generation and reduction process.
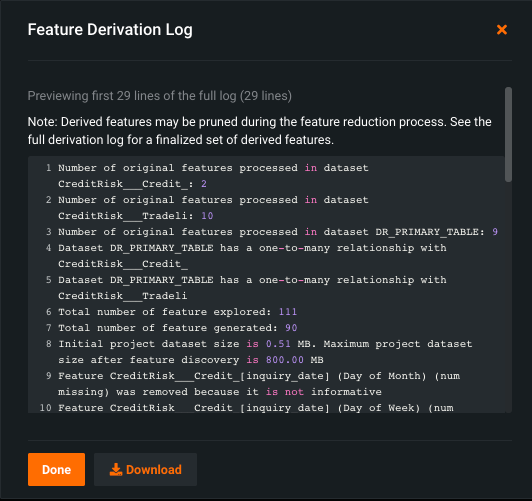
The feature derivation log indicates:
- Relationships between tables
- Number of features processed in each secondary dataset
- Removed features and reasons for removal
Depending on the number of features in your dataset, the log may not display all activity and instead serves as a preview. Click Download to access the complete log contents.
Feature aggregations
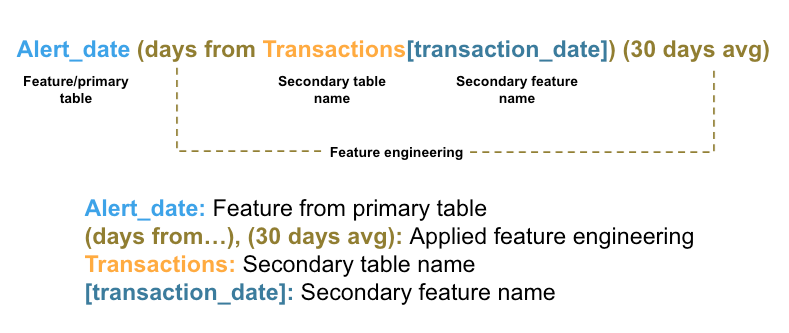
When DataRobot creates new features as part of the feature derivation process, the feature name provides an indication of the action taken on the feature, as described and then illustrated below:
-
Primary table: Feature names begin with the name of the feature. The name of the primary table is not included. This also applies to date features that are used as the prediction point.
-
Secondary table(s): The table name is appended to the primary table feature name, with the secondary feature name indicated in brackets
[ ]. The applied feature engineering is appended in parentheses( ). -
Transformations: Automatic or user-created transformed features are prefaced with an info icon (
 ).
).
The following tables list aggregations that apply based on the detected feature type. These use a sample customer/sales dataset to provide examples.
Note
You can enable and disable transformations for specific feature types during Feature Discovery. See Feature engineering controls for details.
General feature types
| Aggregation | Example |
|---|---|
| Record count | Number of transactions for each customer |
| Min count per intermediate entity | Minimum number of items per order across orders of each customer |
| Max count per intermediate entity | Maximum number of items per order across orders of each customer |
| Average count per intermediate entity | Average number of items per order across orders of each customer |
| Latest | Most recent product bought by each customer |
Numeric feature types
| Aggregation | Example |
|---|---|
| Min | Minimum transaction amount, per customer |
| Max | Maximum transaction amount, per customer |
| Sum | Total amount from all transactions, per customer |
| Average | Average number of items, per order, among customer orders |
| Median | Median number of items, per order, among customer orders |
| Missing count | Number of transactions, per customer, that have a missing amount |
| Standard deviation (measures the variation of a set of values) | Std of item prices among orders, per customer |
| Skewness (measure of the asymmetry of the frequency-distribution curve) | Asymmetry of the distribution of item prices among customer orders relative to the mean |
| Kurtosis (measures the heaviness of a distribution's tails relative to a normal distribution) | "Tailedness" of the distribution of item prices among customer orders |
Categorical feature types
| Aggregation | Example |
|---|---|
| Most frequent | Most frequent merchant type in transactions, per customer |
| Entropy | Entropy of merchant types in transactions, per customer |
| Summarized counts | Count of transactions per merchant type for each customer |
| Unique count | Number of unique merchant types for each customer |
| Missing count | Number of transactions, per customer, with missing merchant type |
Date feature types
| Aggregation | Example |
|---|---|
| Interval from previous | Time since the last transaction by the same customer, per transaction |
| Time since last | Time since the cutoff date of the last transaction of the customer |
| Duration from creation date | Age of customer at profile creation date |
| Entropy of date difference | Entropy of binned difference with cutoff date |
| Pairwise date difference | Pairwise data difference within a secondary dataset (maximum of 10 different date columns) |
Text feature types
| Aggregation | Example |
|---|---|
| Word/character count | Length of remarks |
| Summarized token counts | Counts of each word/character in the product descriptions of all transactions |
Categorical Statistics
Numeric features can be aggregated by common statistics like sum, min, max, count, and average but sometimes it makes more sense to aggregate these statistical groupings by other category column values.
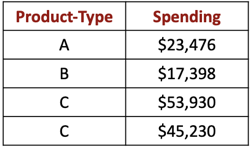
In the following business use case, the average spending by product type is more useful than the overall average amount of spending. Spending and Product_Type are features in a secondary dataset. The values of the Spending numeric feature correspond to the categories of the Product-Type categorical feature:
If Categorical Statistics aggregation is enabled for Feature Discovery, DataRobot explores numeric statistics for each category of the Product-Type feature, for example:
- Spending(30 days min)
- Spending(30 days min by Product_Type = A)
- Spending(30 days min by Product_Type = B)
- Spending(30 days min by Product_Type = C)
- ...
Categorical Statistics aggregation is turned off by default. See Feature engineering controls to learn how to enable it.
Note
Feature Discovery only explores Categorical Statistics for categorical columns that have at most 50 unique values.
