XEMP Prediction Explanations
This section describes XEMP-based Prediction Explanations. See also the general description of Prediction Explanations for an overview of SHAP and XEMP methodologies.
See the associated considerations for important additional information.
Prediction Explanations overview
The following steps provide a general overview of using the Prediction Explanations tab with uploaded datasets. You can upload and compute explanations for additional datasets, however.
Note
In XEMP-based projects, one significant difference between methodologies is the ability to additionally generate Prediction Explanations for multiclass projects. The basic function and interpretation are the same, with the addition of multiclass-specific filtering and viewing options.
-
Click Prediction Explanations for the selected model.
-
If Feature Impact has not already been calculated for the model, click the Compute Feature Impact button. (You can calculate impact from either the Prediction Explanations or Feature Impact tabs—they share computational results.)
-
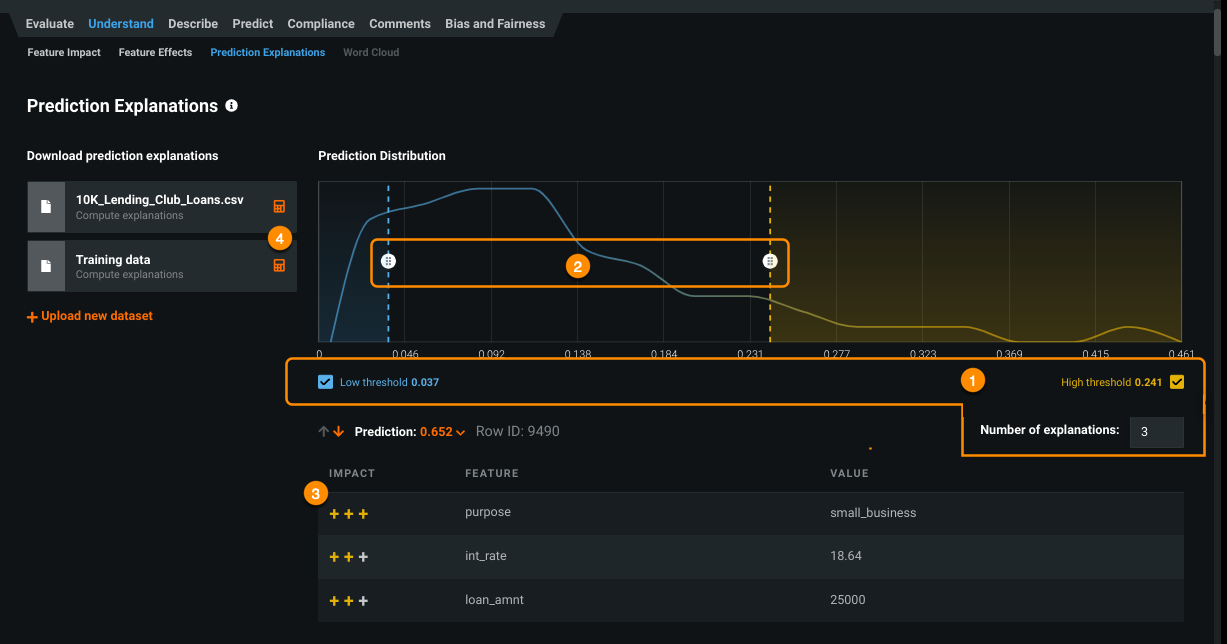
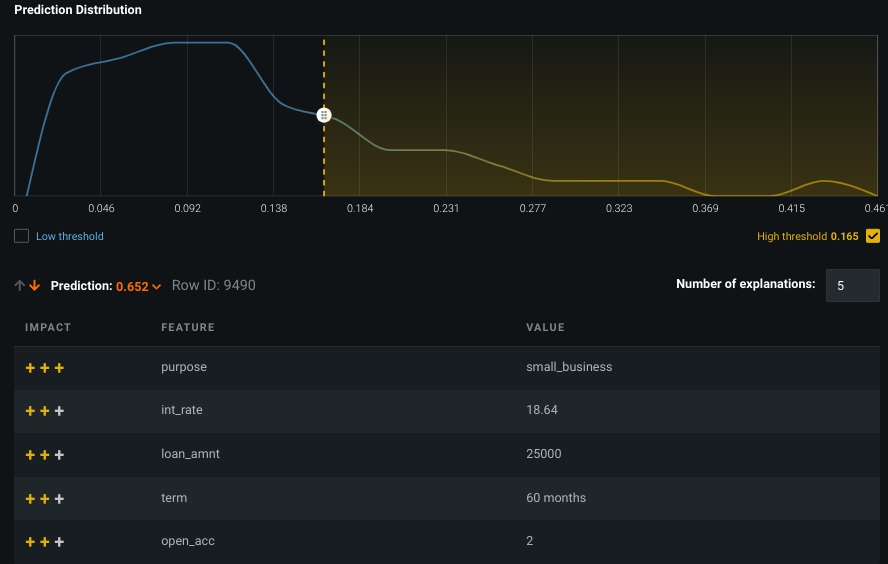
Once the computation completes, DataRobot displays the Prediction Explanations preview, using the default values (described below):
Component Description 1 Computation inputs Sets the number of explanations to return for each record and toggles whether to apply low and/or high ranges to the selection. 2 Change threshold values Sets low and high validation score thresholds for prediction selection. 3 Prediction Explanations preview Displays a preview of explanations, from the validation data, based on the input and threshold settings. 4 Calculator 
Initiates computation of predictions and then explanations for the full selected prediction set, using the selected criteria. -
If desired, change the computation inputs and/or threshold values and update the preview.
-
Compute using the new values and download the results.
Note
Additional elements for Visual AI projects, described below, are available to support the unique quality of image features.
DataRobot applies the default or user-specified baseline thresholds to all datasets (training, validation, test, prediction) using the same model. Whenever you modify the baseline, you must update the preview and recompute Prediction Explanations for the uploaded datasets.
Interpret XEMP Prediction Explanations
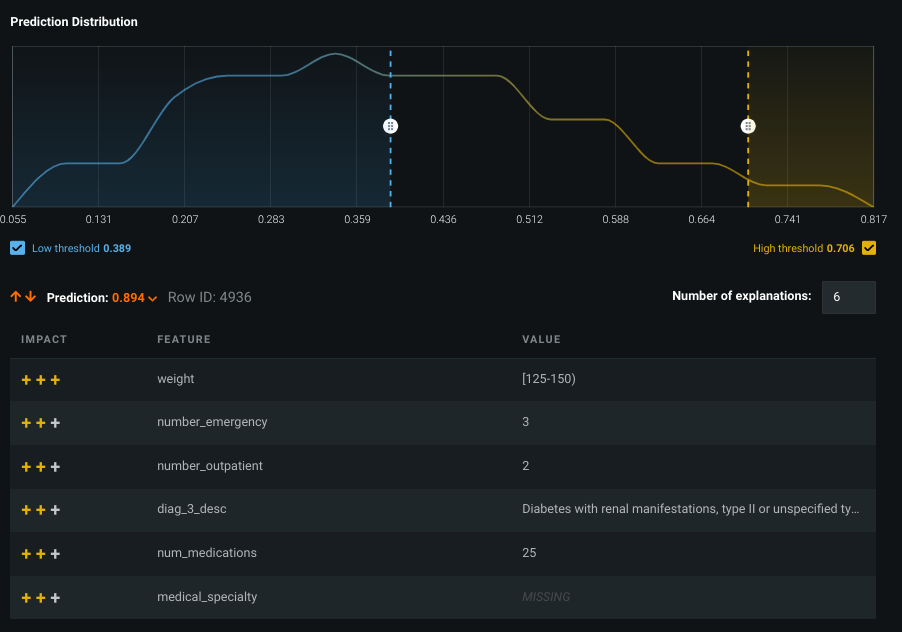
A sample preview looks as follows:
A simple way to explain this result is:
The prediction value of 0.894 can be found in row 4936. For that value, the six listed features had the highest positive impact on the prediction.
From the example above, you could answer "Why did the model give one of the patients a 89.4% probability of being readmitted?" The explanations indicate that the patient's weight, number of emergency visits (3), and 25 medications all had a strong positive effect on the (also positive) prediction (as well as other reasons).
For each prediction, DataRobot provides an ordered list of explanations, with the number of explanations based on the setting. Each explanation is a feature from the dataset and its corresponding value, accompanied by a qualitative indicator of the explanation’s strength. A positive influence is represented as +++ (strong), ++ (medium) or + (weak), and a negative influence is represented as --- (strong), -- (medium) or - (weak). For more information, see the description of how qualitative strength is calculated for XEMP.
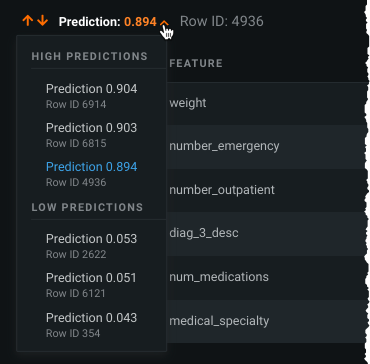
Scroll through the prediction values to see results for other patients:
Notes on explanations
Consider the following:
- If the data points are very similar, the explanations can list the same rounded up values.
- It is possible to have an explanation state of MISSING if a “missing value” was important (a strong indicator) in making the prediction.
- Typically, the top explanations for a prediction have the same direction as the outcome, but it is possible that with interaction effects or correlations among variables, an explanation could, for instance, have a strong positive impact on a negative prediction.
- The number in the ID column is the row number ID from the imported dataset.
-
It is possible that a high-probability prediction shows an explanation of negative influence (or, conversely, a low score prediction shows a variable with high positive effect). In this case, the explanation is indicating that if the value of the variable were different, the prediction would likely be even higher.
For example, consider predicting hospital readmission risk for a 107-year-old woman with a broken hip, but with excellent blood pressure. She undoubtedly has a high likelihood of readmission, but due to her blood pressure she has a lower risk score (even though the overall risk score is very high). The Prediction Explanations for blood pressure indicate that if the variable were different, the prediction would be higher.
How are explanations calculated for a model trained on 100%?
The question arises because validation data is necessary for the calculation of Prediction Explanations, but the 100% model uses validation for training. However, because partitions are defined at the project level, the same rows are used in the validation partition for every model. Those are the rows used to pick “exemplar” values for the features in XEMP explanations—they are the same for every model, including 100% models.
If you use the validation rows for predictions on that model—for example, in calculating metrics—the resulting predictions will then be “in-sample”. In that case, approach the results with an appropriate amount of uncertainty regarding whether they will generalize to new data as there is the risk of target leakage.
In the case of Prediction Explanations on a deployed model that makes predictions on new data, predictions are not on the training data. Instead they use the new data and synthetic rows based on the new data plus the “exemplar” values. Although the exemplars come from the validation rows, DataRobot does not use predictions from those rows in the explanation, so the risk of leakage is remote.
Modify the preview
DataRobot computes a preview of up to 10 Prediction Explanations for a maximum of six predictions from your training data (i.e., from the validation set).
The following are DataRobot's default settings for the Prediction Explanations tab:
| Component | Default value | Notes |
|---|---|---|
| Number of Prediction Explanations | 3 | Set any number of explanations between 1 and 10. |
| Number of predictions | 6 maximum | The number of preview predictions shown is capped by the number of data points in the specified range. If there are only four in the specified range, for example, only four rows are shown in the preview. |
| Low threshold checkbox | Selected | NA |
| High threshold checkbox | Selected | NA |
| Prediction threshold range | Top and bottom 10% of the prediction distribution | Drag to change. |
The training data is automatically available for prediction and explanation preview. When you upload your prediction dataset, DataRobot computes Prediction Explanations for the full set of predictions.
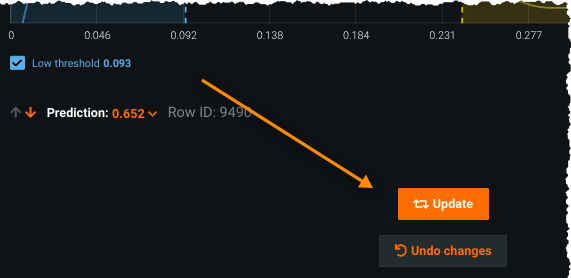
If you modify the computation inputs and/or threshold values, DataRobot prompts you to update the preview:
Click Update to redisplay the preview with the new settings; click Undo Changes to restore the previous settings. Updating the preview generates a new set of explanations with the given parameters for up to six predictions from within the highlighted range.
Change computation inputs
There are three inputs you can set for DataRobot to use when computing Prediction Explanations—a low or high prediction threshold value (when checked) or no threshold when unchecked, and the number of explanations for each prediction.
To change the number of explanations, type (or use the arrows in the box) to set a value between one and 10. Check the low and high threshold boxes and use the sliders to set the range from which to view Prediction Explanations. Modifying the inputs prompts you to update the preview.
Tip
You must click Update any time you modify the thresholds (and want to save the changes).
Change threshold values
The threshold values demarcate a range in the prediction distribution from which DataRobot pulls the predictions. To change the threshold values, drag the low and/or high threshold bar to your desired location and update the preview.
You can apply low and high threshold filters to speed up computation. When at least one is specified, DataRobot only computes Prediction Explanations for the selected outlier rows. Rows are considered to be outliers if their predicted value (in the case of regression projects) or probability of being the positive class (in classification projects) is less than the low or greater than the high value. If you toggle both filters off, DataRobot computes Prediction Explanations for all rows.
If Exposure is set (for regression projects), the distribution shows the distribution of adjusted predictions (e.g., predictions divided by the exposure). Accordingly, the label of the distribution graph changes to Validation Predictions/Exposure and the prediction column name in the preview table becomes Prediction/Exposure.
Compute and download predictions
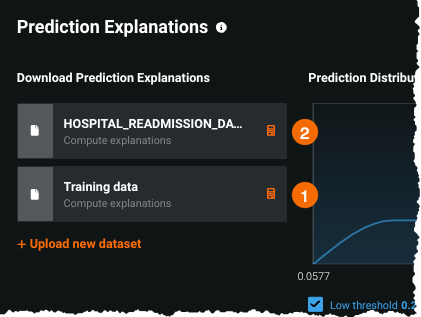
DataRobot automatically previews Prediction Explanations for up to six predictions from your training data's validation set. These are shown in the initial display. You can, however, compute and download explanations for the full project data (1) or for new datasets (2):
Upload a dataset
Once you are satisfied that the thresholds are returning the types and range of explanations that you are interested in, upload one or more prediction datasets. To do so:
- Click + Upload new dataset. DataRobot transfers you to the Make Predictions tab, where you can browse, import, or drag datasets for upload. (Optional) Append columns.
- Import the new dataset. When import completes, click again on the Understand > Prediction Explanations tab to return.
Append columns
Sometimes you may want to append columns to your prediction results. Appending is a useful tool, for example, to help minimize any additional post-processing work that may be required. Because by default the target feature is not included in the explanation output, appending it is a common action.
The append action is independent of other actions, so you can append at any point in the Prediction Explanation workflow (before or after uploading new datasets or running calculations). When you initiate a download, DataRobot appends the columns you added to the output.
To append features (and you can only append a column that was present when the model was built) either switch to the Make Predictions tab or click Upload a new dataset and you will be taken to that tab automatically. Follow the instructions there beginning with step 5.
Compute full explanations
Although by default the insight that you see reflects validation data, you can view predictions and explanations for all data points in the project's training data. To do so, click the compute button (![]() ) next to the dataset named Training data. This dataset is automatically available for every model.
) next to the dataset named Training data. This dataset is automatically available for every model.
Generate and download Prediction Explanations
You can generate explanations on predictions from any uploaded dataset. First though, DataRobot must calculate explanations for all predictions, not just the six from the preview. To compute and download predictions once your dataset is uploaded:
-
If DataRobot has not calculated explanations for all predictions in a dataset, click the calculator icon (
 ) to the right of the dataset to initiate explanation computation.
 -
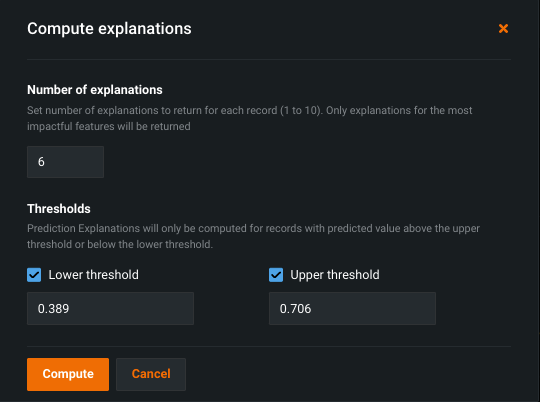
Complete the fields in the Compute explanations modal to set the parameters and click Compute to compute explanations for each row in the corresponding dataset:
DataRobot begins calculating explanations; track the progress in the Worker Queue.
-
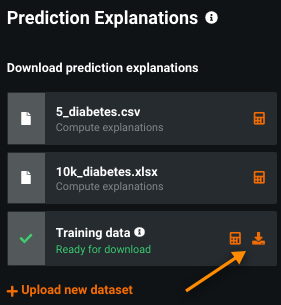
When calculations complete, the dataset is marked as ready for download.
-
Click the download icon (
 ) to export all of the dataset's predictions and corresponding explanations in CSV format. Note that:
- Predictions outside the selected range are included in the data but do not contain explanations.
- The download includes a column for predictions and another for adjusted predictions. If there is no exposure, the columns are the same.
-
If you update the settings (change the thresholds or number of explanations) you must first click the Update button and then recalculate the explanations by clicking the calculator:
Note
Only the most recent version of explanations is saved for a dataset. To compare parameter settings, download the Prediction Explanations CSV for a setting and rerun them for the new setting.
Multiclass Prediction Explanations
Prediction Explanations for multiclass classification projects are available from both a Leaderboard model or a deployment.
Explanations from the Leaderboard
In multiclass projects, DataRobot returns a prediction value for each class—multiclass Prediction Explanations describe why DataRobot determined that prediction value for any class that explanations were requested for. So if you have classes A, B, and C, with values of 0.4, 0.1, 0.5 respectively, you can request the explanations for why DataRobot assigned class A a prediction value of 0.4.
View explanations preview
-
Access XEMP-based Prediction Explanations from a Leaderboard model's Understand > Prediction Explanations tab.
-
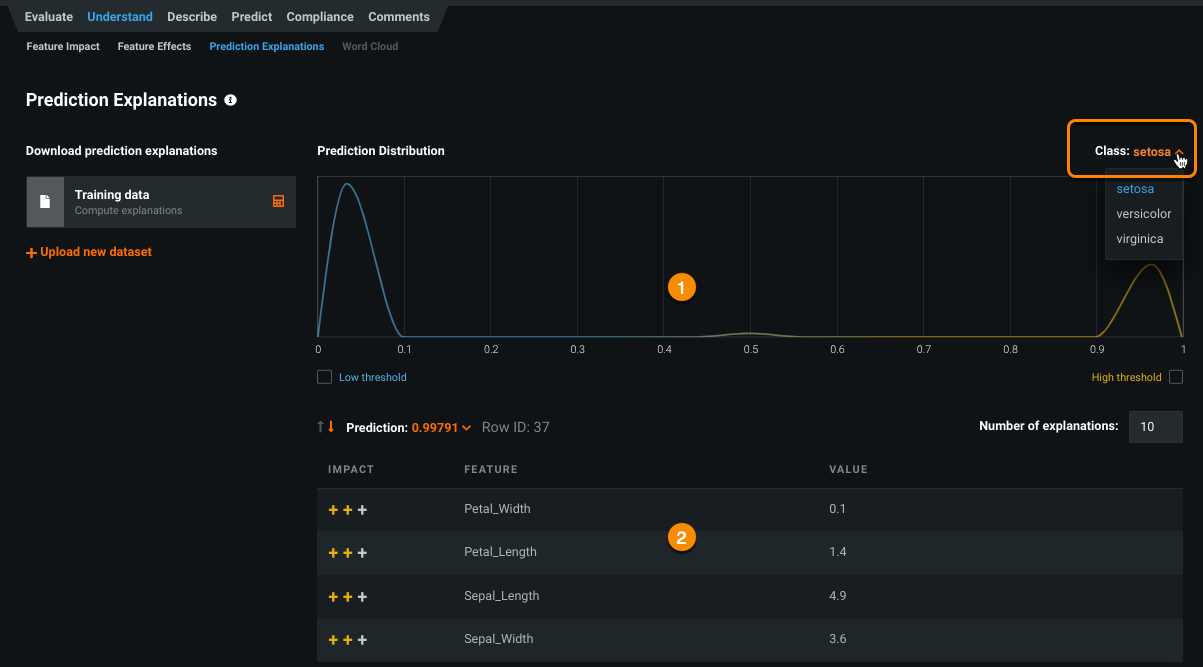
Use the Class dropdown to view training data-based explanations for the class. Each class has its own distribution chart (1) and its own set of samples (2).
Deep dive: Multiclass preview
Preview data is available for a subset of the most frequent model classes. The selection is derived from the Lift Chart distribution and typically represents the top 20 classes. Although multiclass supports an unlimited number of classes, the display supports just the 20 available in the Lift Chart.
There are models that don't have a Lift Chart calculated. Most often this happens for slim run projects (for example, GB+ dataset sizes or multiclass projects with >10 classes) trained into validation (>64% for default parameters). In those types of cases, although the chart isn't available, DataRobot can still calculate explanations. This is not unique to multiclass projects, multiclass just has additional corner cases when there can be no distribution chart for some classes—when that class is rare and wasn't present in training data, for example.
When calculating the multiclass preview, DataRobot selects a limited number of classes to display (there can be up to 1000) in support of better UX and faster calculation times. As a result, the available display is a selection of those classes that do have Lift Chart calculations (DataRobot calculates 20 classes for a multiclass model). If the model doesn't have any Lift Charts data, DataRobot selects the first 20 classes alphabetically.
Calculate explanations
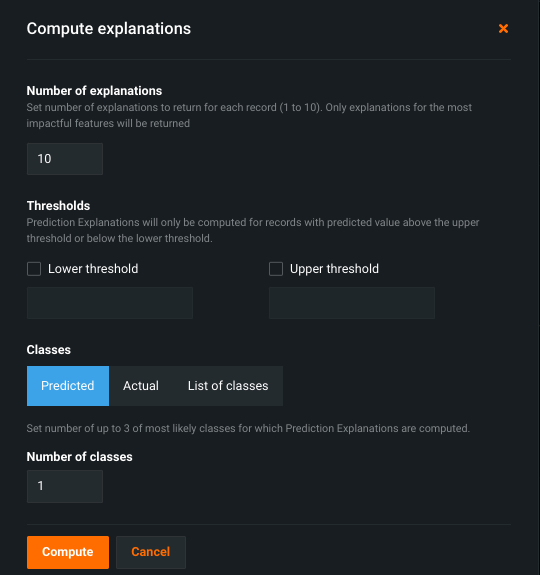
You can calculate explanations either for the full training dataset or for new data. The process is generally the same as for classification and regression projects, with a few multiclass-specific differences. This is because DataRobot calculates explanations separately for each class. Clicking the calculator opens a modal that controls which classes explanations are generated for:
The Classes setting controls the method for selecting which classes are used in explanation computation. The Number of classes setting configures the number of classes, for each row, DataRobot computes explanations for. For example, consider a dataset with 6 classes. Choosing Predicted data and 3 classes will generate explanations for the 3 classes—of the 6—with the highest prediction values. To maximize response and readability, the maximum number of classes to compute explanations for is 10. (This is a different value than what is supported in the prediction preview chart.)
The Classes options include:
| Class | Description |
|---|---|
| Predicted | Selects classes based on prediction value. For each row in the prediction dataset, compute explanations for the number of classes set by the Classes value. |
| Actual | Compute explanations from classes that are known values. For each row, explain the class that is the "ground truth." This option is only available when using the training dataset. |
| List of classes | Selects specific classes from a list of classes. For each row, explain only the classes identified in the list. |
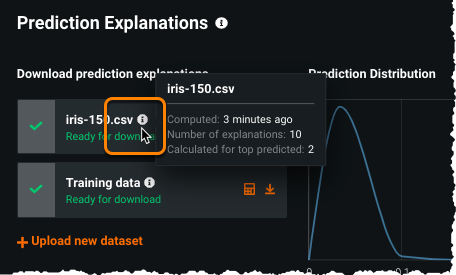
Once explanations are computed, hover on the info icon (![]() ) to see a summary of the computed explanations:
) to see a summary of the computed explanations:
Download explanations
Click the download icon (![]() ) to export all of a dataset's predictions and corresponding explanations in CSV format. Explanations for multiclass projects contain additional fields for each explained class—a class label and a list of explanations (based on your computation settings) for each.
) to export all of a dataset's predictions and corresponding explanations in CSV format. Explanations for multiclass projects contain additional fields for each explained class—a class label and a list of explanations (based on your computation settings) for each.
Consider this sample output:
Some notes:
- Each row has each predicted class explained (1).
- The first class column is the top predicted class.
- If you've used the List of classes option, the output shows just those classes. This is useful if you want a specific class explained, that is, are less interested in predicted values.
When a dataset shows prediction percentages that are close in value, the explanations become very important to understanding why DataRobot predicted a given class—to help understand the predicted class and the challenger class(es).
Explanations from a deployment
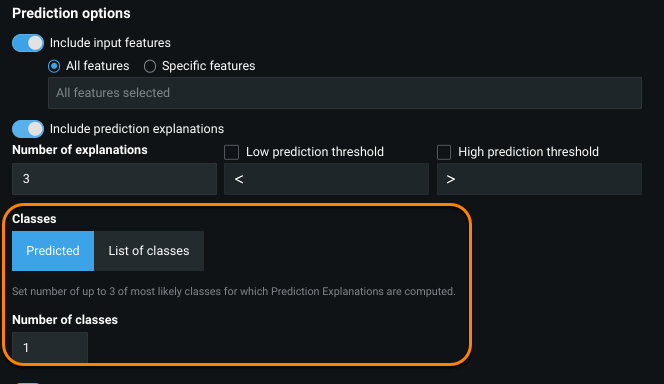
When you calculate predictions from a deployment (Deployments > Predictions > Make Predictions), DataRobot adds the Classes and Number of classes fields to the options available for non-multiclass projects:
Prediction Explanations for Visual AI
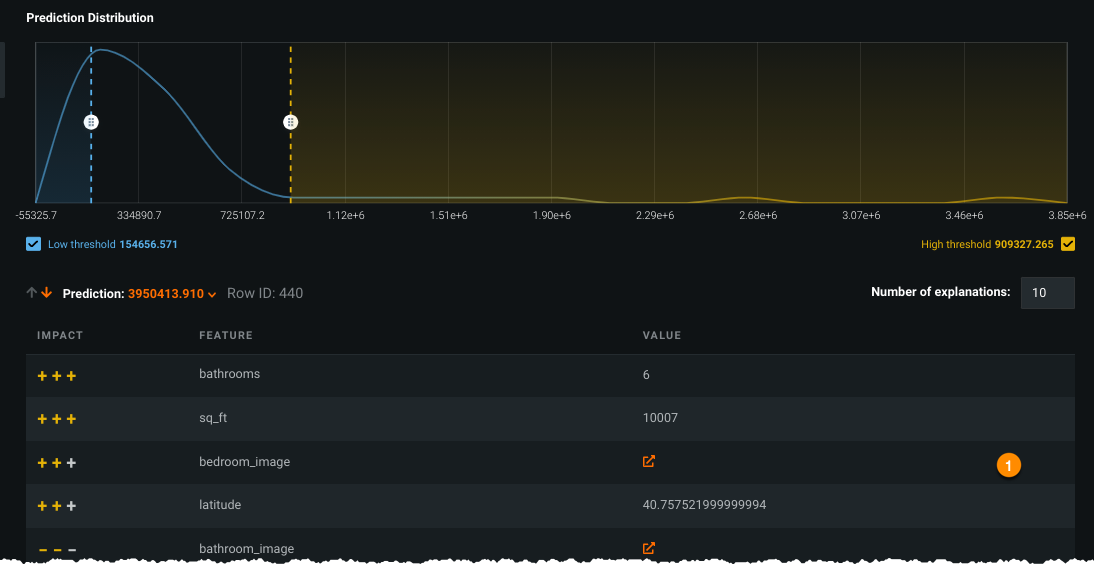
Prediction Explanations for Visual AI projects, also known as Image Explanations, allow you to retrieve explanations for datasets that include features of type "image". Visual AI Image Explanations support all the features described above, with some additions. For explanations size limitations for Visual AI prediction datasets, see the considerations.
Once calculated, notice the addition of an icon, indicating that an image was an important part of the explanation:
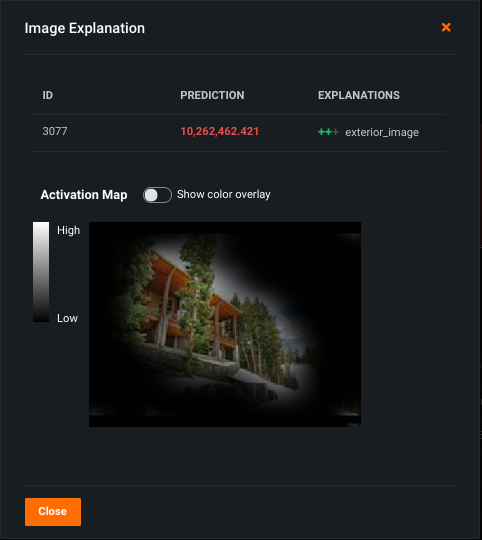
Click on the icon (![]() ) to drill down into the image explanation:
) to drill down into the image explanation:
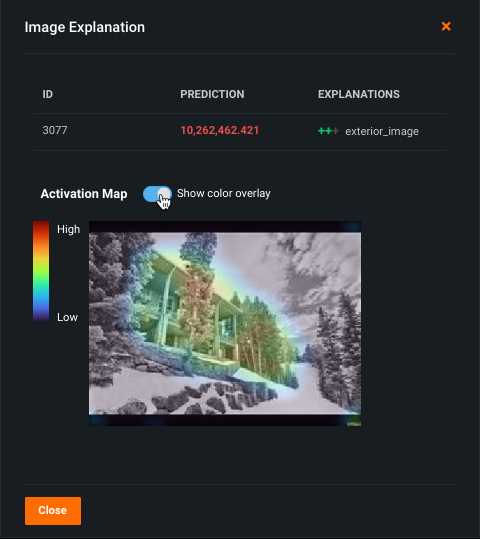
Toggle on the Activation Map to see what the model "looked at" in the image.
Compute and download explanations
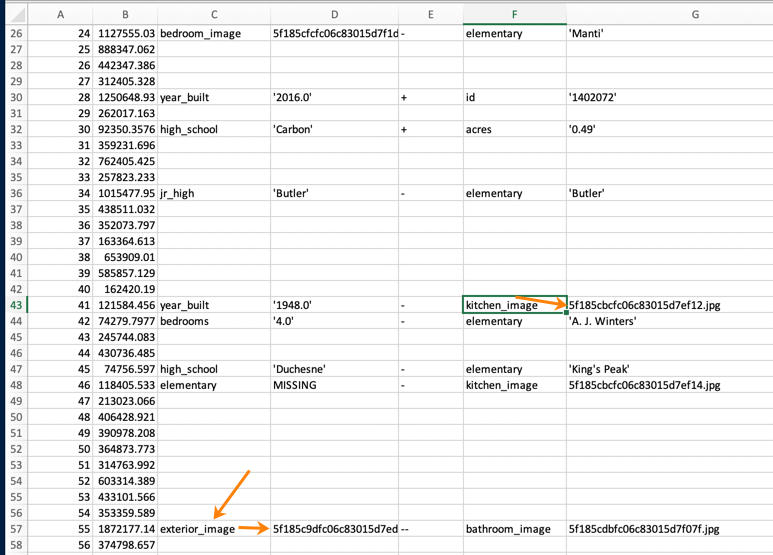
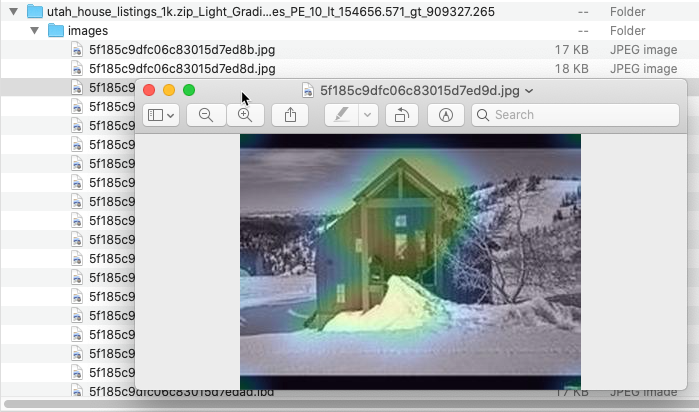
As with Prediction Explanations, you can compute predictions and download explanations for every row in your dataset. When you download the Image Explanations archive, it contains:
- a predictions CSV file (1)
- a folder of images (2)
Open the CSV and notice that for image features that are part of the explanation, the image file name is listed as the feature's value.
Open the image folder to find and view a rendered (heat-mapped) photo of the associated image.

