Optional widgets
All optional widgets must be configured before they can be used in an application.
Filters
Filter widgets provide additional filtering options within an application, and if added to an application, they are accessible on every page (i.e., filter widgets are not page specific). Parameters specified in a filtering widget are applied to all visible chart widgets as well as the All Rows widget.
Note
If there are no results in the filter dropdown in Consume mode, the dataset doesn’t include the required feature type.
Categories
Filters by one or more categorical features.
On the Properties tab, customize the widget using the available parameters:
| Parameter | Description |
|---|---|
| Widget Name | Rename the widget. Replaces the text displaying the widget type. |
| Feature to filter by | Select a categorical feature from the dropdown. You can then filter the application by its feature values. |
Dates
Filters by date features.
On the Properties tab, customize the widget using the available parameters:
| Parameter | Description |
|---|---|
| Widget Name | Rename the widget. Replaces the text displaying the widget type. |
| Feature to set dates for | Select a date feature from the dropdown. You can then filter the application by specific dates. |
Numbers
Filters by numeric features.
On the Properties tab, customize the widget using the available parameters:
| Parameter | Description |
|---|---|
| Widget Name | Rename the widget. Replaces the text displaying the widget type. |
| Feature to set range for | Select a numeric feature from the dropdown. |
| Min | Enter a value that represents the beginning your range (i.e., the minimum value). |
| Max | Enter a value that represents the end of your range (i.e., the maximum value). |
Charts
Chart widgets add visualizations to an application and can be configured to surface important insights in your data and prediction results.
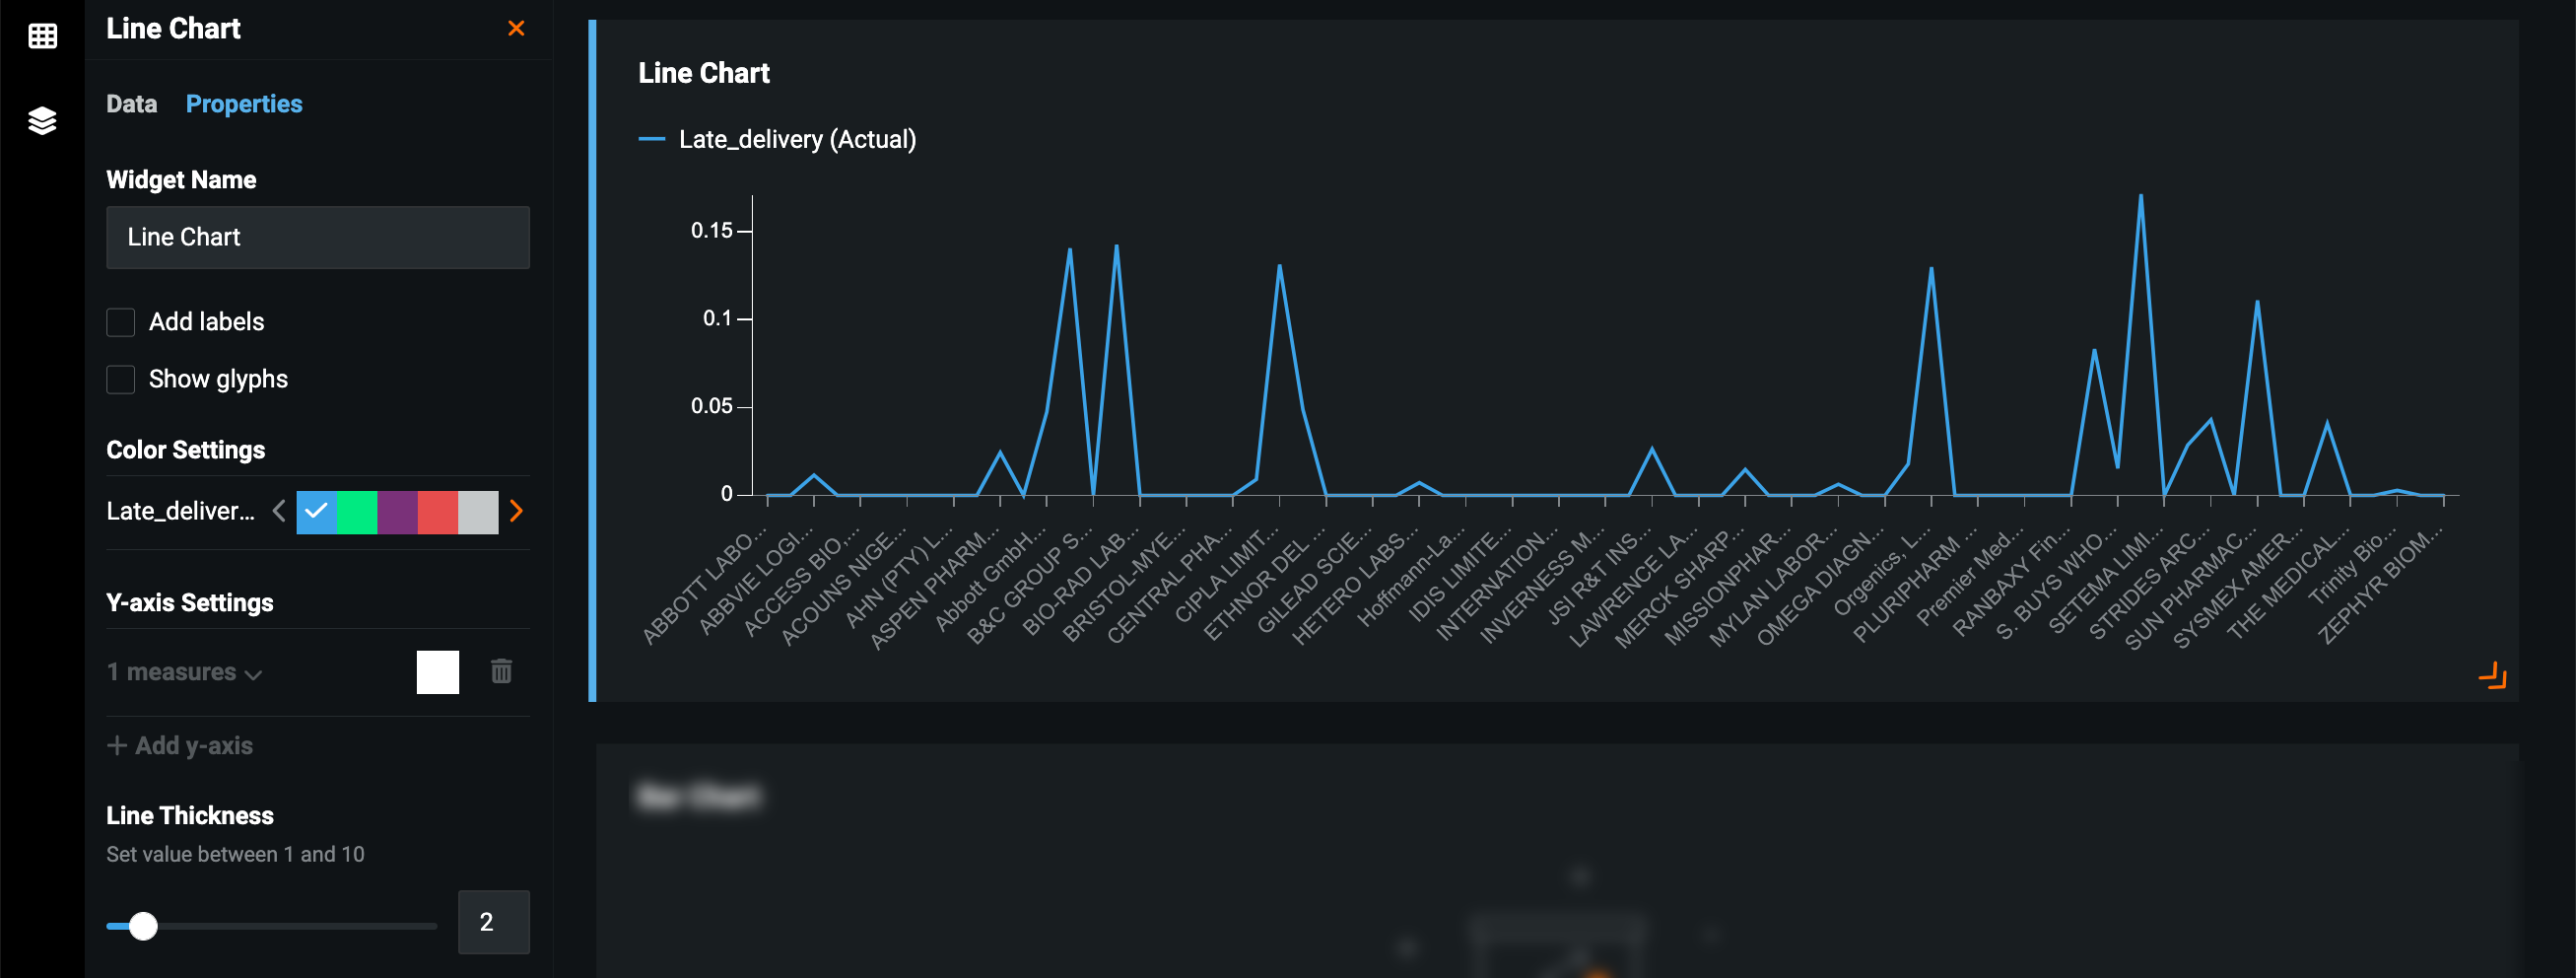
Line
Displays a Line chart for the selected features—useful for visualizing trends, understanding the distribution of your data, comparing values in larger datasets, and understanding the relationship between value sets.
On the Properties tab, customize the widget using the available parameters:
| Parameter | Description |
|---|---|
| Widget Name | Rename the widget. Replaces the text displaying the widget type. |
| Add labels | Add labels that display the value being measured above each dimension. |
| Show glyphs | Add glyphs to the line chart that highlight the value being measured above each dimension. If selected, you can choose a glyph type—a circle, square, or triangle. |
| Color Settings | Customize the color of each dimension displayed in the chart. |
| Y-axis Settings | Add a second measure to the Y-axis and specify color settings for each. Only available if more than one feature is added as a measure on the Data tab. |
| Line Thickness | Add labels that display the average value of each dimension. |
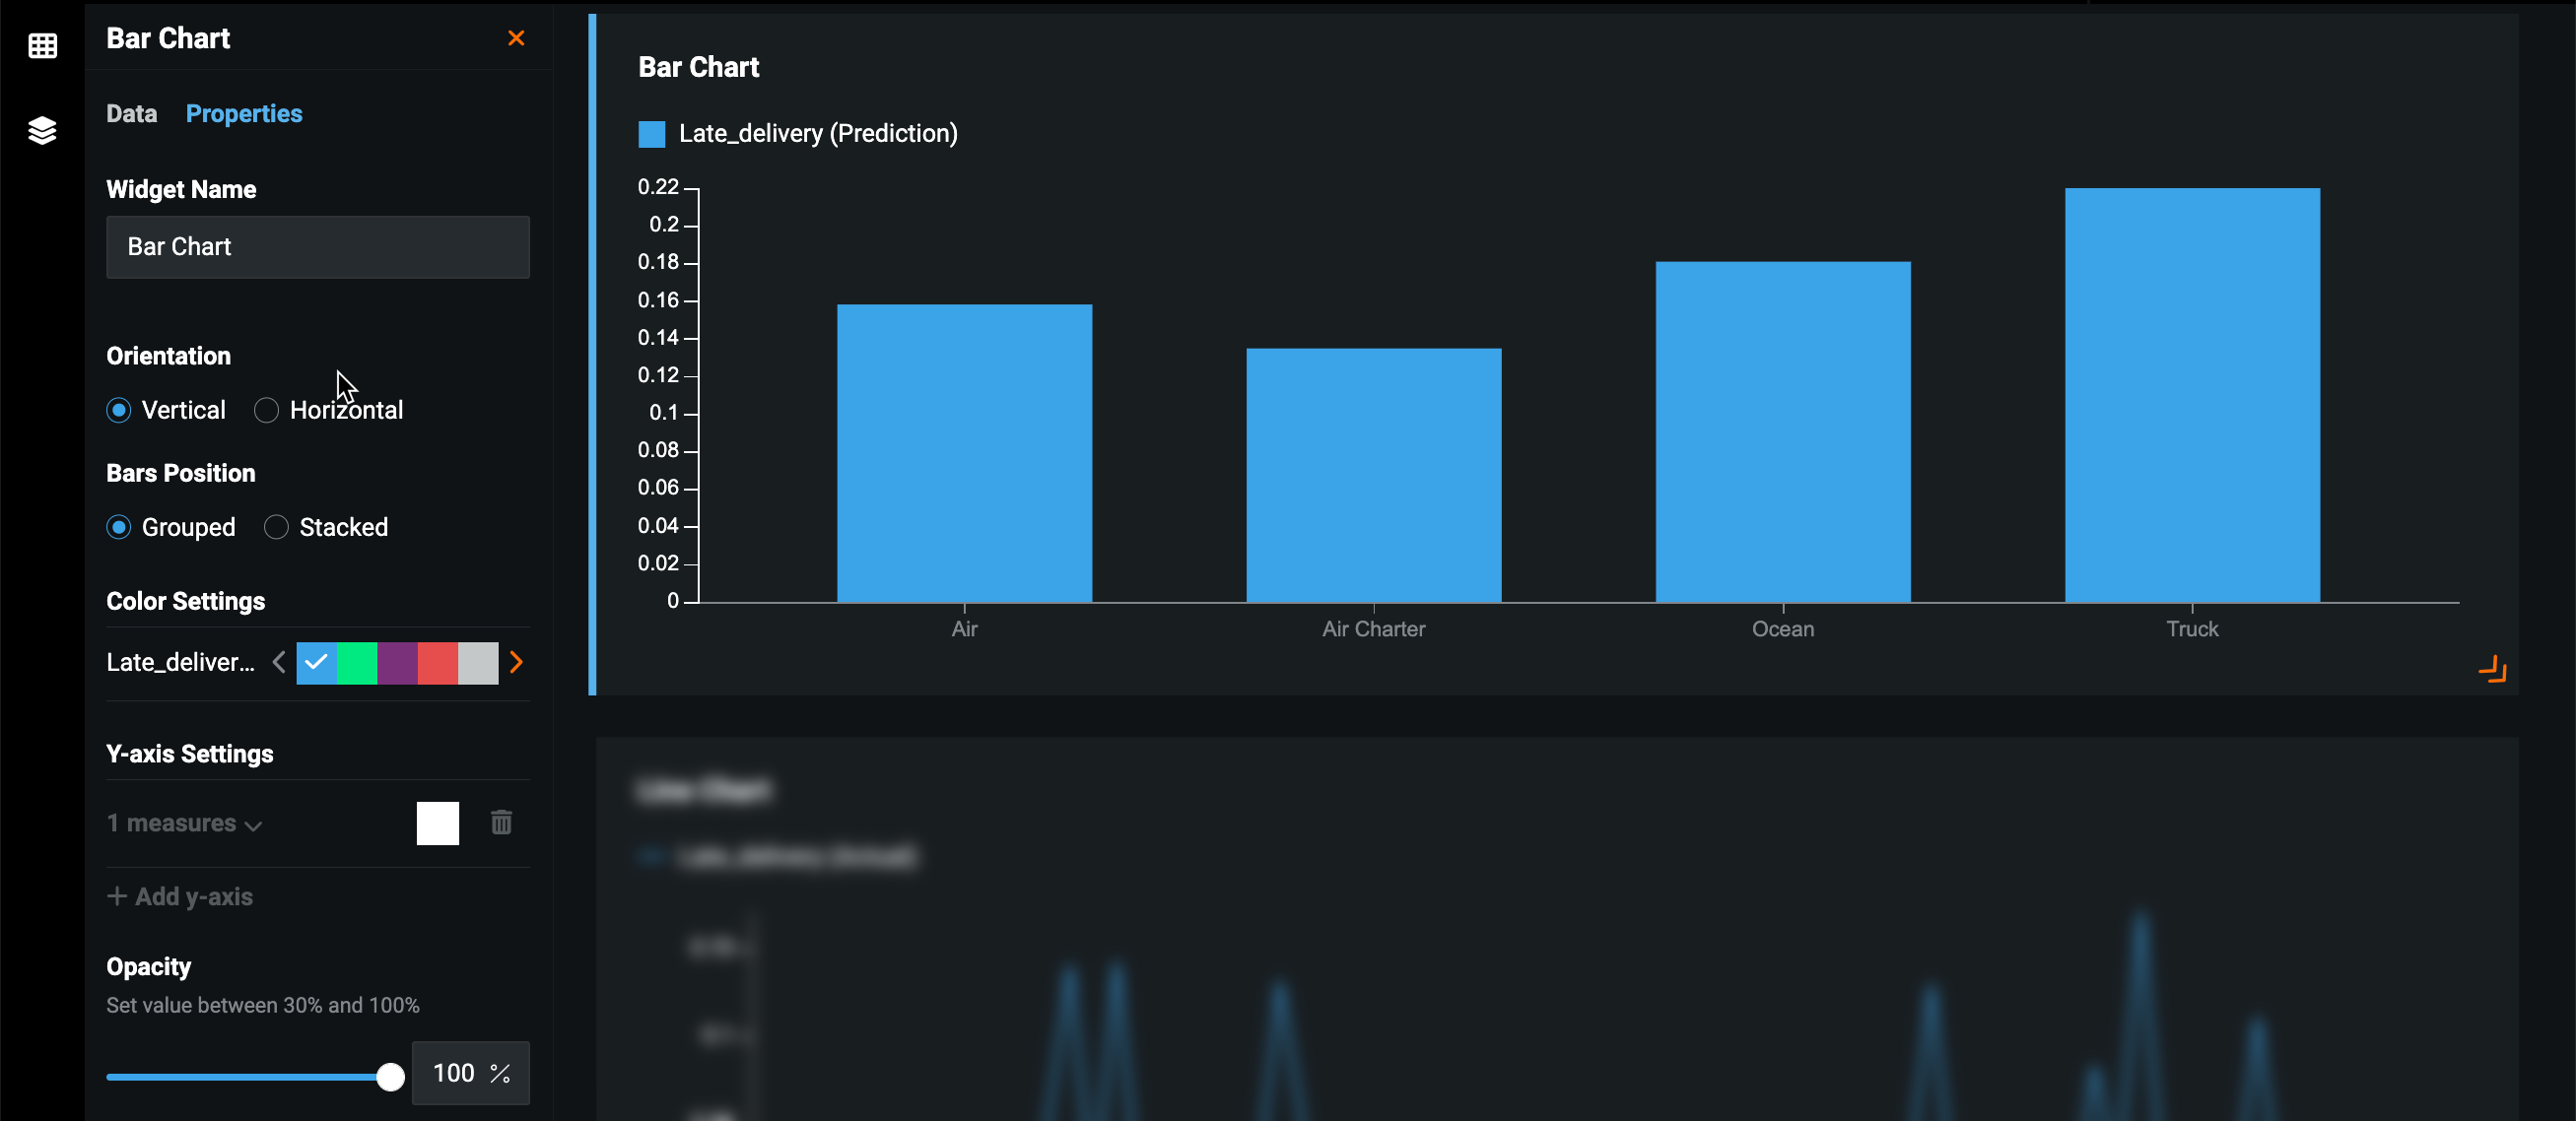
Bar
Displays a Bar chart for the selected features—useful for understanding the distribution of your data and comparing values in smaller datasets.
On the Properties tab, customize the widget using the available parameters:
| Parameter | Description |
|---|---|
| Widget Name | Rename the widget. Replaces the text displaying the widget type. |
| Orientation | Orients the charts vertically or horizontally. |
| Bars Position | Increase the width of the bars on the bar chart. |
| Color Settings | Customize the color of each dimension displayed in the chart. |
| Y-axis Settings | Add a second measure to the Y-axis and specify color settings for each. Only available if more than one feature is added as a measure on the Data tab. |
| Opacity | Control the opacity of the chart dimensions. |
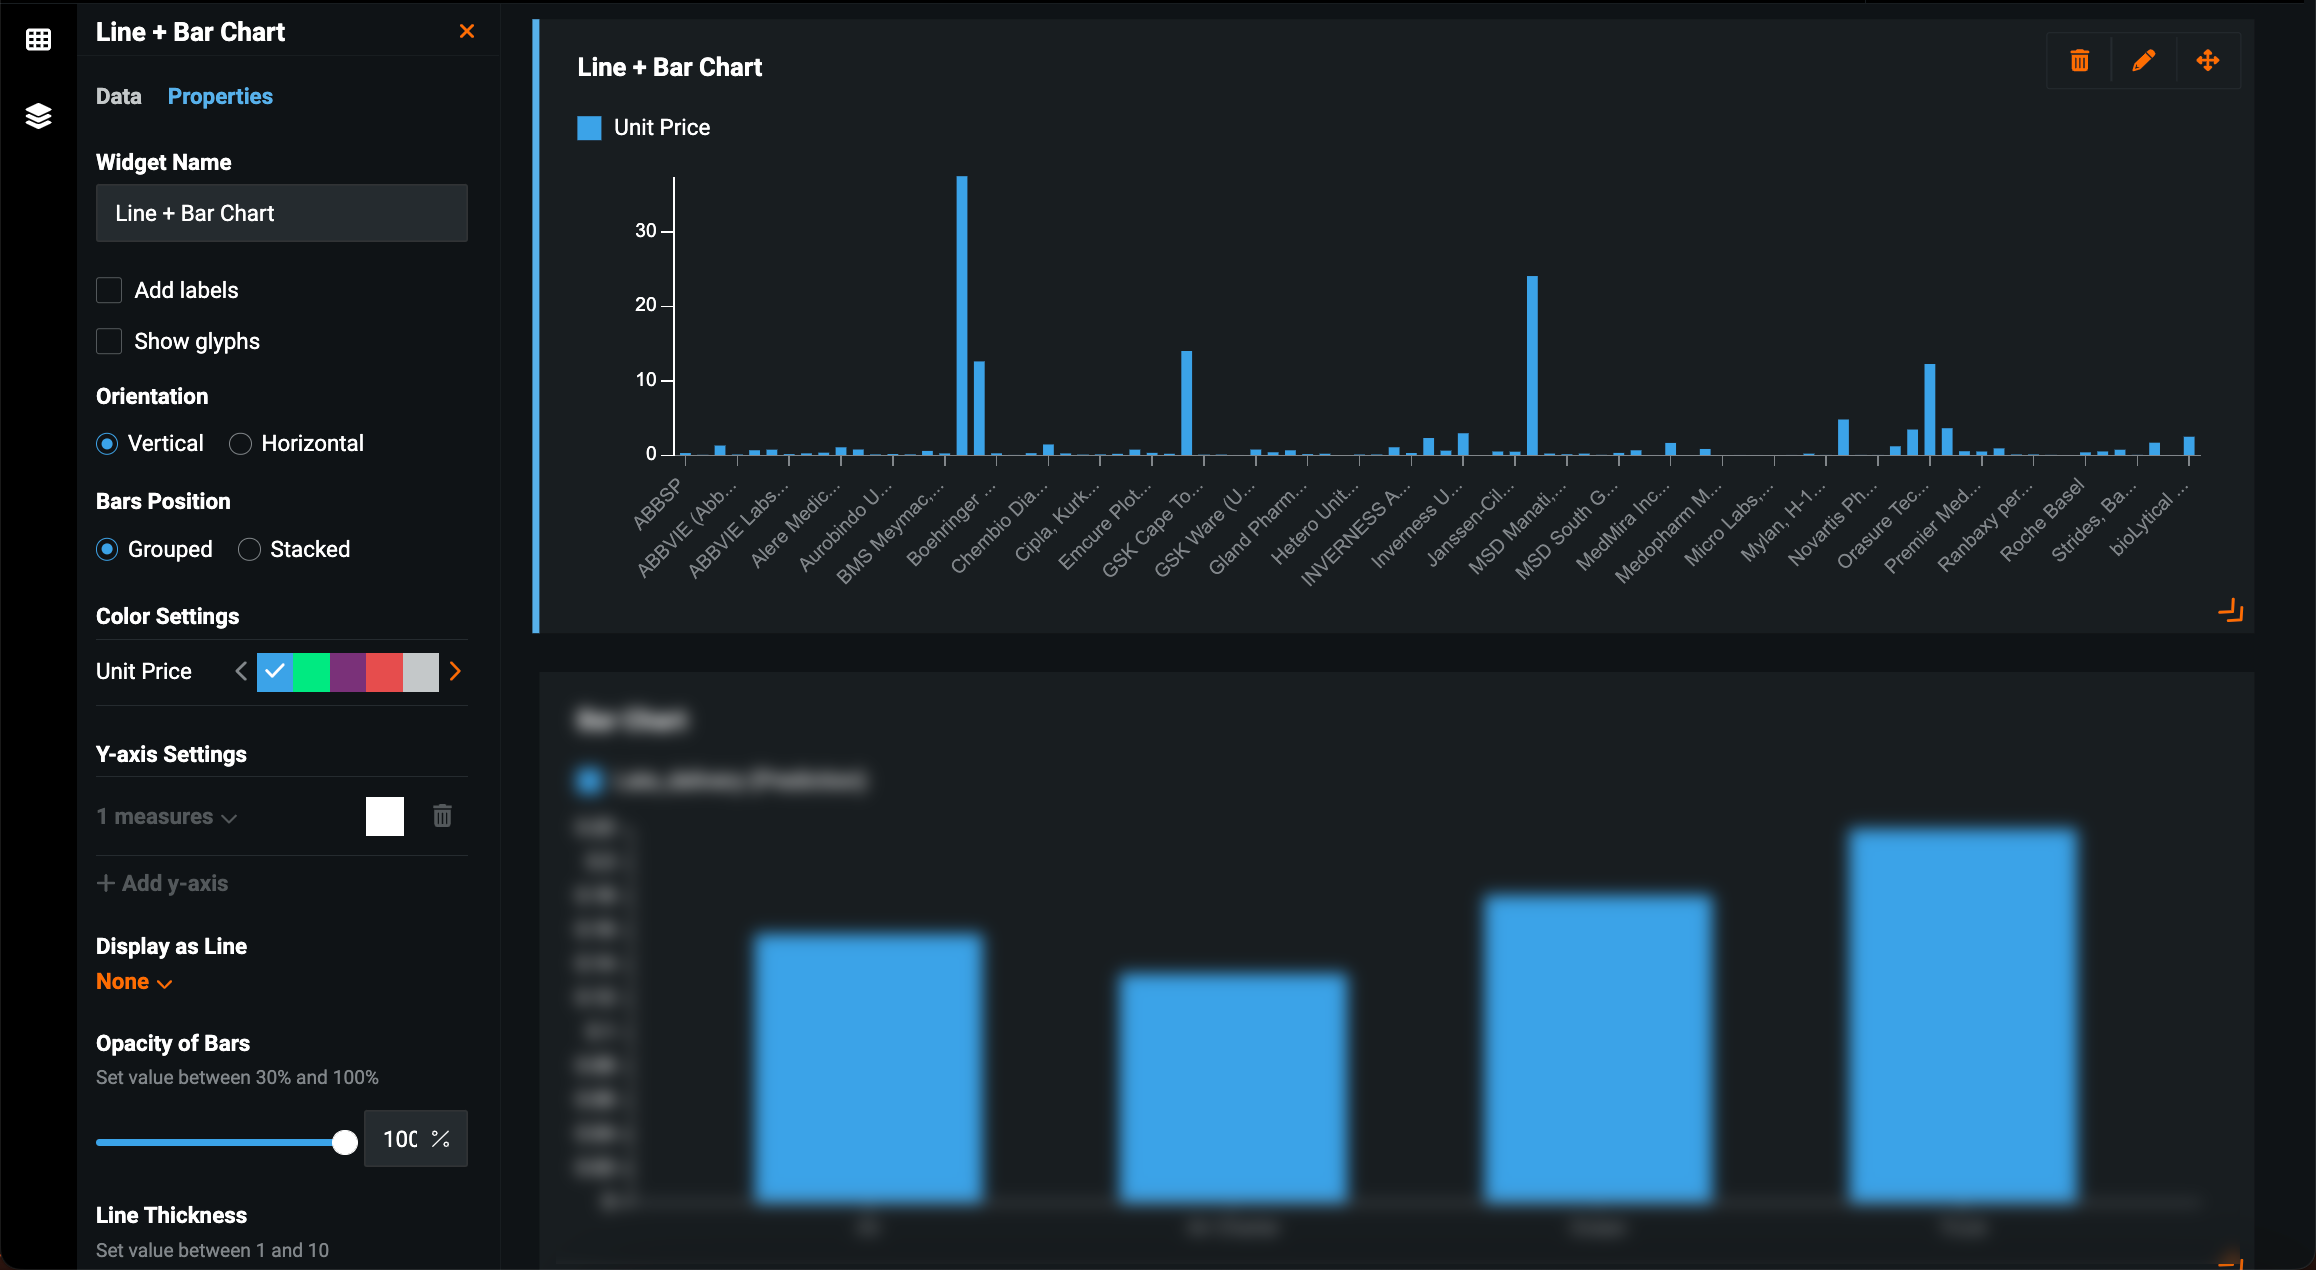
Line + Bar
Displays both a line and a bar chart for the selected features. You can toggle between the two in the open application.
On the Properties tab, customize the widget using the available parameters:
| Parameter | Description |
|---|---|
| Widget Name | Rename the widget. Replaces the text displaying the widget type. |
| Add labels | Add labels that display the value being measured above each dimension. |
| Show glyphs | Add glyphs to the line chart that highlight the value being measured above each dimension. If selected, you can choose a glyph type—a circle, square, or triangle. |
| Orientation | Orient the charts vertically or horizontally. |
| Bars Position | Increase the width of the bars on the bar chart. |
| Color Settings | Customize the color of each dimension displayed in the chart. |
| Y-axis Settings | Add a second measure to the Y-axis and specify color settings for each. Only available if more than one feature is added as a measure on the Data tab. |
| Display as Line | Add labels that display the average value of each dimension. |
| Opacity of Bars | Control the opacity of the chart dimensions. |
| Line Thickness | Add labels that display the average value of each dimension. |
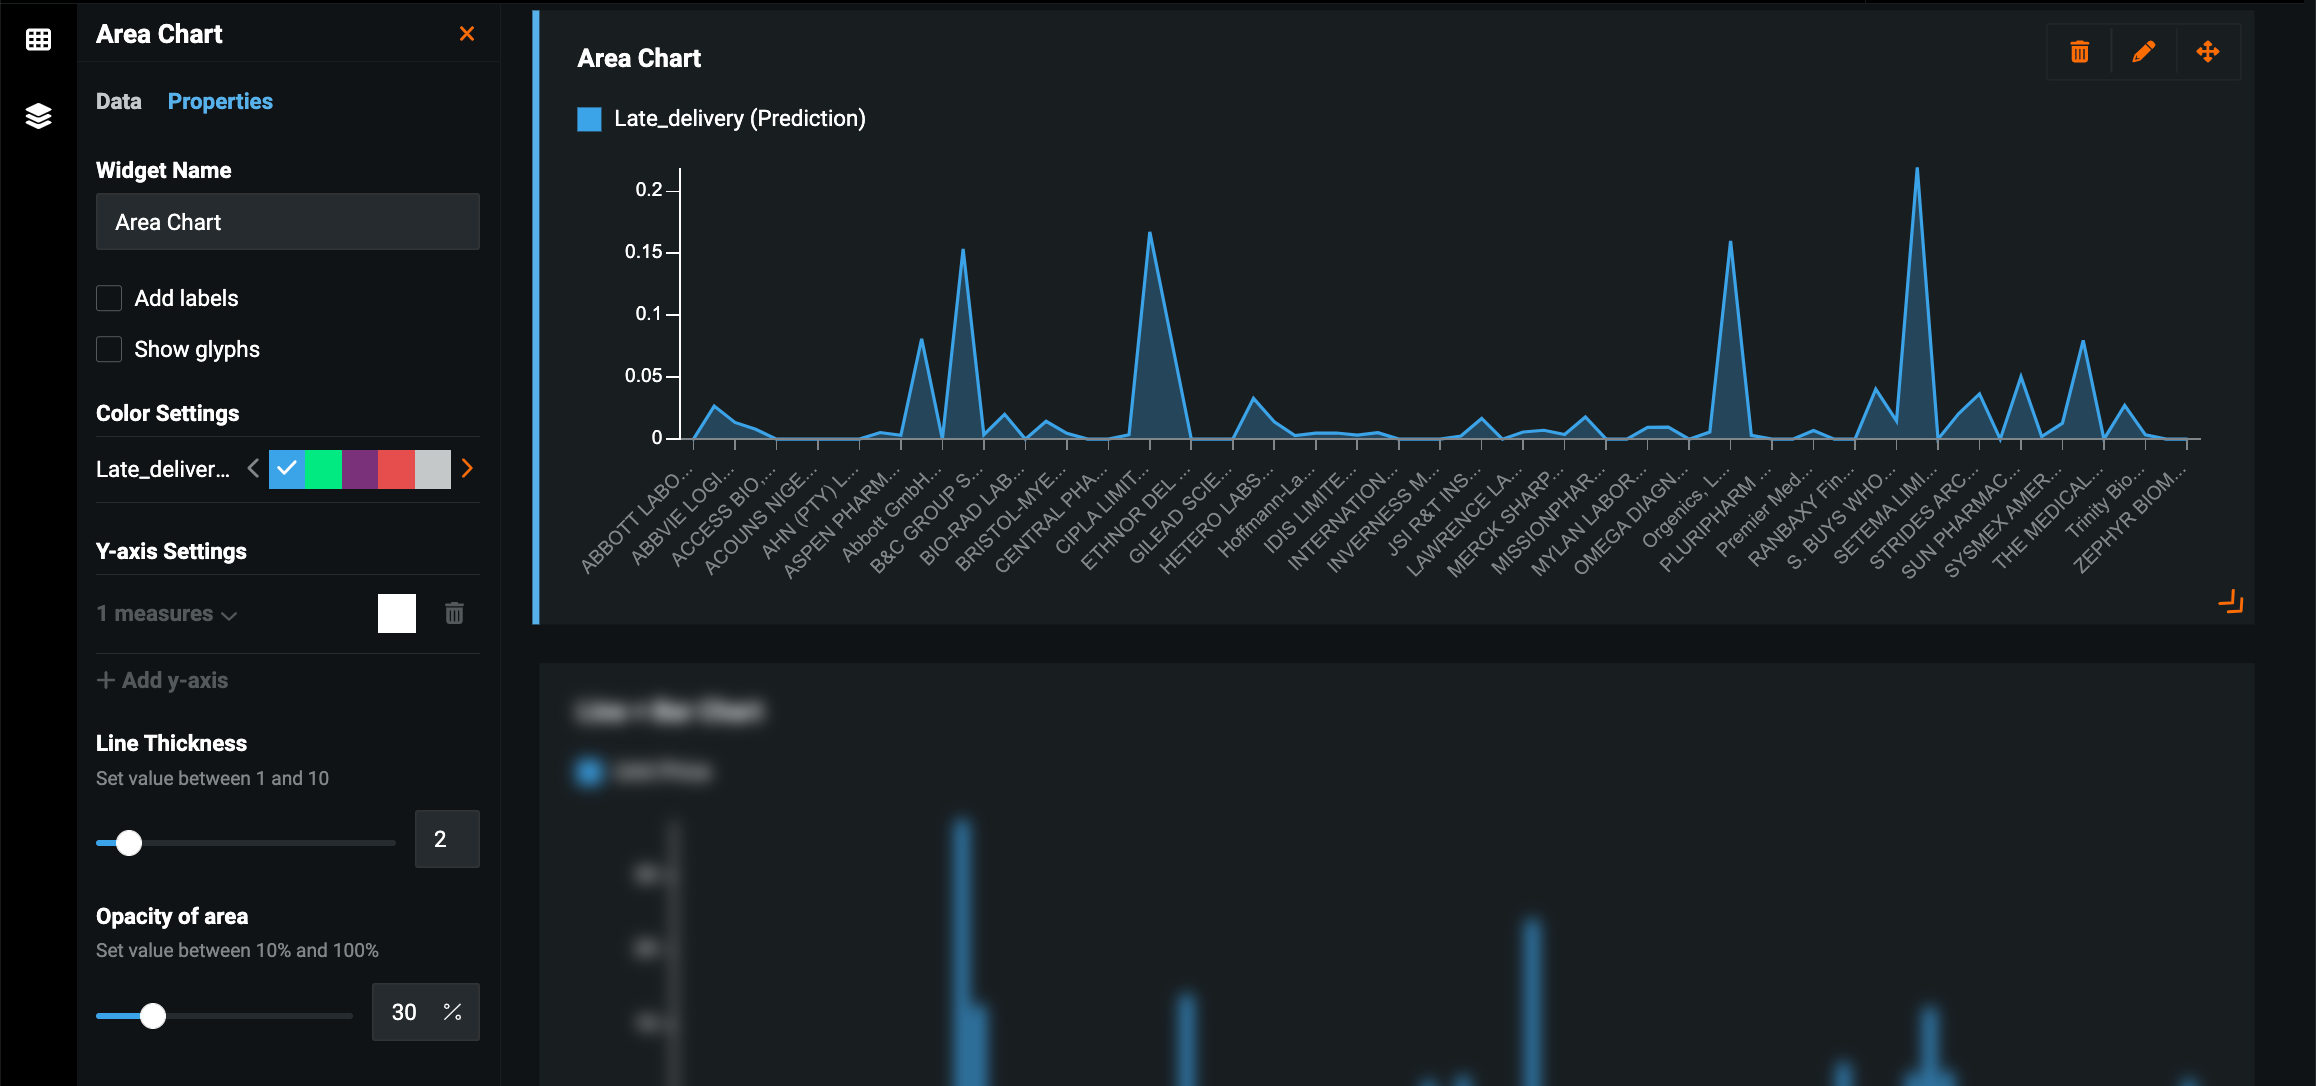
Area
Displays an Area chart for the selected features—useful for visualizing the composition of data.
On the Properties tab, customize the widget using the available parameters:
| Parameter | Description |
|---|---|
| Widget Name | Rename the widget. Replaces the text displaying the widget type. |
| Add labels | Add labels that display the value being measured above each dimension. |
| Show glyphs | Add glyphs to the line chart that highlight the value being measured above each dimension. If selected, you can choose a glyph type—a circle, square, or triangle. |
| Color Settings | Customize the color of each dimension displayed in the chart. |
| Y-axis Settings | Add a second measure to the Y-axis and specify color settings for each. Only available if more than one feature is added as a measure on the Data tab. |
| Line Thickness | Add labels that display the average value of each dimension. |
| Opacity of area | Control the opacity of the chart dimensions. |
Donut
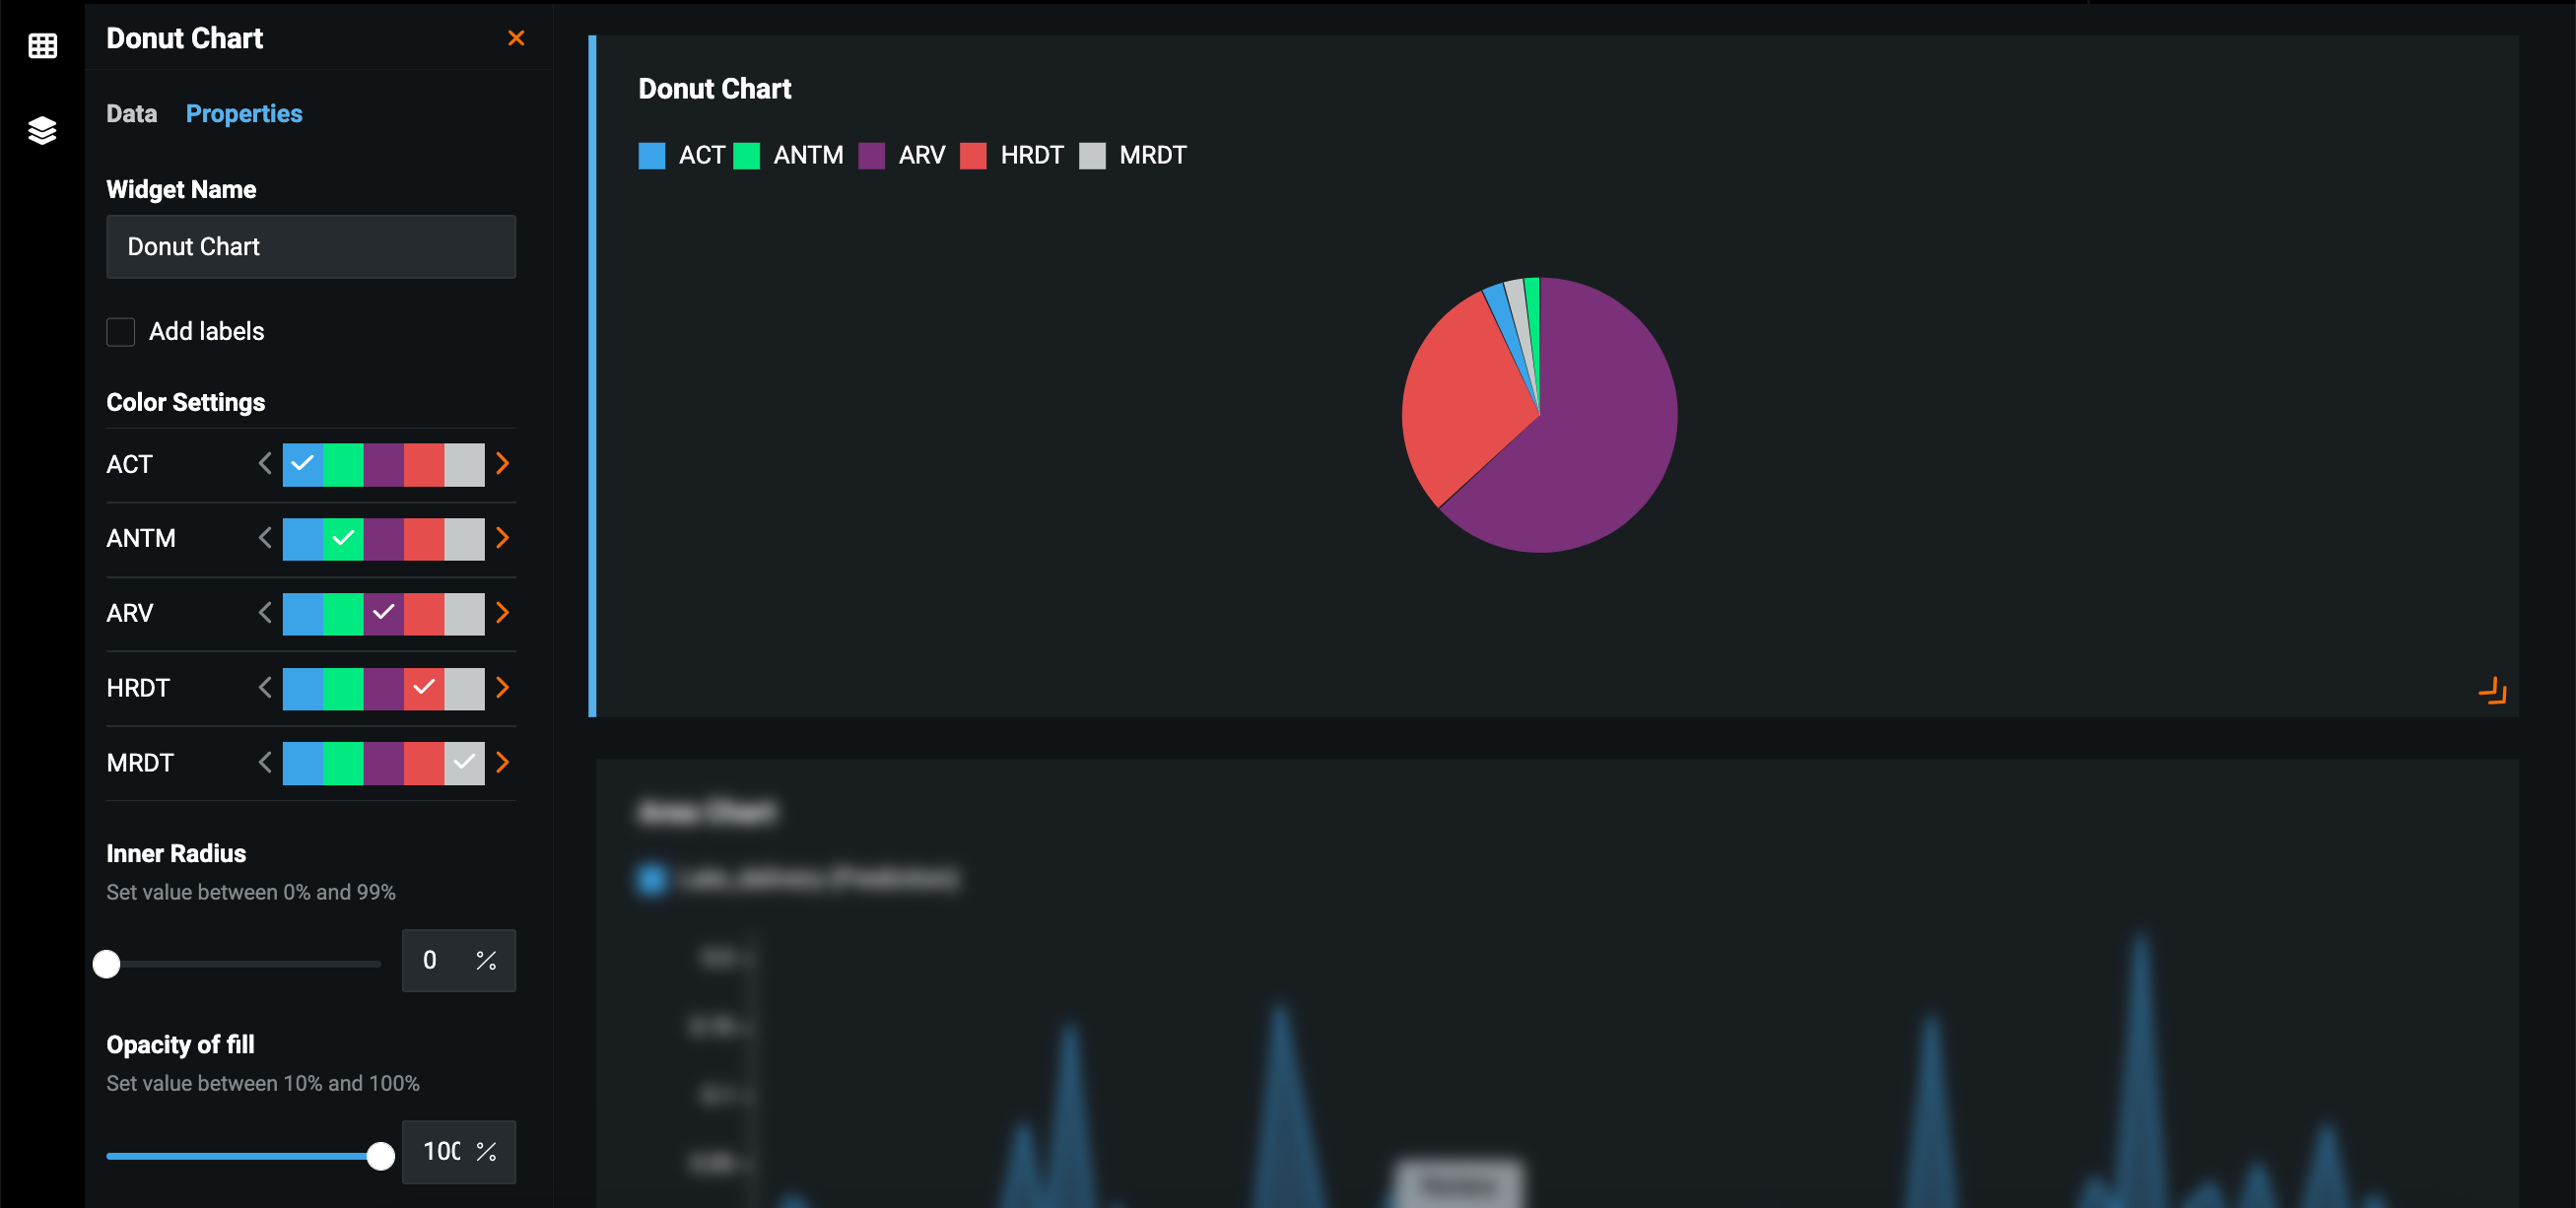
Displays a pie chart based on one dimension and one measure—useful for visualizing the composition of data, especially how individual parts compare to the whole.
On the Properties tab, customize the widget using the available parameters:
| Parameter | Description |
|---|---|
| Widget Name | Rename the widget. Replaces the text displaying the widget type. |
| Add labels | Add labels that display the average value of each dimension. |
| Color Settings | Customize the color of each dimension displayed in the chart. |
| Inner Radius | Add negative space to the center of the donut chart. |
| Opacity of fill | Control the opacity of the chart dimensions. |
Single value
By default, displays the average value of a selected numeric feature. Using the Set constraints functionality, you can configure the widget to show the count of distinct, min, and max, and the sum of the values of the feature.
On the Properties tab, customize the widget using the available parameters:
| Parameter | Description |
|---|---|
| Widget Name | Rename the widget. Replaces the text displaying the widget type. |
| Assign categories to values | Create categories that group values by range. |


