Usage tab
After deploying a model and making predictions in production, monitoring model quality and performance over time is critical to ensure the model remains effective. This monitoring occurs on the Data Drift and Accuracy tabs and requires processing large amounts of prediction data. Prediction data processing can be subject to delays or rate limiting.
Prediction Tracking chart
On the left side of the Usage tab is the Prediction Tracking chart, a bar chart of the prediction processing status over the last 24 hours or 7 days, tracking the number of processed, missing association ID, and rate-limited prediction rows. Depending on the selected view (24-hour or 7-day), the histogram's bins are hour-by-hour or day-by-day.
| Chart element | Description | |
|---|---|---|
| 1 | Select time period | Selects the Last 24 hours or Last 7 days view. |
| 2 | Use log scaling | Applies log scaling to the Prediction Tracking chart for deployments with more than 250,000 rows of predictions. |
| 3 | Time of Receiving Predictions Data (X-axis) |
Displays the time range (by day or hour) represented by a bin, tracking the rows of prediction data received within that range. Predictions are timestamped when a prediction is received by the system for processing. This "time received" value is not equivalent to the timestamp in service health, data drift, and accuracy. For DataRobot prediction environments, this timestamp value can be slightly later than prediction timestamp. For agent deployments, the timestamp represents when the DataRobot API received the prediction data from the agent. |
| 4 | Row Count (Y-axis) |
Displays the number of prediction rows timestamped within a bin's time range (by day or hour). |
| 5 | Prediction processing categories | Displays a bar chart tracking the status of prediction rows:
|
How does prediction rate limiting work?
The Usage tab displays the number of prediction rows subject to your organization's monitoring rate limit. However, rate limiting only applies to prediction monitoring, all rows are included in the prediction results, even after the rate limit is reached. Processing limits can be hourly, daily, or weekly—depending on the configuration for your organization. In addition, a megabyte-per-hour limit (typically 100MB/hr) is defined at the system level. To work within these limits, you should span requests over multiple hours or days.
Large-scale monitoring prediction tracking
For a monitoring agent deployment, if you implement large-scale monitoring, the prediction rows won't appear in this bar chart; however, the Predictions Processing (Champion) delay will track the pre-aggregated data.
To view additional information on the Prediction Tracking chart, hover over a column to see the time range during which the predictions data was received and the number of rows that were Processed, Rate Limited, or Missing Association ID:
Prediction and actuals processing delay
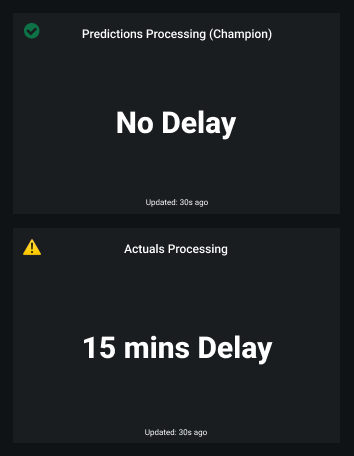
On the right side of the Usage tab are the processing delays for Predictions Processing (Champion) and Actuals Processing (the delay in actuals processing is for ALL models in the deployment):
The Usage tab recalculates the processing delays without reloading the page. You can check the Updated value to determine when the delays were last updated.
Timeliness indicators for predictions and actuals
Timeliness indicators can reveal if the prediction or actuals upload frequency meets the standards set by your organization. Deployments have several statuses to define the general health of a deployment, including Service Health, Data Drift, and Accuracy. These statuses are calculated based on the most recent available data. For deployments relying on batch predictions made in intervals greater than 24 hours, this method can result in a Gray / Unknown status on the Prediction Health indicators in the deployment inventory. If timeliness is enabled for a deployment, the health indicators retain the most recently calculated health status, presented along with timeliness status indicators to reveal when they are based on old data. You can determine the appropriate timeliness intervals for your deployments on a case-by-case basis.
Enable timeliness tracking
You can configure timeliness tracking on the Usage > Settings tab for predictions and actuals. After enabling tracking, you can define the timeliness interval frequency based on the prediction timestamp and the actuals upload time separately, depending on your organization's needs.
To enable and define timeliness tracking, from the Deployments page, do either of the following:
-
Click the deployment you want to define timeliness settings for, and then click Usage > Settings.
-
Click the Gray / Not Tracked icon in the Predictions Timeliness or Actuals Timeliness column to open the Usage Settings page for that deployment.
From the Usage Settings tab, configure the timeliness settings.
View timeliness indicators
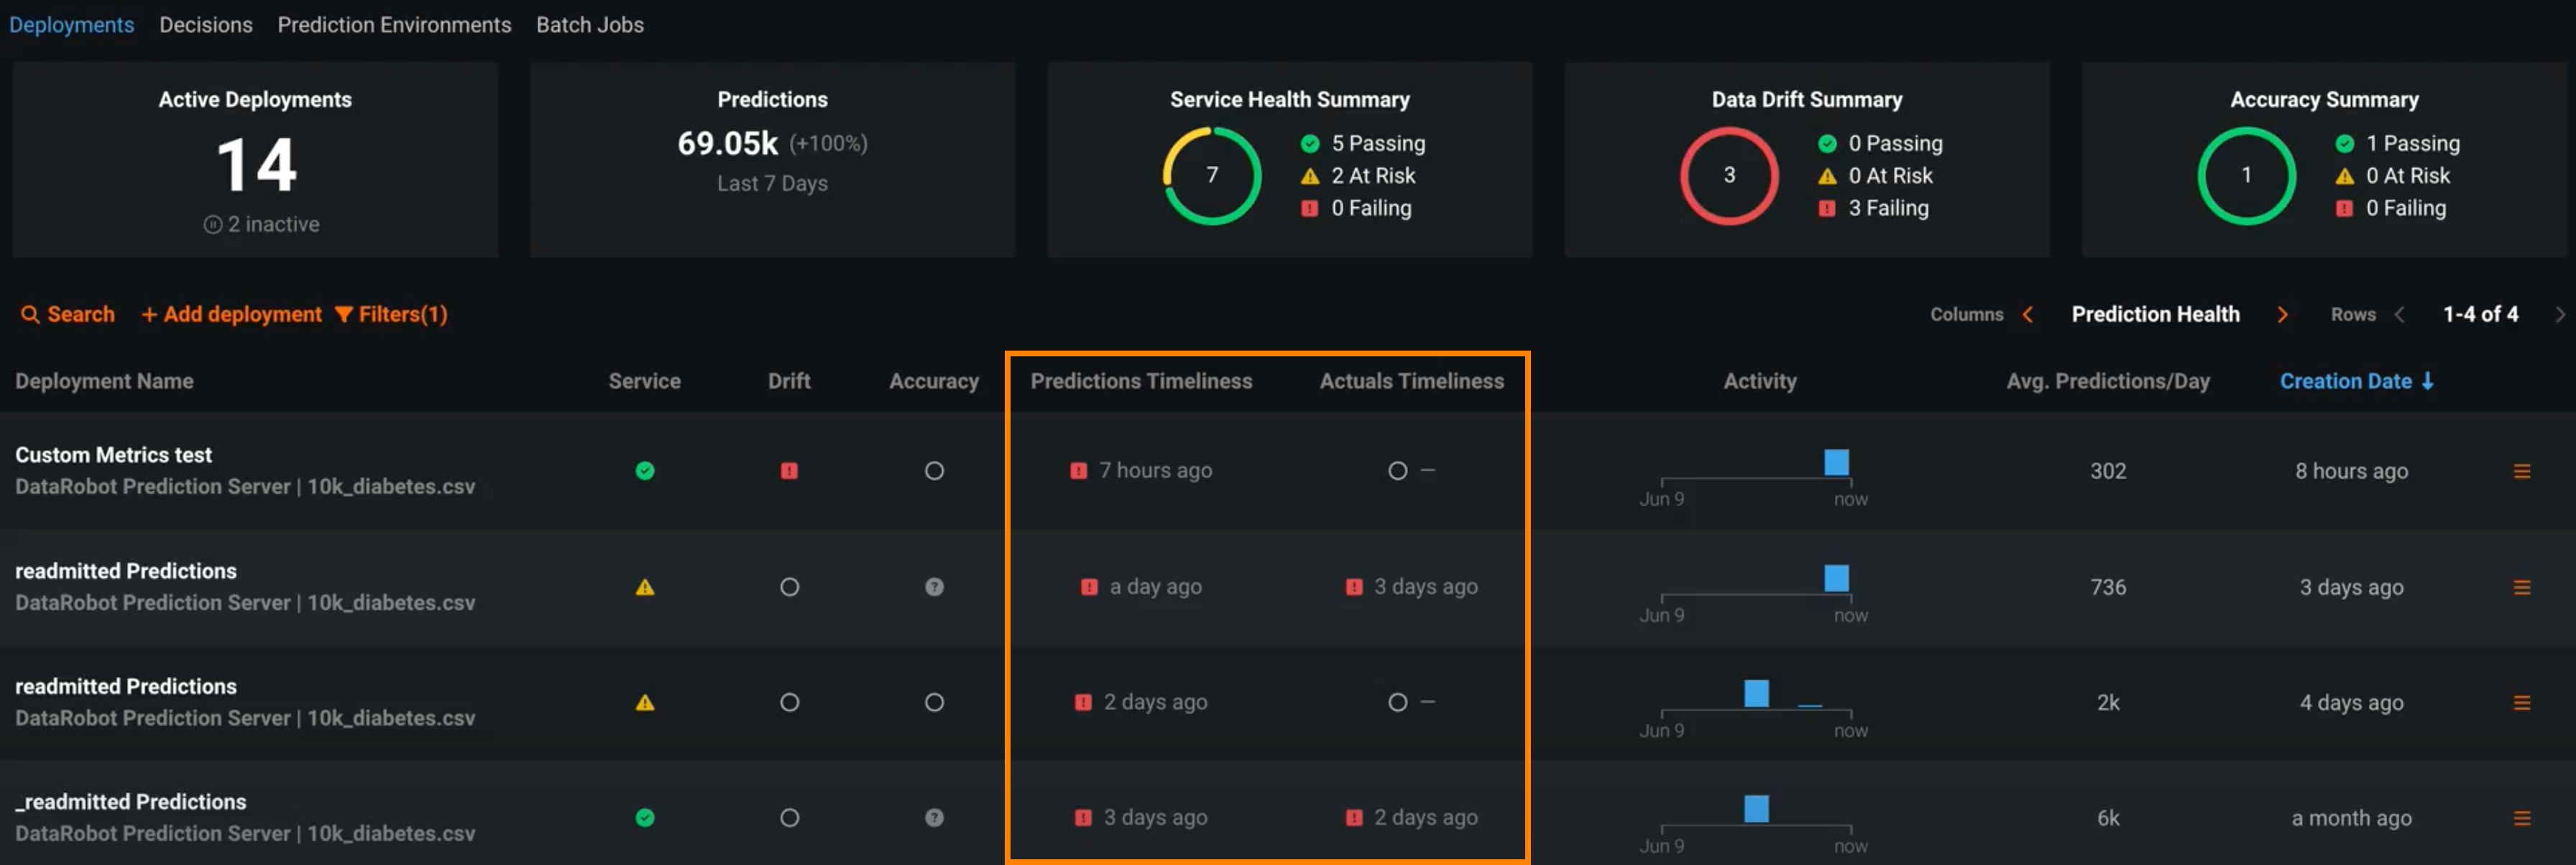
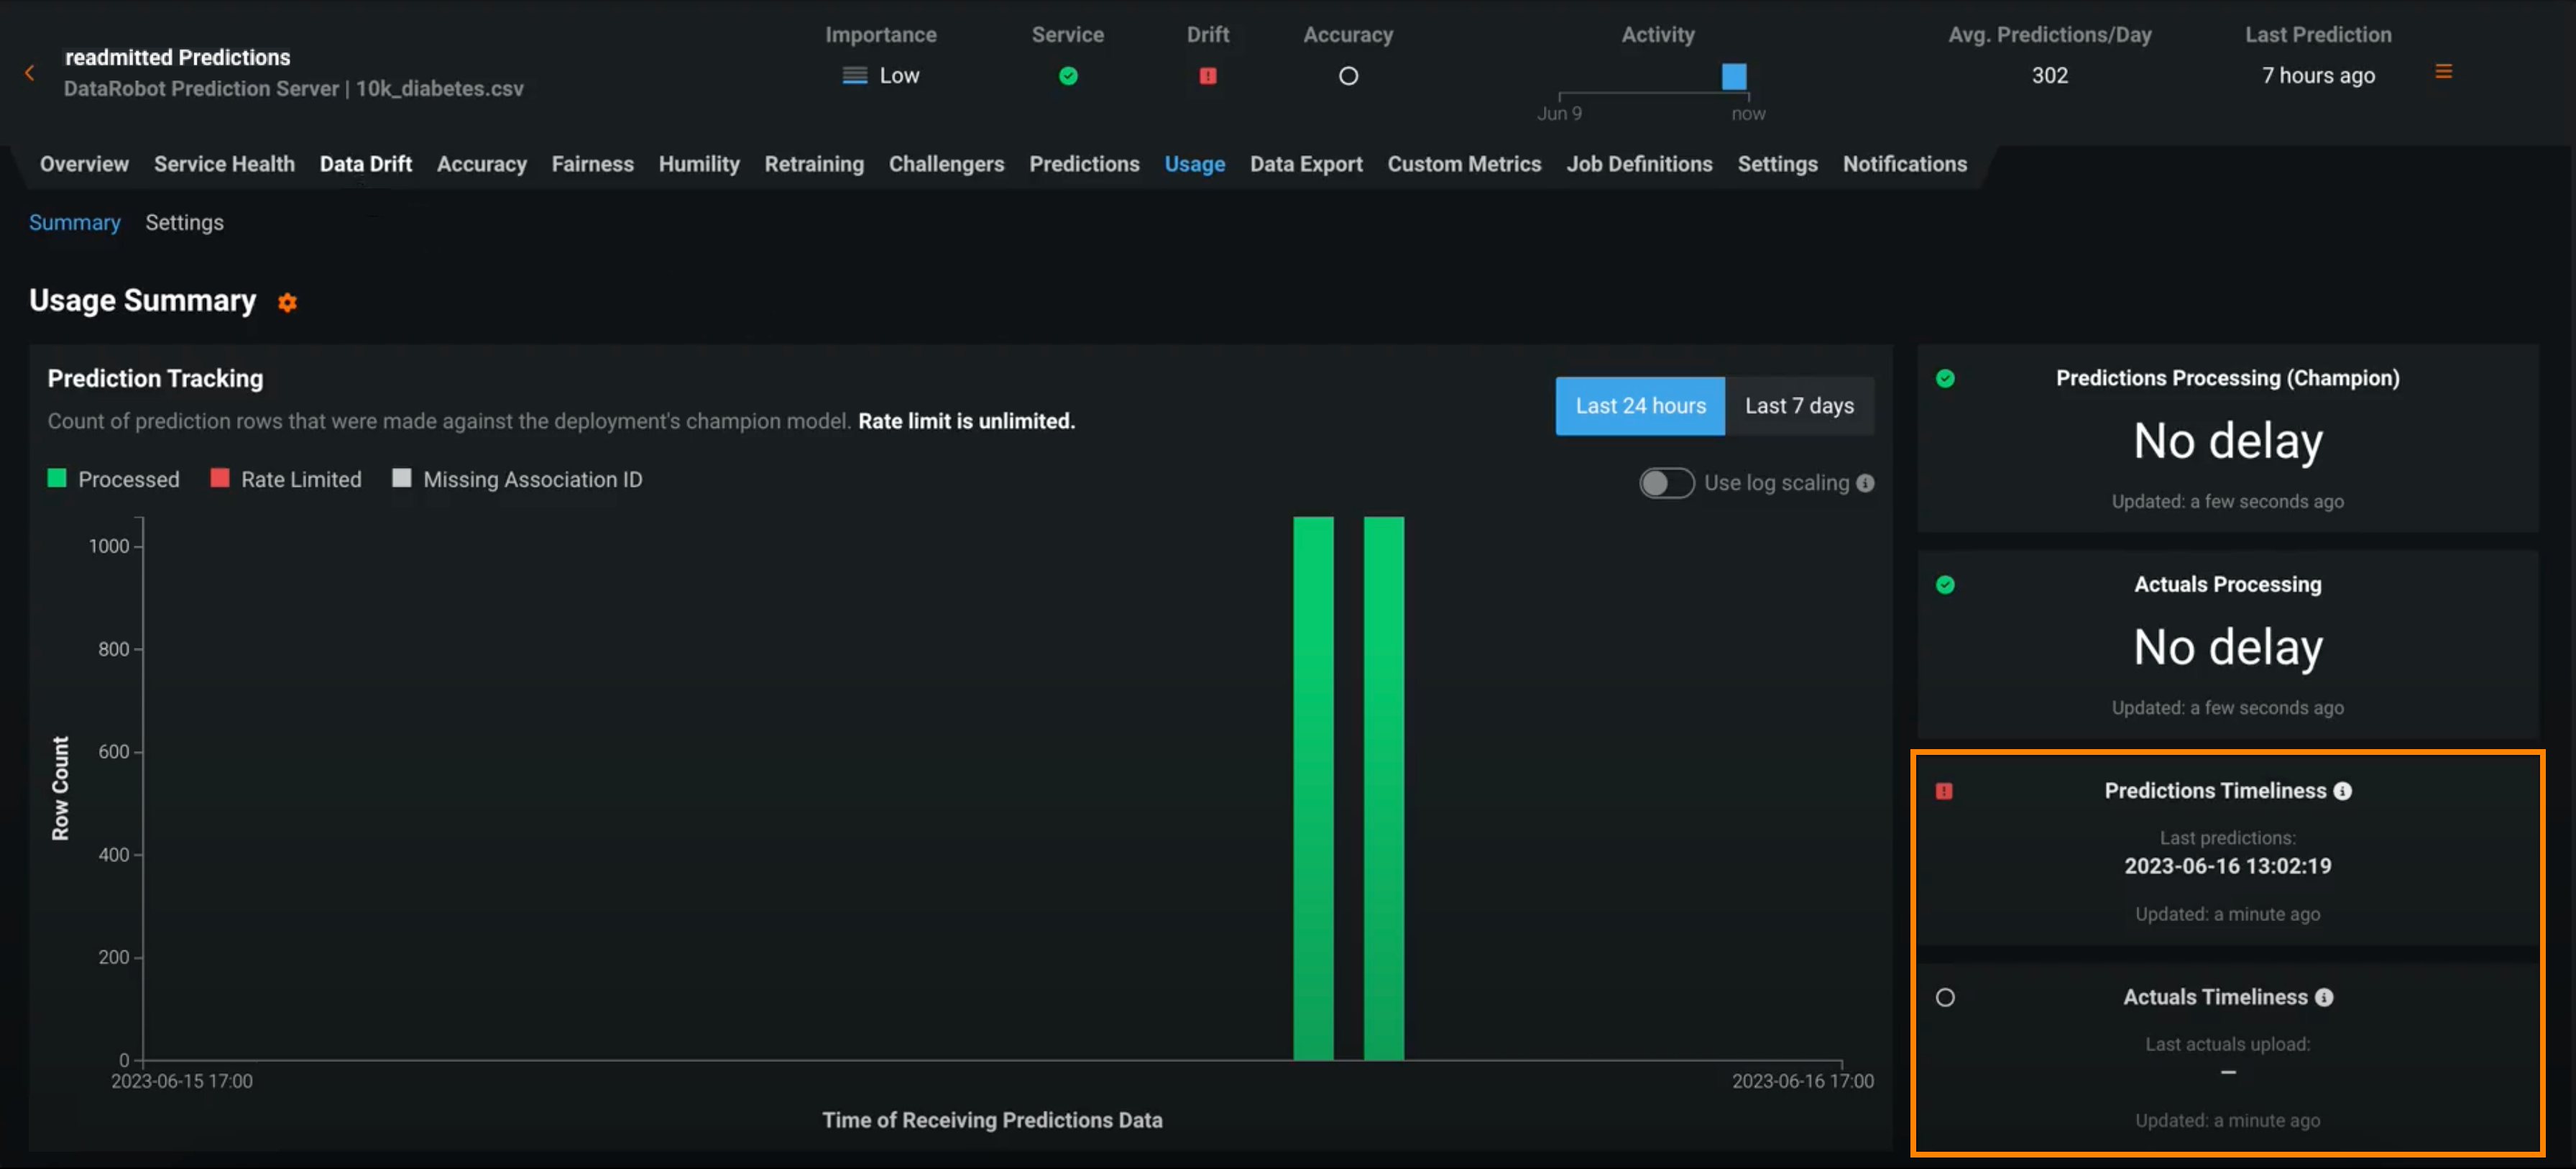
Once you've enabled timeliness tracking on the Usage > Settings tab, you can view timeliness indicators on the Usage tab and in the Deployments inventory:
Note
In addition to the indicators on the Usage tab and the Deployments inventory, when a timeliness status changes to Red / Failing, a notification is sent through email or the channel configured in your notification policies.
View timeliness status events
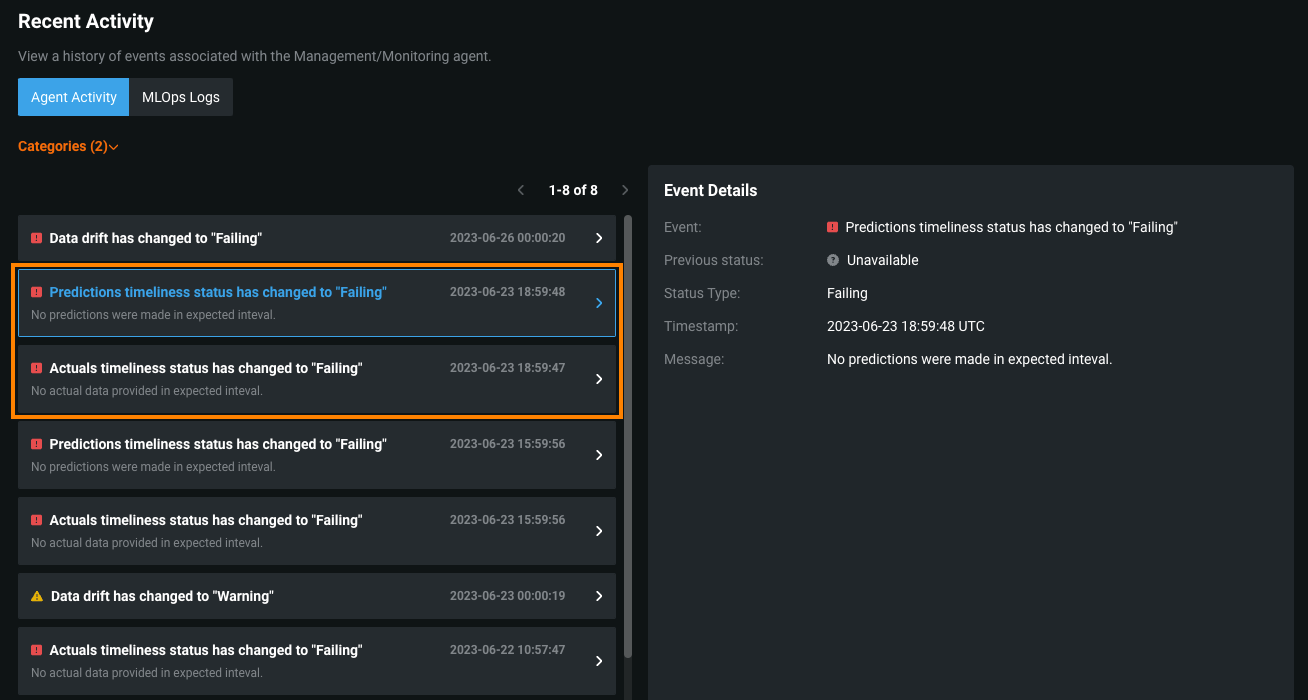
On the Service Health tab, under Recent Activity, view timeliness status events in the Agent Activity log:
Filter the deployment inventory by timeliness
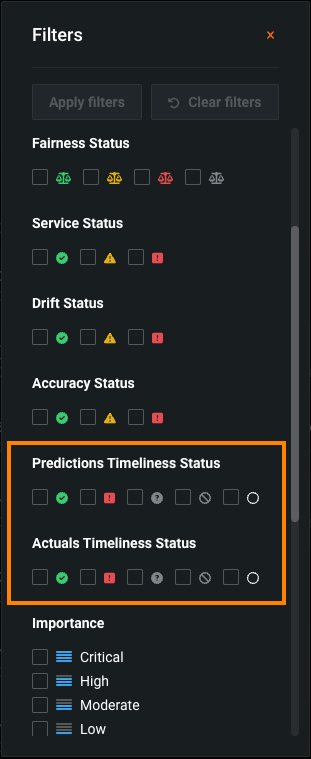
In the Deployments inventory, click Filters to apply Predictions Timeliness Status and Actuals Timeliness Status filters by status value:
