Prediction Explanations for clusters
Note
Clustering Prediction Explanations are only available when using the XEMP-based methodology. Additionally, they are not available for time series clustering models.
Clustering lets you explore your data by grouping and identifying natural segments, capturing latent behavior that's not explicitly captured by a column in the dataset. Using Prediction Explanations with clustering, you can uncover the factors that most contribute to model outcomes. For example, targeted marketing strategies can be built using clustering models to assign logical clusters to data samples. With that insight, you can develop models that comply with regulations, easily explain the clustering model outcomes to stakeholders, and identify high-impact factors to help focus their business strategies.
Interpret Prediction Explanations
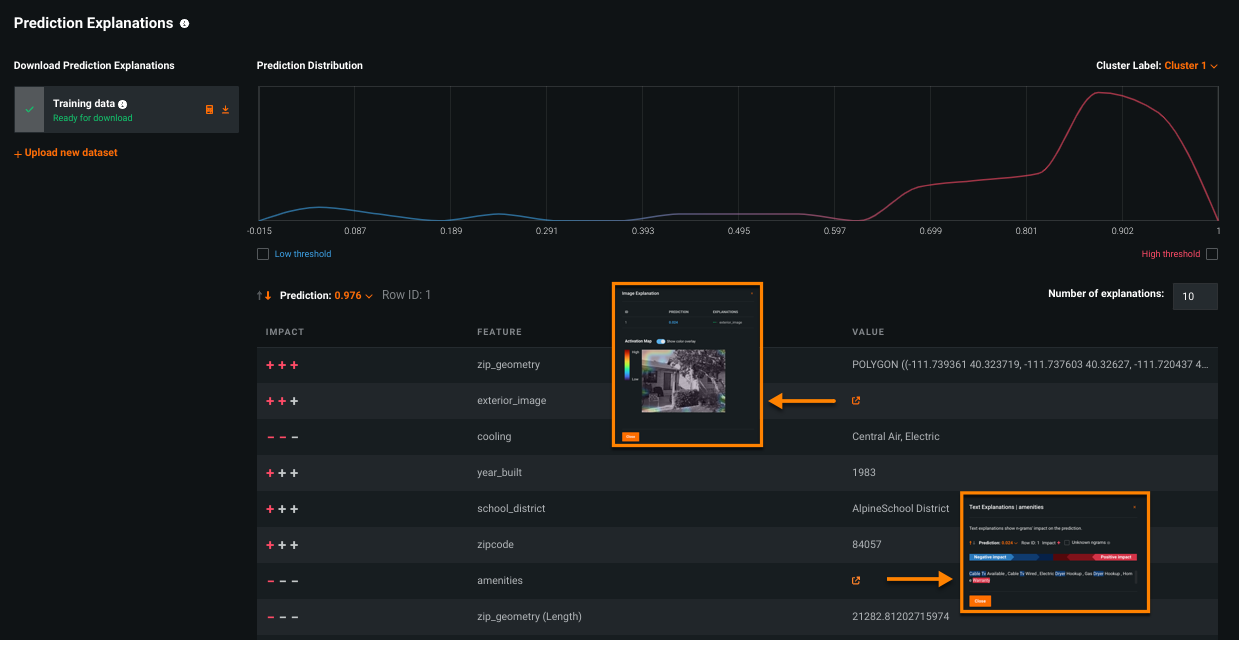
Prediction Explanations for clustering models work very much like they do with multiclass projects, including support for text and image explanations. This section describes generating explanations and then working with the results that are unique to clustering.
Select a cluster
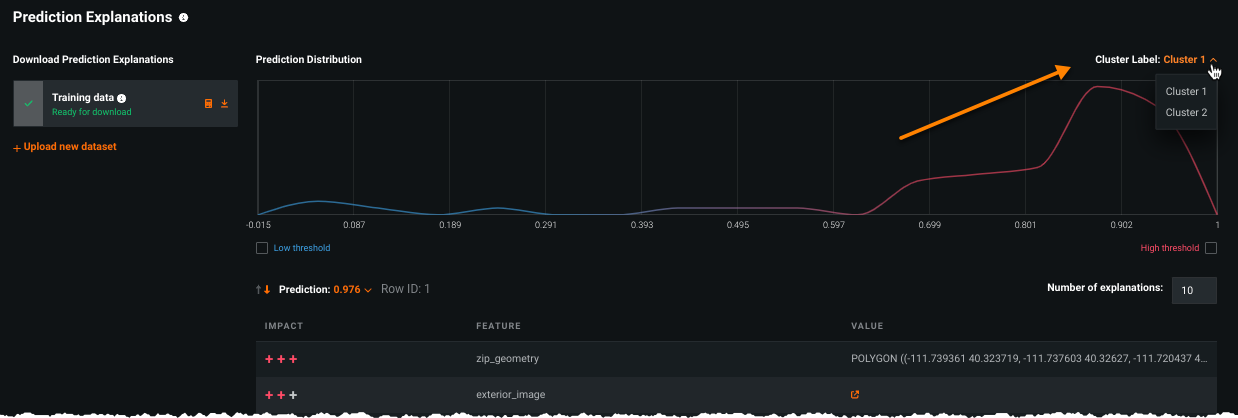
Use the Cluster Label dropdown to choose which cluster to display. These labels map to the labels shown in the Cluster Insights tab. That is, if you change a cluster name there, the change is reflected in the Cluster Label selector dropdown.
DataRobot calculates the prediction distribution for up to 20 clusters—those that contain the most data. Explanations are available for all clusters via download.
Note
If you select a cluster and see a message indicating that the preview data is missing, this indicates that the model was built before the feature was enabled. Because DataRobot computes prediction distribution during training, you must recompute explanations to see the preview.
Calculate explanations
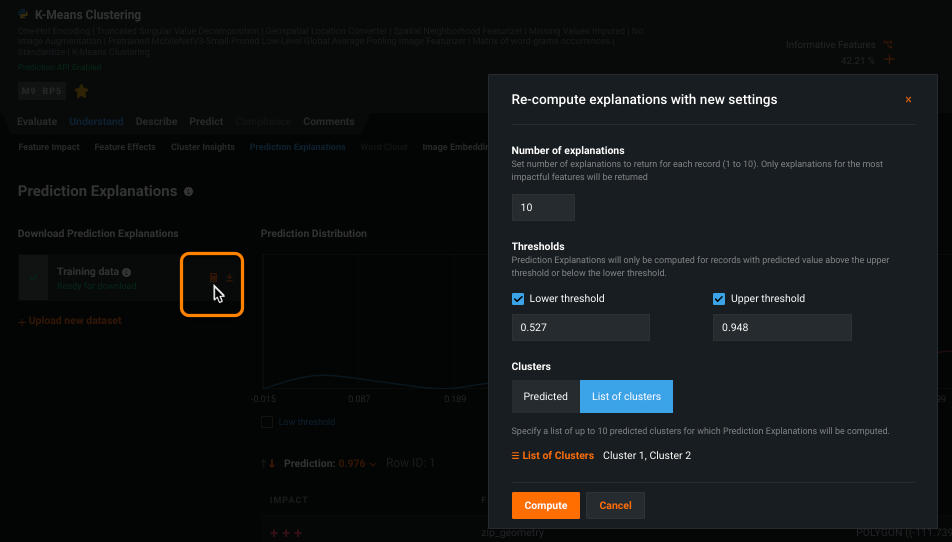
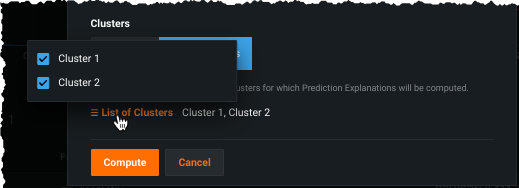
You can calculate explanations either for the full training dataset or for new data. The process is generally the same as for classification and regression projects, with a few clustering-specific differences (because DataRobot calculates explanations separately for each class). Clicking the calculator opens a modal that controls which clusters explanations are generated for:
Set the number of explanations and the thresholds. Use the Clusters setting to control the method—either Predicted or List of clusters—for selecting which clusters are used in explanation computation. By default (if a method is not set), Prediction Explanations explain the top predicted cluster for a row.
Predicted
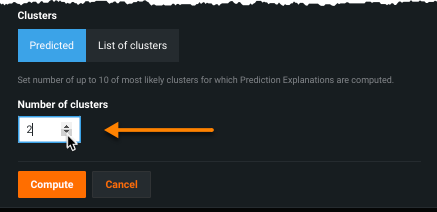
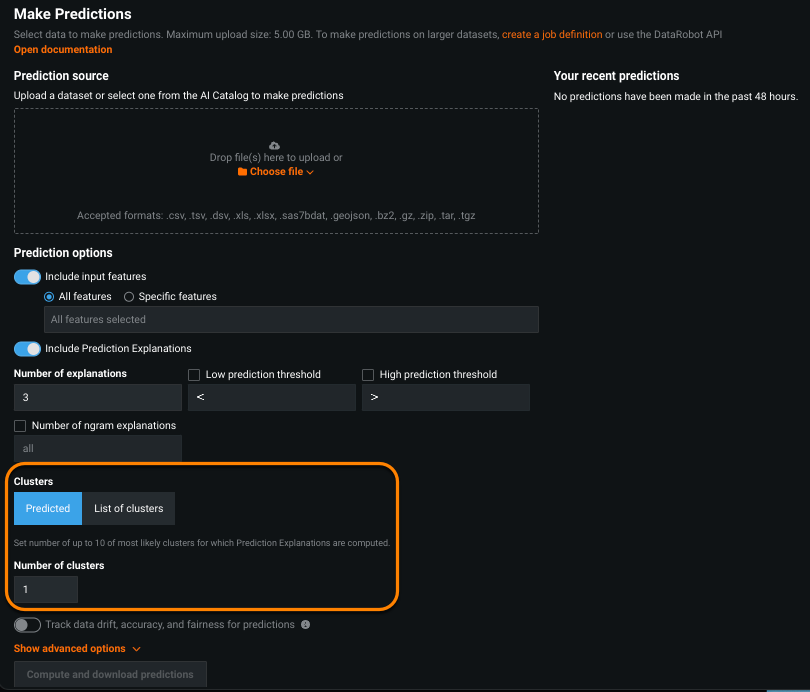
Choose Predicted to view explanations for a specified number of cluster(s). When selected, you are prompted to enter the number of clusters to compute predictions for, between 1 and the number of existing clusters (maximum 10):
The clusters returned are those ranked with the highest probabilities for a given feature. In other words, if you request five predicted clusters, DataRobot returns, for each row and ranked by probability, each predicted cluster assignment with accompanying reasons.
List of clusters
Choose List of clusters to view explanations for only specific clusters. Click on List of clusters to activate a cluster-selection dialog.
Download explanations
Once computed, click the download icon (![]() ) to export all of a dataset's predictions and corresponding explanations in CSV format. The output can be interpreted in the same way as the multiclass export, with clusters instead of classes.
) to export all of a dataset's predictions and corresponding explanations in CSV format. The output can be interpreted in the same way as the multiclass export, with clusters instead of classes.
Explanations from a deployment
When you calculate predictions from a deployment (Deployments > Predictions > Make Predictions), DataRobot adds the Predicted and List of clusters fields to the options modal. These work in the same way as described above.

