Multiseries modeling
Note
See these additional date/time partitioning considerations.
Multiseries modeling allows you to model datasets that contain multiple time series based on a common set of input features. In other words, a dataset that could be thought of as consisting of multiple individual time-series datasets with one column of labels indicating which series each row belongs to. This column is known as the series ID column.
Tip
If DataRobot detects multiple series, consider whether you want multiseries or multiseries with segmented modeling. If you select segmented modeling, DataRobot creates individual sets of models for each segment (and then automatically combines the best model per segment to create a single deployment). If you don't select segmented modeling, DataRobot creates, from the dataset, a single model representing all series.
DataRobot automatically suggests using multiseries modeling when the chosen primary date feature is not eligible for single-series modeling. This can happen, for example, because timestamps are not unique or are irregularly spaced. By grouping the rows based on the series ID feature, DataRobot knows to treat each group as a separate time series.
The following sample, perhaps sales from multiple stores in a chain, uses the column store_id as a common identifier for multiseries modeling:
store_id, timestamp, target, input1, …
1          2017-01-01,  1.23, AC,
1          2017-01-02,  1.21, AB,
1          2017-01-03,  1.21, BC,
1          2017-01-04,  1.23, B,
...
2          2017-01-03,  1.22, CBC,
2          2017-01-04,  1.23, AAB,
2          2017-01-05,  1.22, CA,
2          2017-01-06,  1.23, BAC,
...
Some features of DataRobot multiseries modeling:
-
DataRobot automatically detects when multiseries is required and provides a multiseries modeling workflow, described below. Because there are cases when either there are multiple series or DataRobot did not detect a series, you can also manually assign a series ID.
-
With regression projects, you can aggregate the target value across all series in the multiseries project, letting DataRobot automatically generate lags and statistics for the aggregated column. Enable this functionality in Advanced options > Time Series.
-
The Feature Over Time and Accuracy Over Time visualizations provide insights based on an individual series in the dataset or multiple series in one view.
Feature derivation with multiseries
When DataRobot runs the feature derivation process on a multiseries dataset, it determines the minimum and maximum dates to apply globally during derivation by selecting the longest 10 series from the dataset and using the minimum and maximum dates of these series. Any data to be transformed that falls outside these dates is not used in the modeling process. This is true even if the applied dates were previously selected as part of partitioning. As a result, it effectively appears as if the data was truncated.
To ensure that the entire global history is used for feature transformations and modeling, be certain to have at least one series that contains dates across the full date range of the training dataset.
See below for a sample use case using multiseries modeling. Also see the multiseries-specific sampling explanation.
Set the series ID
Once you have selected to use time series modeling, DataRobot runs heuristics to detect whether the data has multiple rows with the same timestamp. If it detects multiple series, the multiseries workflow initiates:
-
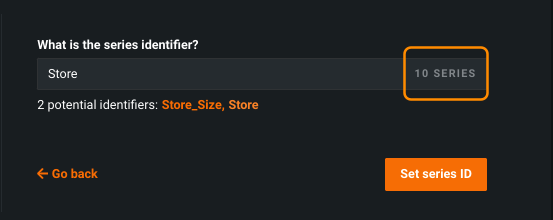
Select a series identifier, either by clicking on one that DataRobot identified (1) or manually entering a valid column name of a known series (2).
-
Once selected, verify the number of unique instances and click Set series ID:
Or, select Go back to return to time-aware modeling type selection.
-
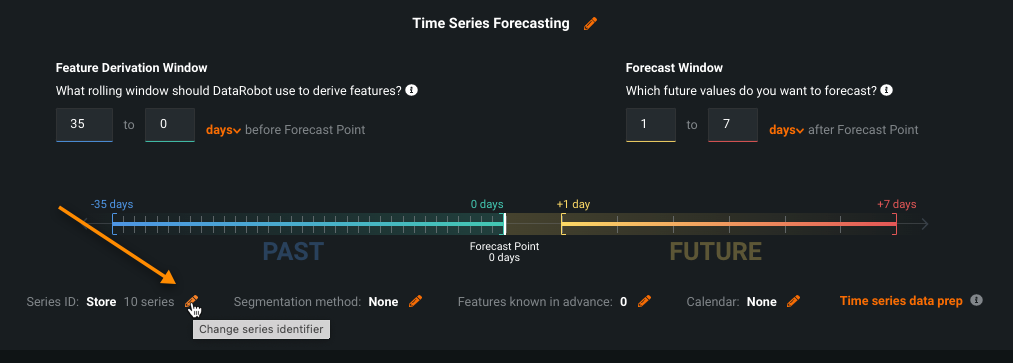
If you want to modify the series ID, click the series ID pencil icon to return to the series ID selection screen:
Or, change the identifier from the Time Series tab of Advanced options:
-
When the series ID is correct:
- Return to the time series configuration steps to complete project setup.
- (Optional) Set up segmented modeling.
When model building is complete, evaluate your models with time series-specific visualizations available from the Leaderboard. For multiseries modeling, these provide insights based on an individual series in the dataset or multiple series in a single view.
Set the series ID through advanced options
If DataRobot does not detect multiple series in your data, you can manually set a series ID and, and if it is valid, can use multiseries modeling. To manually set a series ID:
-
After selecting time series modeling, expand the Show Advanced options link and select the Time Series tab.
-
In the segment prompting to Use multiple time series, click Set a Series ID:
-
Manually enter a valid series identifier.
-
When validated, return to the time series configuration steps to complete project setup.
Validation criteria for series ID
For a feature to qualify as a series ID, it must meet the following criteria:
- It cannot be the target or primary date/time feature.
- The variable type must be numeric, categorical, or text.
- Complex float values with decimals are not allowed.
- Timestamps within each series group should be unique.
- Timestamps within each group should have regular time steps.
Multiseries calendars
Calendar files contain a list of events relevant to your dataset that DataRobot then uses to derive time series features. The Accuracy Over Time chart provides a visualization of calendar events along the timeline, including hover help identifying series-specific events.
For multiseries projects, a third column in the calendar file identifies the series to which the event applies. If left blank, it applies to all series in the dataset. For example, the calendar file below lists US holidays, some of which apply to individual states and some to all states:
date,holiday,state
2019-01-01,New Year's Day
2019-01-18,Lee-Jackson Day,Virginia
2019-01-21,Martin Luther King, Jr. Day
2019-02-18,Washington's Birthday
2019-03-17,Evacuation Day,Massachusetts
2019-03-18,Evacuation Day (Observed),Massachusetts
2019-05-27,Memorial Day
2019-07-04,Independence Day
2019-09-02,Labor Day
.
.
.
Note that the entry in the ID (third) column must match the dataset's series identifier column. If you change the series ID for the dataset, you must re-upload the calendar file. See the full list of calendar criteria here.
Sampling in multiseries projects
Time series uses sampling to ensure a manageable, optimized modeling dataset. Multiseries projects, however, require a somewhat different approach to ensure that there is enough data for series evaluation. As a result, insights (Series Insights, Accuracy Over Time, and Forecast vs Actuals) in multiseries projects are not sampled, although sample data is used for modeling and model evaluation.
Consider the following example, where:
- the base dataset is ~4.2M rows
- there are ~160 different series
- the series covers very long date ranges
When run as an OTV project, 100% of rows are used in the modeling process. When run as a time series project, the dataset grows by roughly 62x to 260M rows. This is because each series is treated separately and all forecast distances (within the forecast window) must be included for the specified training window. That results in the following numbers (based on the forecast distance):
| Forecast distance | Derived rows | Rows used | % of total |
|---|---|---|---|
| OTV (FD is N/A) | 4,184,841 | 4,184,841 | 100% |
| 1-5 | 13,030,580 | 3,498,680 | 26.85% |
| 1-10 | 26,061,160 | 3,493,940 | 13.41% |
| 1-100 | 260,611,600 | 3,010,900 | 1.16% |
In the end, the amount of data used for the OTV and multiseries projects was similar (once sampling was applied). That is, multiseries started with about 70-80% as many total rows as OTV but the derivation process added many new columns, triggering size limits.
With multiseries, the effect is that in the end there can be very few samples of data from each series. That percentage of data is picked randomly from each series, giving the blueprint only a “glimpse” of each series to build models with. In contrast, OTV doesn't distinguish between series--the series ID column is just another feature for the model to learn from. OTV models, as a result, are able to learn from all of the data from each series.
If you find that your dataset and project settings lead to excessive sampling levels, try reconfiguring the project or modeling approach. This can be accomplished, for example, by splitting very long forecast windows into smaller segments and creating a DataRobot project for each segment. Data can additionally be segmented in multiseries projects into similar clusters for datasets with many series.
Alternatively, you can reduce the number of columns used or columns that are unlikely to be useful as lagged features by excluding them from derivation. Finally, consider the length of your training set. Reduction in the duration of the training data to exclude the oldest data can both increase modeling accuracy and reduce sampling on the dataset.
Multiseries use case
Predicting sales and comparing stores:
A large chain store wants to create a forecast to correctly order inventory and staff stores with the needed number of people for the predicted store volume. An analyst managing the stores uses DataRobot to build time series models that predict daily sales. First, she looks at the distribution of sales across time to get a sense of the trend. Because there is a lot of data, to review and verify that the data is correct before modeling she uses the date range slider to zoom in only on the data from the past few weeks.
After setting the target and configuring the time series options, she clicks Start to generate time series features and run Autopilot. After running Autopilot with a forecast window of 1 to 7 days in the future, she looks at the Accuracy Over Time chart of the top-performing model on the Leaderboard to see how the model performs on the main validation set (Backtest 1). She looks at the overall view and then switches the series identifier to view each store. She then uploads the most recent history to make predictions that forecast sales for each series over the next week. Then, she downloads the forecast and uses it to order the correct inventory amounts for next week.


