Service Health and Accuracy history
Availability information
Deployment history for service health and accuracy is off by default. Contact your DataRobot representative or administrator for information on enabling this feature.
Feature flag: Enable Deployment History
When analyzing a deployment, Service Health and Accuracy can provide critical information about the performance of current and previously deployed models. However, comparing these models can be a challenge as the charts are displayed separately, and the scale adjusts to the data. To improve the usability of the service health and accuracy comparisons, the Service Health > History and Accuracy > History tabs (now available for preview) allow you to compare the current model with previously deployed models in one place, on the same scale.
Service Health history
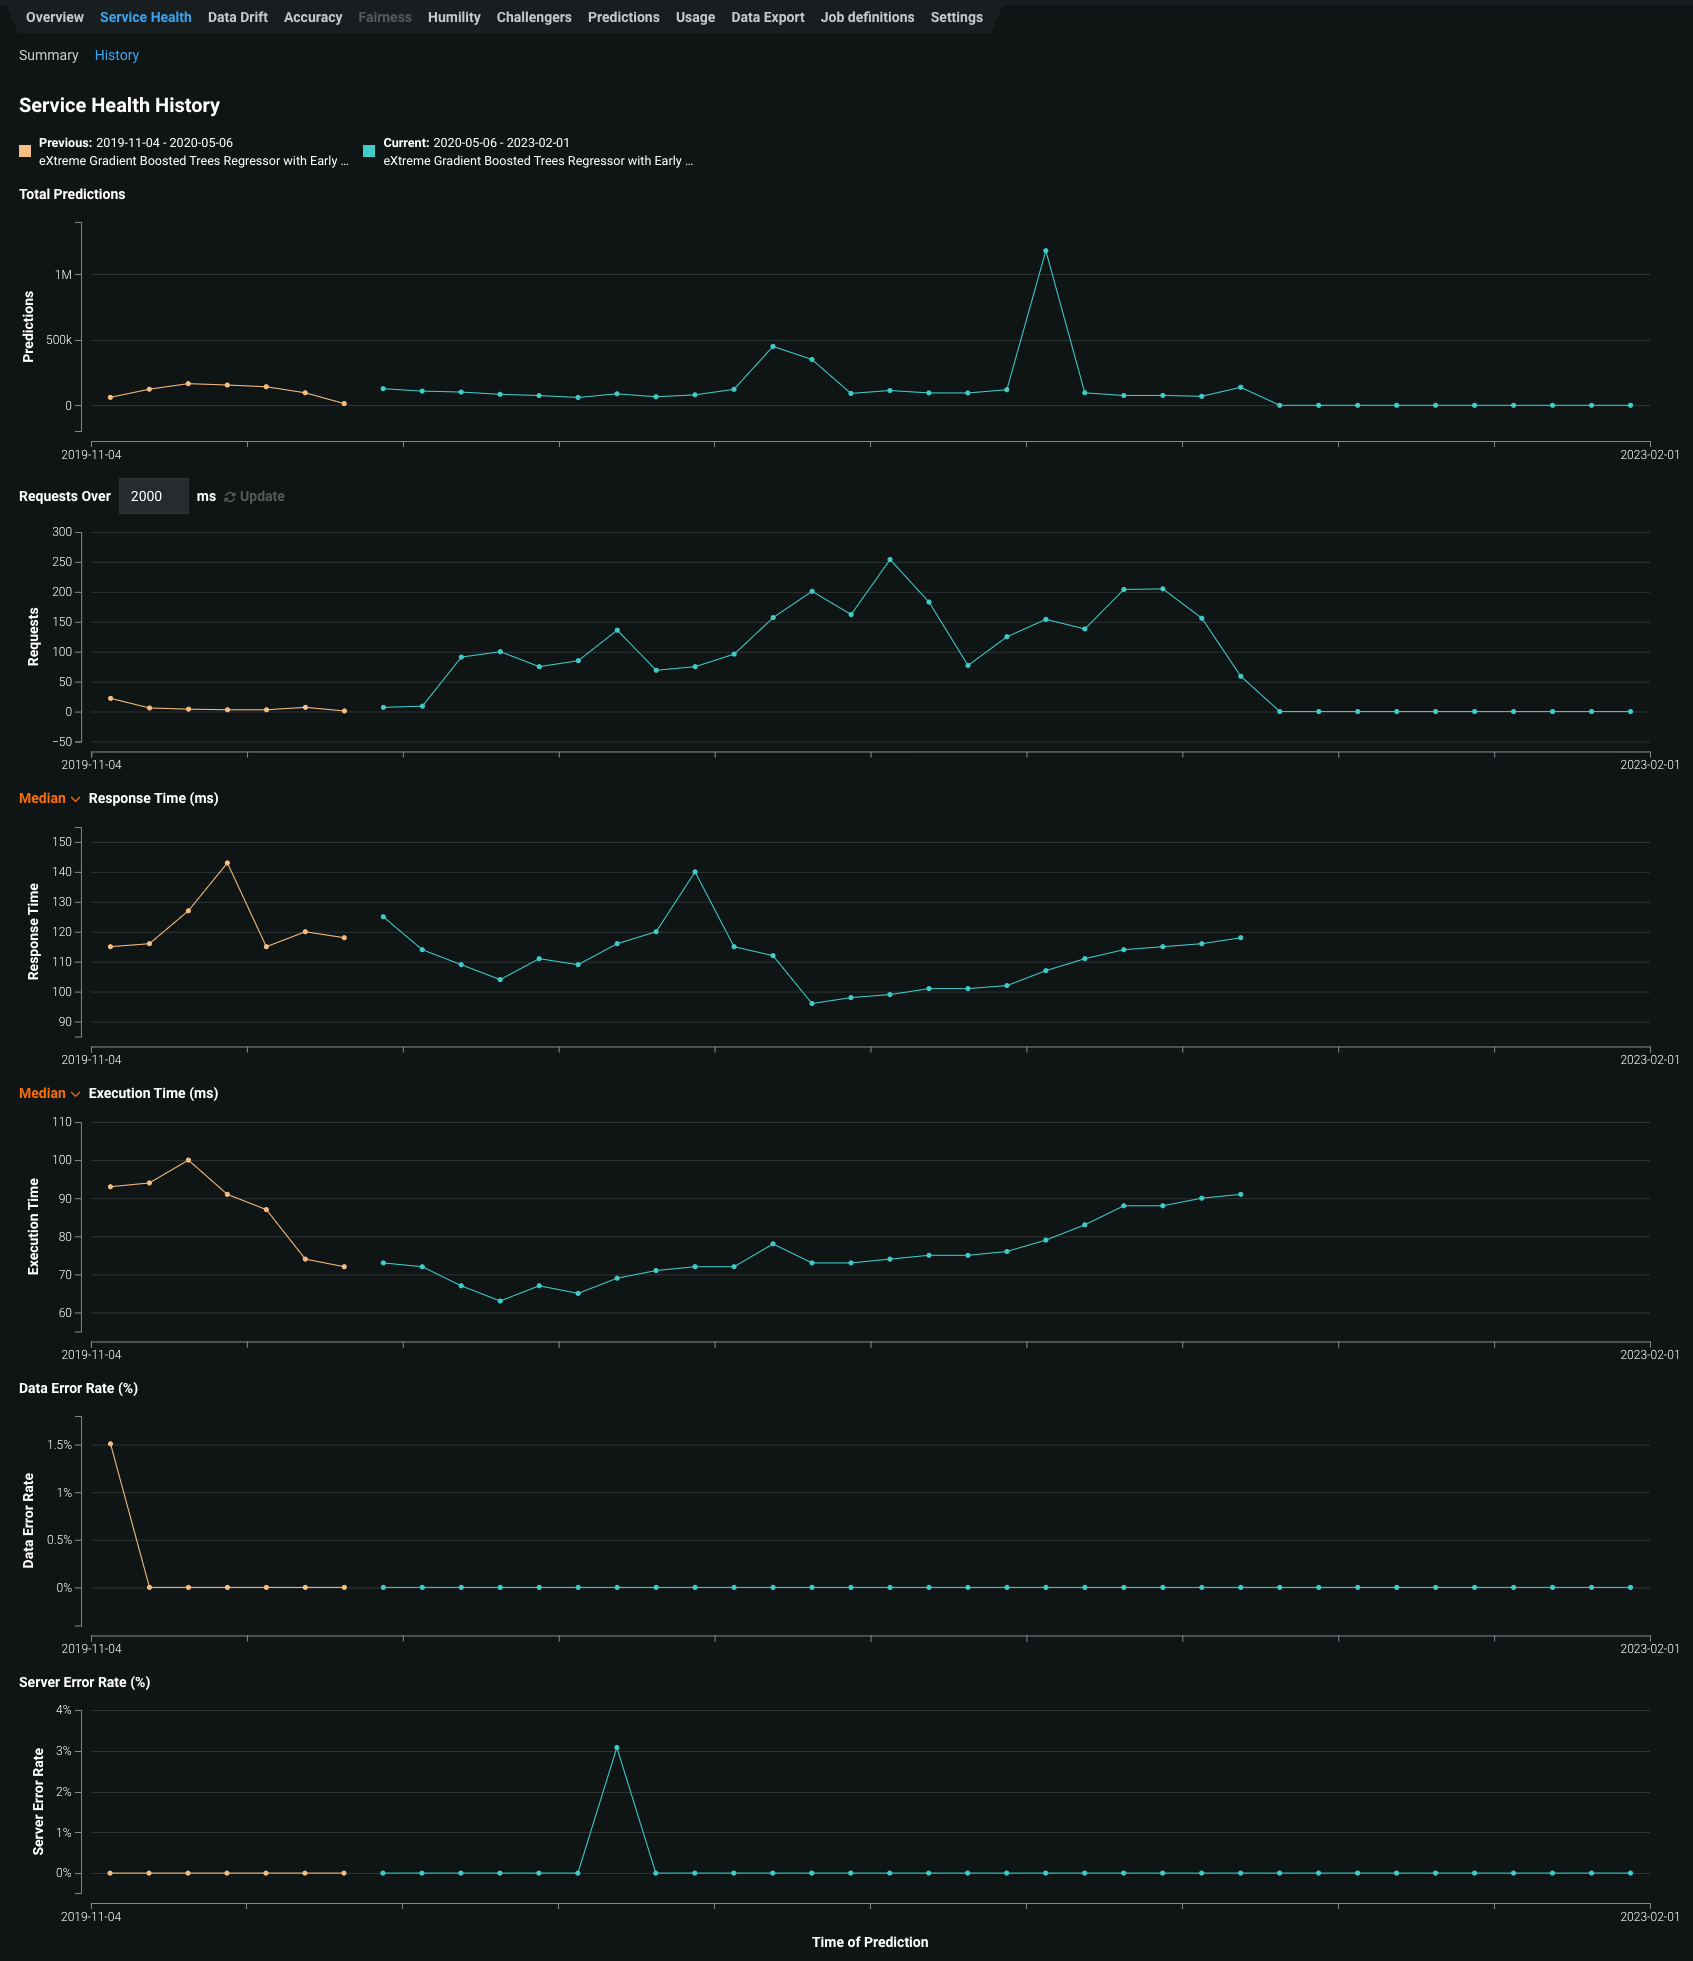
The Service Health page displays metrics you can use to assess a deployed model's ability to respond to prediction requests quickly and reliably. In addition, on the History tab, you can access visualizations representing the service health history of up to five of the most recently deployed models, including the currently deployed model. This history is available for each metric tracked in a model's service health, helping you identify bottlenecks and assess capacity, which is critical to proper provisioning. For example, if a deployment's response time seems to have slowed, the Service Health page for the model's deployment can help diagnose the issue. If the service health metrics show that median latency increases with an increase in prediction requests, you can then check the History tab to compare the currently deployed model with previous models. If the latency increased after replacing the previous model, you could consult with your team to determine whether to deploy a better-performing model.
To access the Service Health > History tab:
-
Click Deployments and select a deployment from the inventory.
-
On the selected deployment's Overview, click Service Health.
-
On the Service Health > Summary page, click History.
The History tab tracks the following metrics:
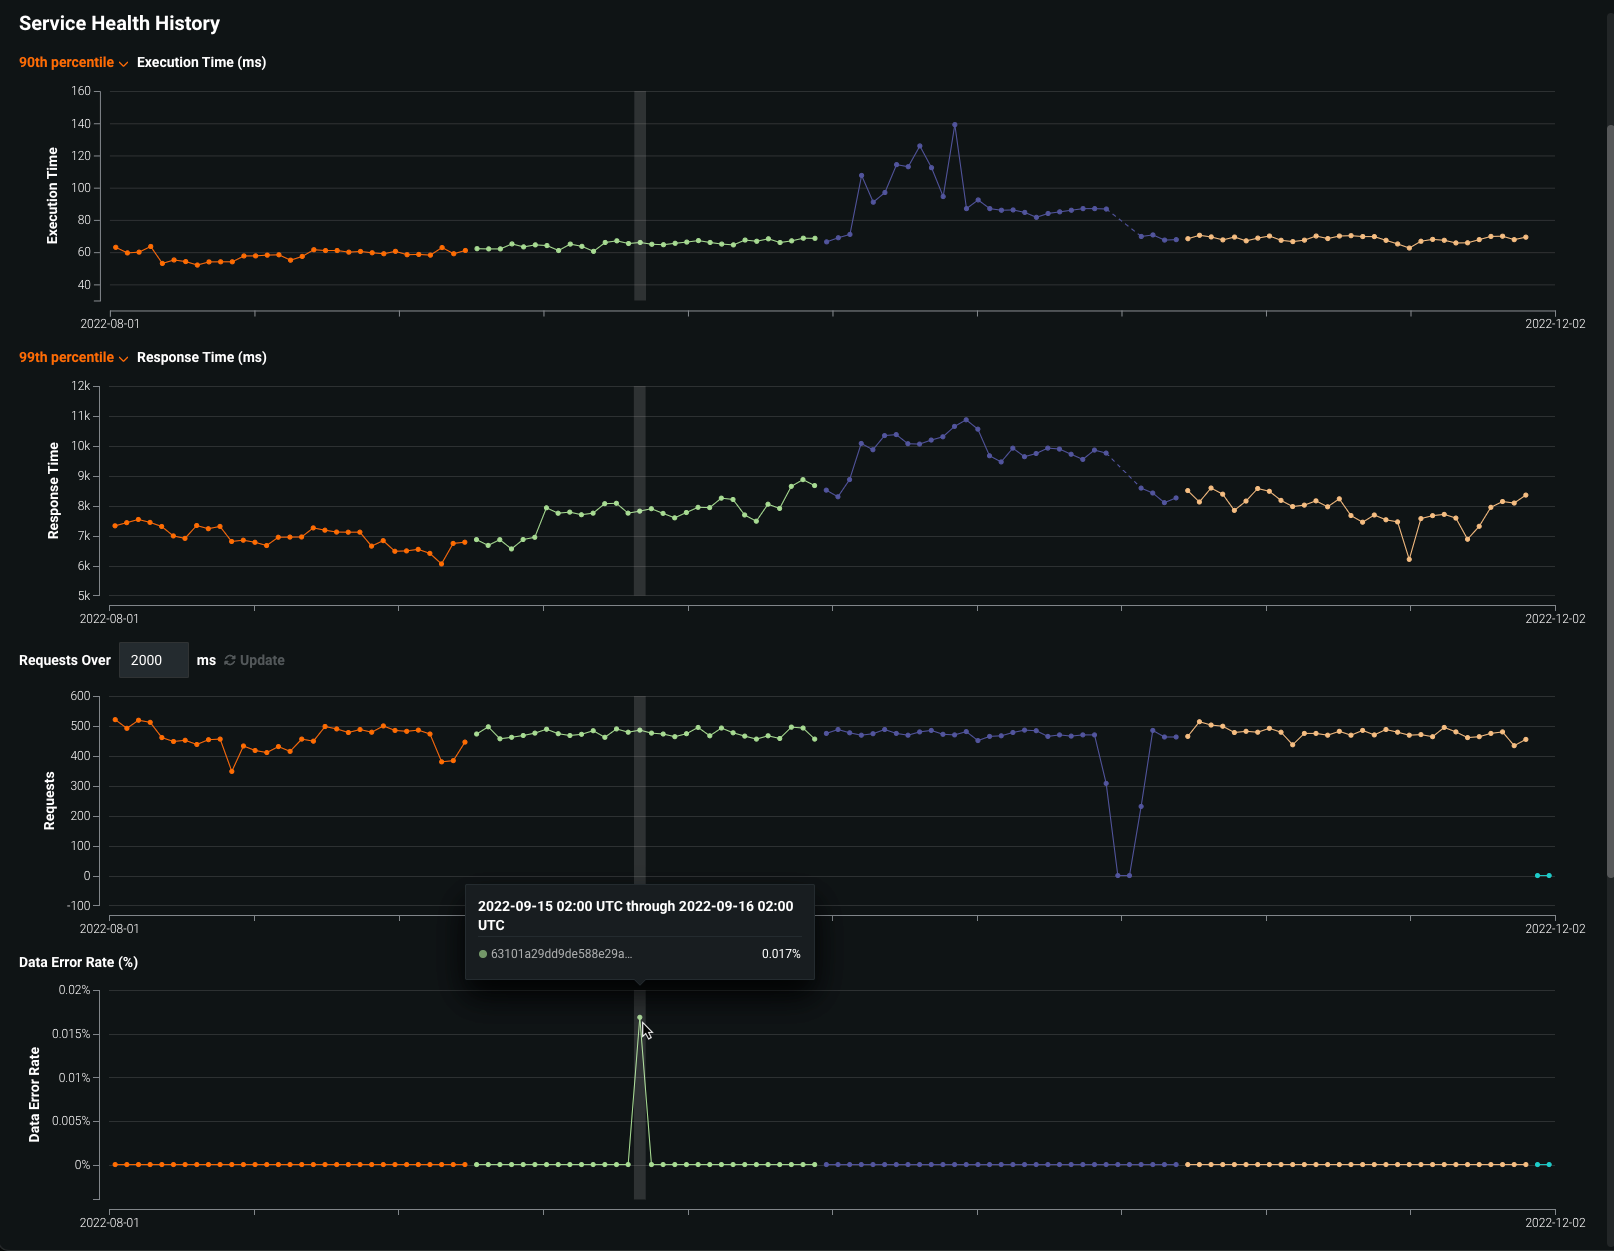
Metric Reports Total Predictions The number of predictions the deployment has made. Requests over x ms The number of requests where the response time was longer than the specified number of milliseconds. The default is 2000 ms; click in the box to enter a time between 10 and 100,000 ms or adjust with the controls. Response Time (ms) The time (in milliseconds) DataRobot spent receiving a prediction request, calculating the request, and returning a response to the user. The report does not include time due to network latency. Select the Median prediction request time or 90th percentile, 95th percentile, or 99th percentile. The display reports a dash if you have made no requests against it or if it's an external deployment. Execution Time (ms) The time (in milliseconds) DataRobot spent calculating a prediction request. Select the Median prediction request time or 90th percentile, 95th percentile, or 99th percentile. Data Error Rate (%) The percentage of requests that result in a 4xx error (problems with the prediction request submission). This is a component of the value reported as the Service Health Summary in the Deployments page top banner. System Error Rate (%) The percentage of well-formed requests that result in a 5xx error (problem with the DataRobot prediction server). This is a component of the value reported as the Service Health Summary in the Deployments page top banner. -
To view the details for a data point in a service health history chart, you can hover over the related bin on the chart:
Accuracy history
The Accuracy page analyzes the performance of model deployments over time using standard statistical measures and visualizations. Use this tool to analyze a model's prediction quality to determine if it is decaying and if you should consider replacing it. In addition, on the History page, you can access visualizations representing the accuracy history of up to five of the most recently deployed models, including the currently deployed model, allowing you to compare model accuracy directly. These accuracy insights are rendered based on the problem type and its associated optimization metrics.
Note
Accuracy monitoring is not enabled for deployments by default. To enable it, first upload the data that contains predicted and actual values for the deployment collected outside of DataRobot. For more information, see the documentation on setting up accuracy for deployments by adding actuals.
To access the Accuracy > History tab:
-
Click Deployments and select a deployment from the inventory.
-
On the selected deployment's Overview, click Accuracy.
-
On the Accuracy > Summary page, click History.
The History tab tracks the following:
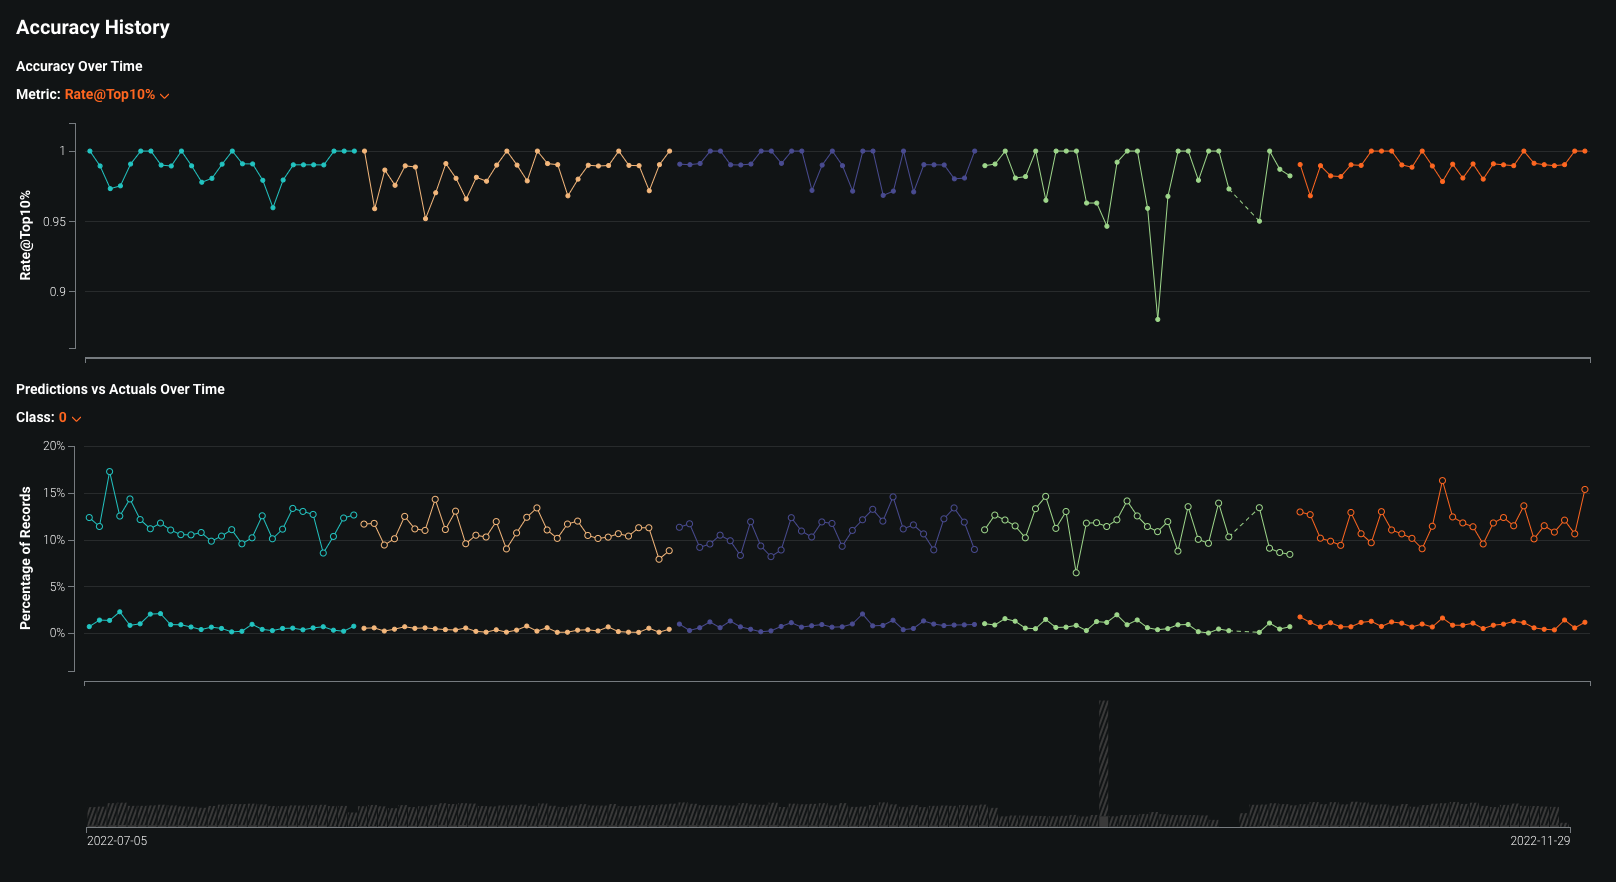
Metric Reports Accuracy Over Time A line graph visualizing the change in the selected accuracy metric over time for up to five of the most recently deployed models, including the currently deployed model. The available accuracy metrics depend on the project type. Predictions vs Actuals Over Time A line graph visualizing the difference between the average predicted values and average actual values over time for up to five of the most recently deployed models, including the currently deployed model. For classification projects, you can display results per-class. The accuracy over time chart plots the selected accuracy metric for each prediction range along a timeline. The accuracy metrics available depend on the type of modeling project used for the deployment:
Project type Available metrics Regression RMSE, MAE, Gamma Deviance, Tweedie Deviance, R Squared, FVE Gamma, FVE Poisson, FVE Tweedie, Poisson Deviance, MAD, MAPE, RMSLE Binary classification LogLoss, AUC, Kolmogorov-Smirnov, Gini-Norm, Rate@Top10%, Rate@Top5%, TNR, TPR, FPR, PPV, NPV, F1, MCC, Accuracy, Balanced Accuracy, FVE Binomial You can select an accuracy metric from the Metric dropdown list.
The Predictions vs Actuals Over Time chart plots the average predicted value next to the average actual value for each prediction range along a timeline. In addition, the volume chart below the graph displays the number of predicted and actual values corresponding to the predictions made within each plotted time range. The shaded area represents the number of uploaded actuals, and the striped area represents the number of predictions without corresponding actuals.
The timeline and bucketing work the same for classification and regression projects; however, for classification projects, you can use the Class dropdown to display results for that class.
-
To view the details for a data point in an accuracy history chart, you can hover over the related bin on the chart:


