Create the modeling dataset
The time series modeling framework extracts relevant features from time-sensitive data, modifies them based on user-configurable forecasting needs, and creates an entirely new dataset derived from the original. DataRobot then uses standard, as well as time series-specific, machine learning algorithms for model building. This section describes:
- Reviewing data and new features
- Understanding the Feature Lineage tab
- Downsampling in time series projects
- Handling missing values
You cannot influence the type of new features DataRobot creates, but the application adds a variety of new columns including (but not limited to): average value over x days, max value over past x days, median value over x days, rolling most frequent label, rolling entropy, average length of text over x days, and many more.
Additionally, with time series date/time partitioning, DataRobot scans the configured rolling window and calculates summary statistics (not typical with traditional partitioning approaches). At prediction time, DataRobot automatically handles recreating the new features and verifies that the framework is respected within the new data.
Time series modeling features are the features derived from the original data you uploaded but with rolling windows applied—lag statistics, window averages, etc. Feature names are based on the original feature name, with parenthetical detail to indicate how it was derived or transformed. Clicking any derived feature displays the same type of information as an original feature. You can look at the Importance score, calculated using the same algorithms as with traditional modeling, to see how useful (generally, very) the new features are for predicting.
Review data and new features
Once you click Start, DataRobot derives new time series features based on your time series configuration, creating the time series modeling data. By default DataRobot displays the Derived Modeling Data panel, a feature summary that displays the settings used for deriving time series features, dataset expansion statistics, and a link to view the derivation log. (To see your original data, click Original Time Series Data.)
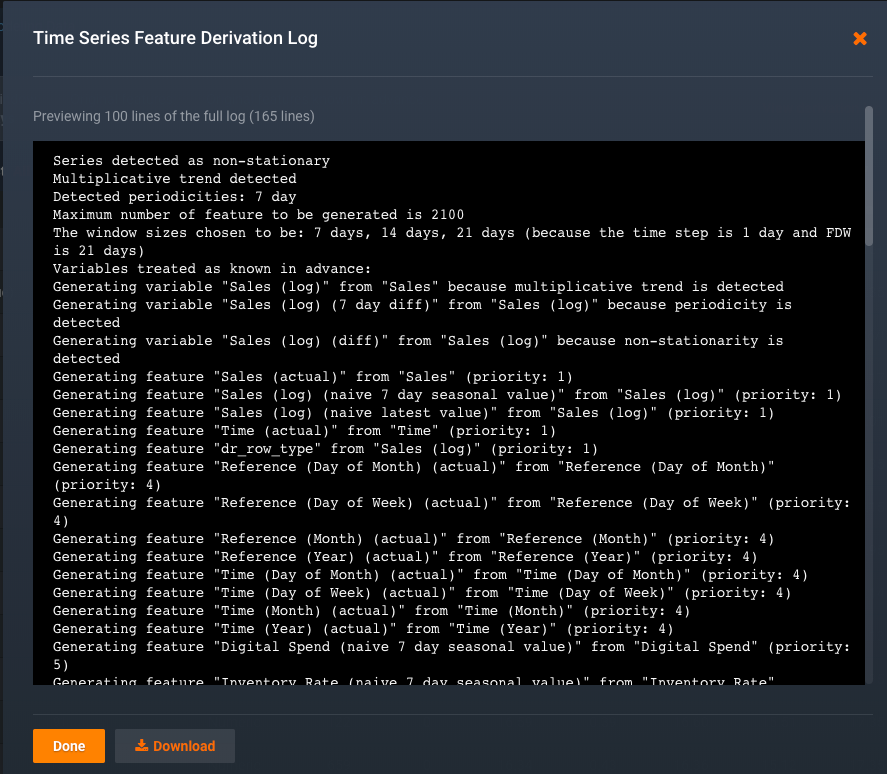
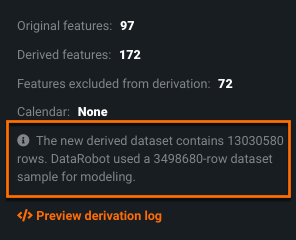
When sampling is required, that information is also included. Click View more info to see the derivation log, which lists the decisions made during feature creation and is downloadable.
Within the log, you can see that every candidate derived feature is assigned a priority level (Generating feature "Sales (35 day mean)" from "Sales" (priority: 11) for example). When deciding which of the candidates to keep after time series feature derivation completes, DataRobot picks a priority threshold and excludes features outside that threshold. When a candidate feature is removed, the feature derivation log displays the reason:
Removing feature "y (1st lag)" because it is a duplicate of the simple naïve of target
or
Removing feature "y (42 row median)" because the priority (7) is lower than the allowed threshold (7)
Downsampling in time series projects
Because the modeling dataset creates so many additional features, the dataset size can grow exponentially. Downsampling is a technique DataRobot applies to ensure that the derived modeling dataset is manageable and optimized for speed, memory use, and model accuracy. (This sampling method is not the same as the smart downsampling option that downsamples the majority class (for classification) or zero values (regression).)
Growth in a time series dataset is based on the number of columns and the length of the forecast window (i.e., the number of forecast distances within the window). The derived features are then sampled across the backtests and holdout and the sampled data provides the basis of related insights (Leaderboard scores, Forecasting Accuracy, Forecasting Stability, Feature Effects, Feature Over Time). DataRobot reports that information in the additional info modal accessible from the Derived Modeling Data panel:
With multiseries modeling, the number of series, as well as the length of each series, also contribute to the number of new features in the derived dataset. Multiseries projects have a slightly different approach to sampling; the Series Insights tab does not use the sampled values because the result may be too few values for accurate representation.
Handle missing values
DataRobot handles missing value imputation differently with time series projects. The following describes the process.
Consider the following from a time series dataset, which is missing a row:
Date,y
2001-01-01,1
2001-01-02,2
2001-01-04,4
2001-01-05,5
2001-01-06,6
In this example, the value 2001-01-03 is "missing."
For ARIMA models, DataRobot attempts to make the time series more regular and use forward filling. This is applicable when the Feature Derivation Window and Forecast Window use a time unit. When these windows are created as row-based projects, DataRobot skips the history regularization process (no forward filling) and keeps the original data.
For non-ARIMA models, DataRobot uses the data as is and does not allow modeling to start if it is too irregular.
Consider the following—the dataset is missing a target or date/time value:*
Date,y
2001-01-01,1
2001-01-02,2
,3
2001-01-04,
2001-01-05,5
In this example the third row is missing Date, the fourth is missing y. DataRobot drops those rows, since they have no target or date/time value.
Consider the case of missing feature values, in this example 2001-01-02,,2:
Date,feat1,y
2001-01-01,1,1
2001-01-02,,2
2001-01-03,3,3
2001-01-04,4,4
-
At the feature level, the derived features (rolling statistics) will ignore the missing value.
-
At the blueprint level, it is dependent on the blueprint. Some blueprints can handle a missing feature value without any issue. For others (for example, some ENET-related blueprints), DataRobot may use median value imputation for the missing feature value.
There is one additional special circumstance—the naïve prediction feature, which is used for differencing. In this case, DataRobot uses a seasonal forward fill (which falls back on median if not available).
Read more
To learn more about the topics discussed on this page, see:
- The time series feature engineering reference for a list of operators used and feature names created by the feature derivation process.
- Restoring features discarded during feature reduction.

