What-if and Optimizer
The What-if and Optimizer widget provides two tools for interacting with prediction results:
- What-if: A decision-support tool that allows you to create and compare multiple prediction simulations to identify the option that provides the best outcome. You can also make a prediction, then change one or more inputs to create a new simulation, and see how those changes affect the target feature.
- Optimizer: Identifies the maximum or minimum predicted value for a target or custom expression by varying the values of a selection of flexible features in the model.
To edit the What-if and Optimizer widget, open the Editing page dropdown and select Prediction Details/Optimizer Details.
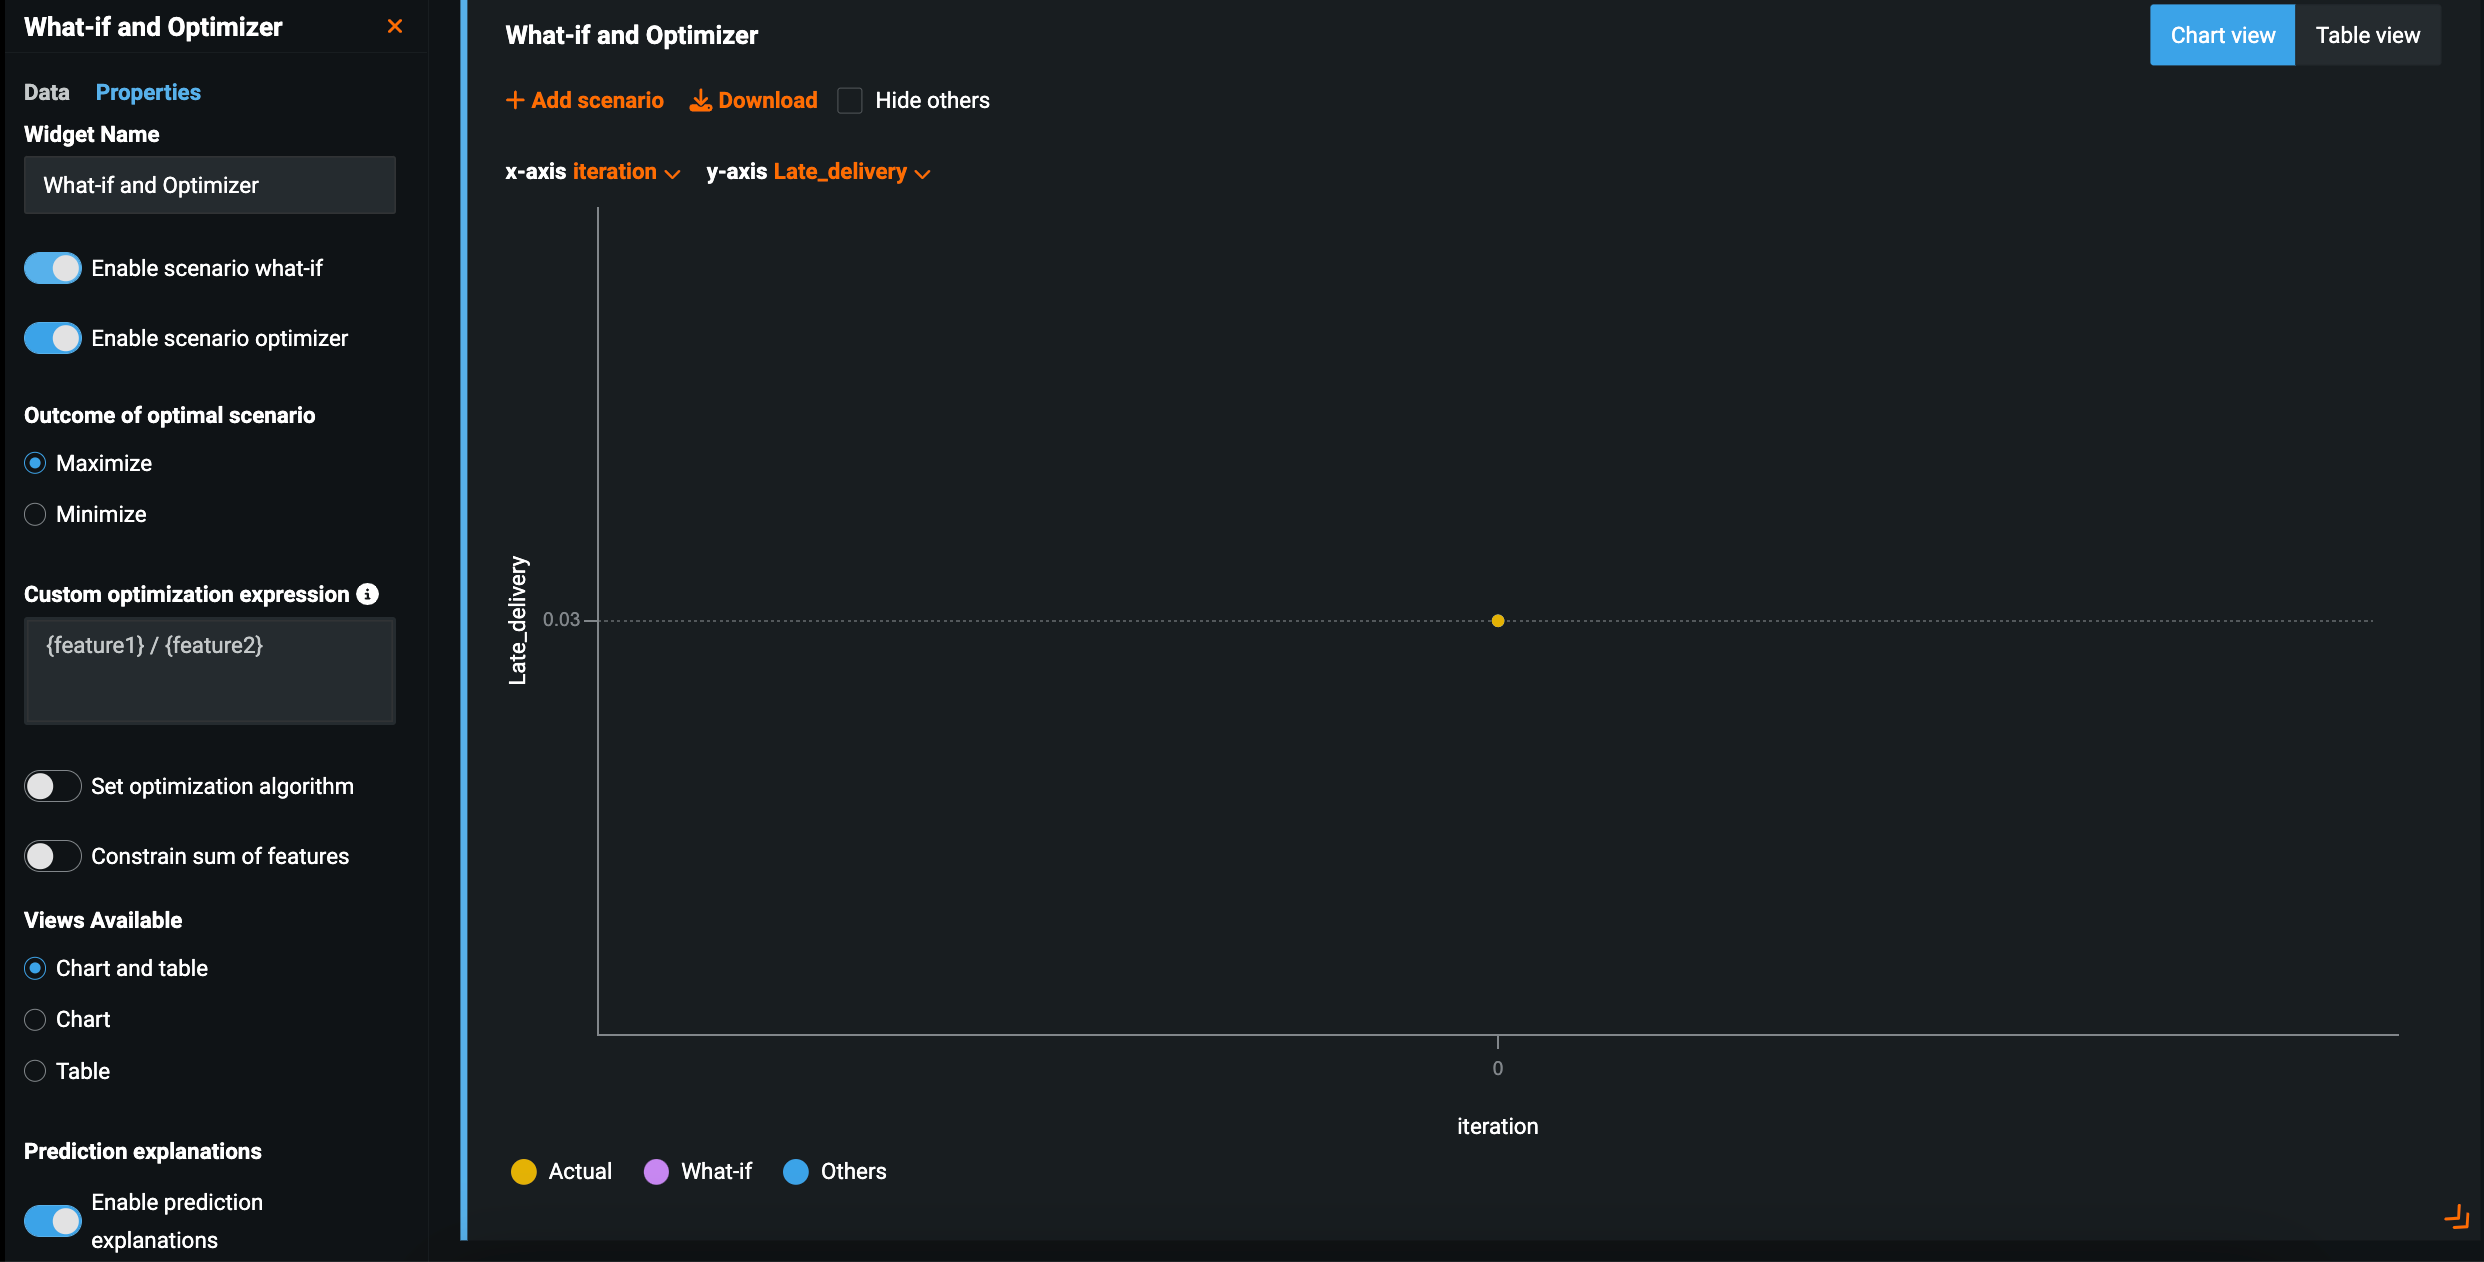
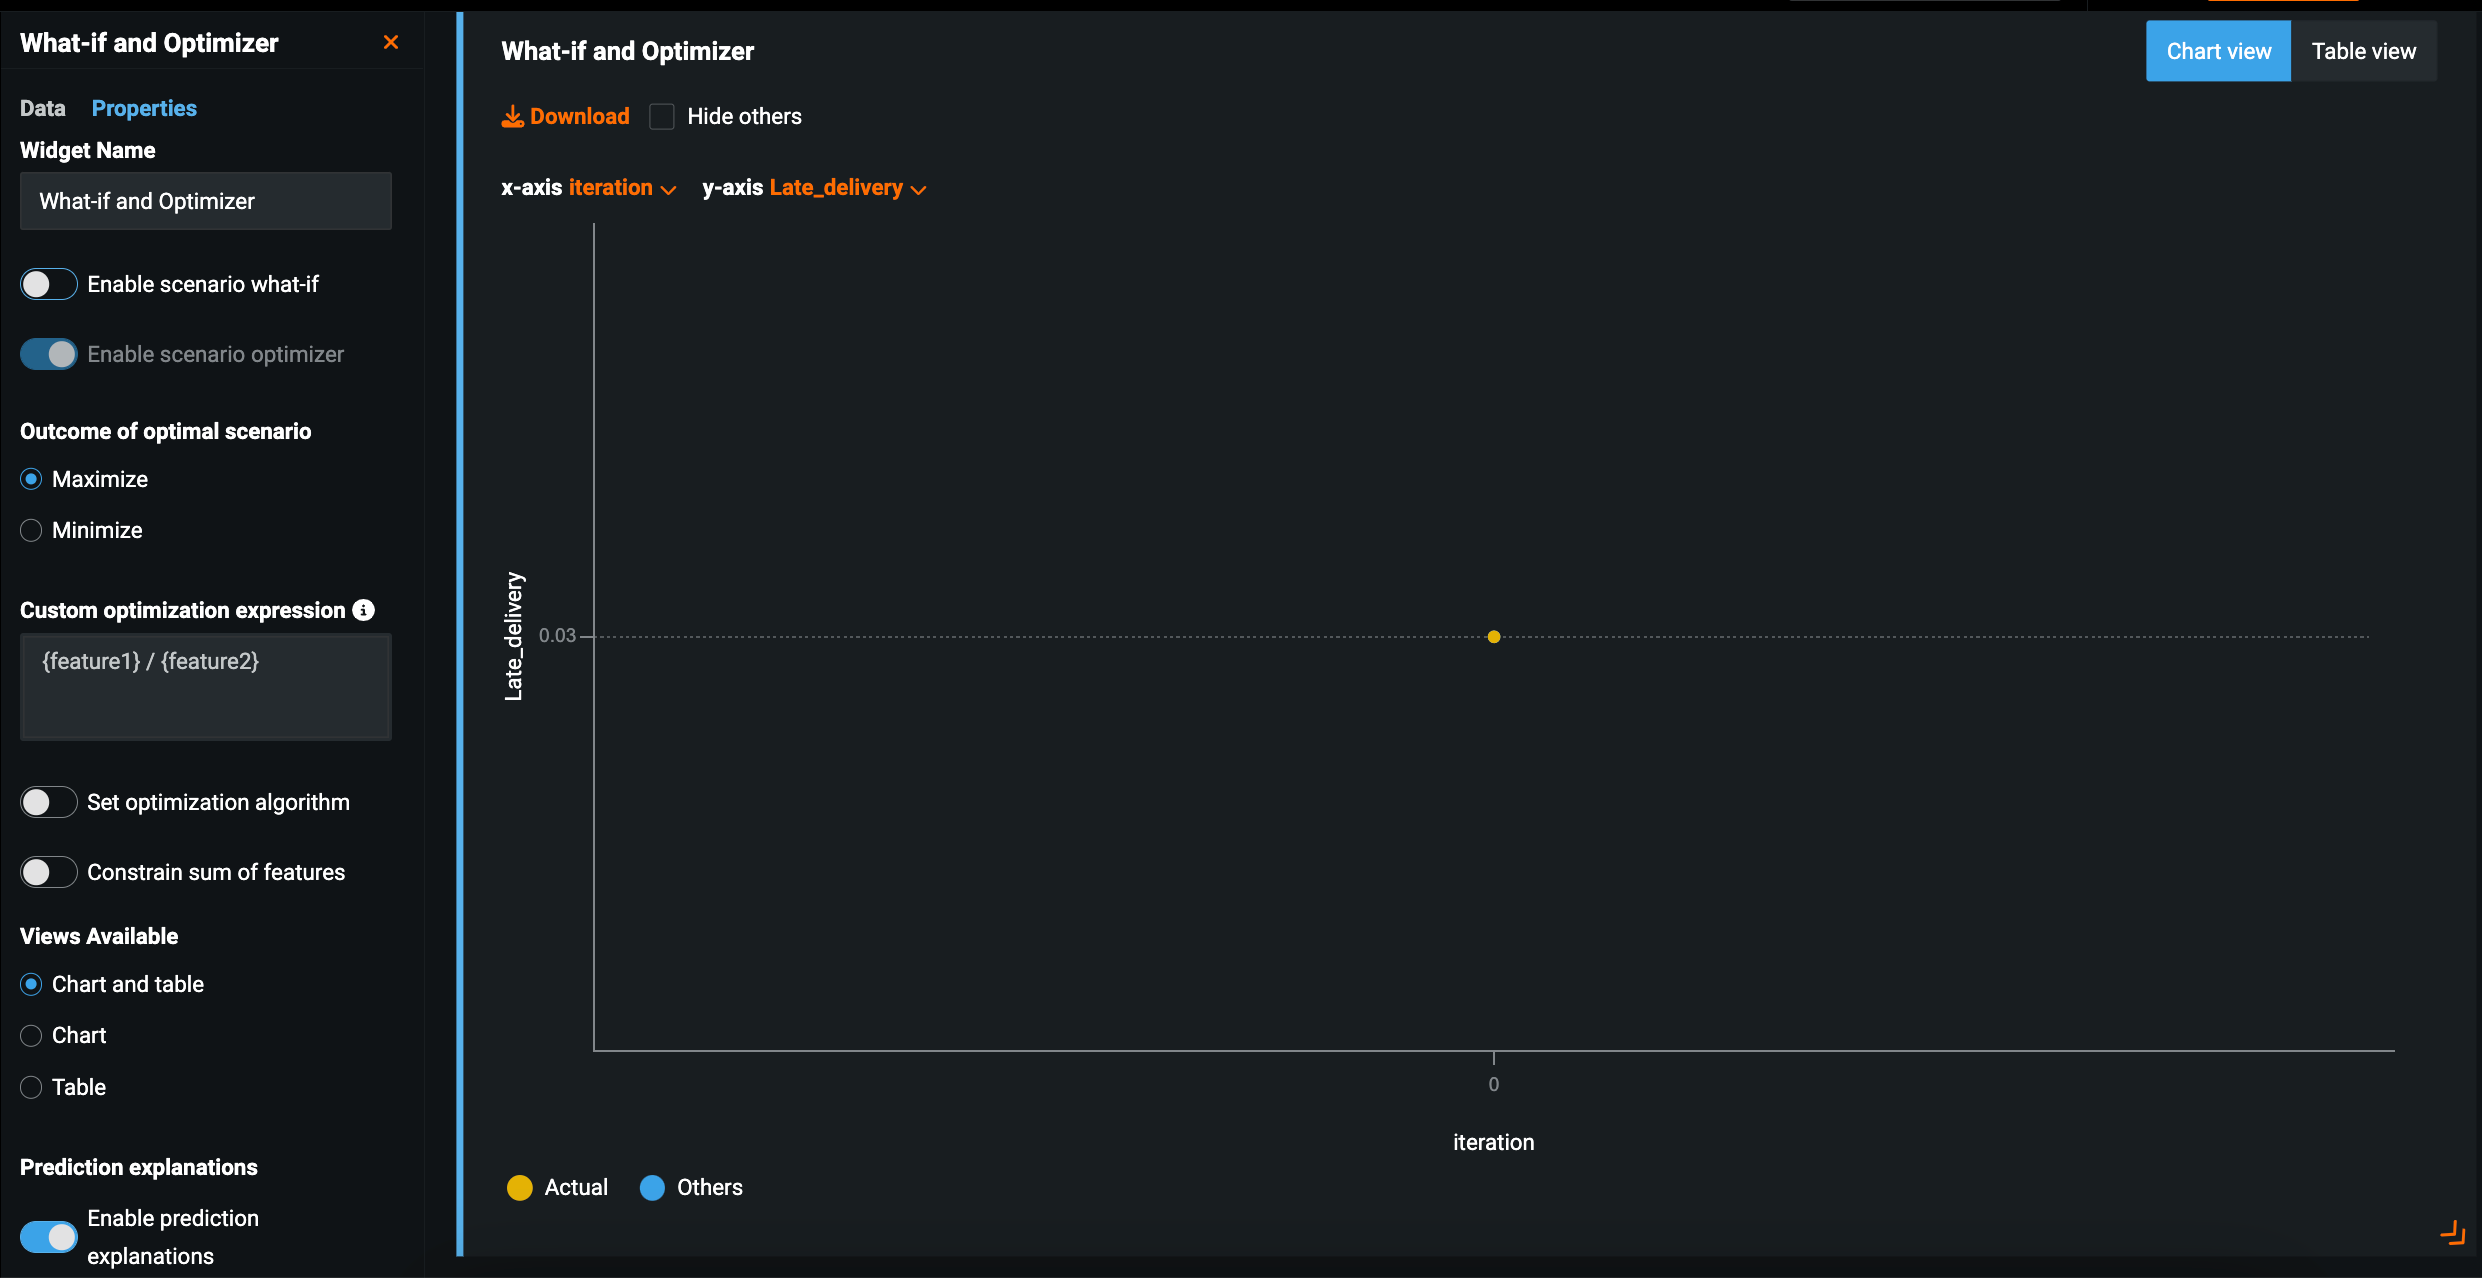
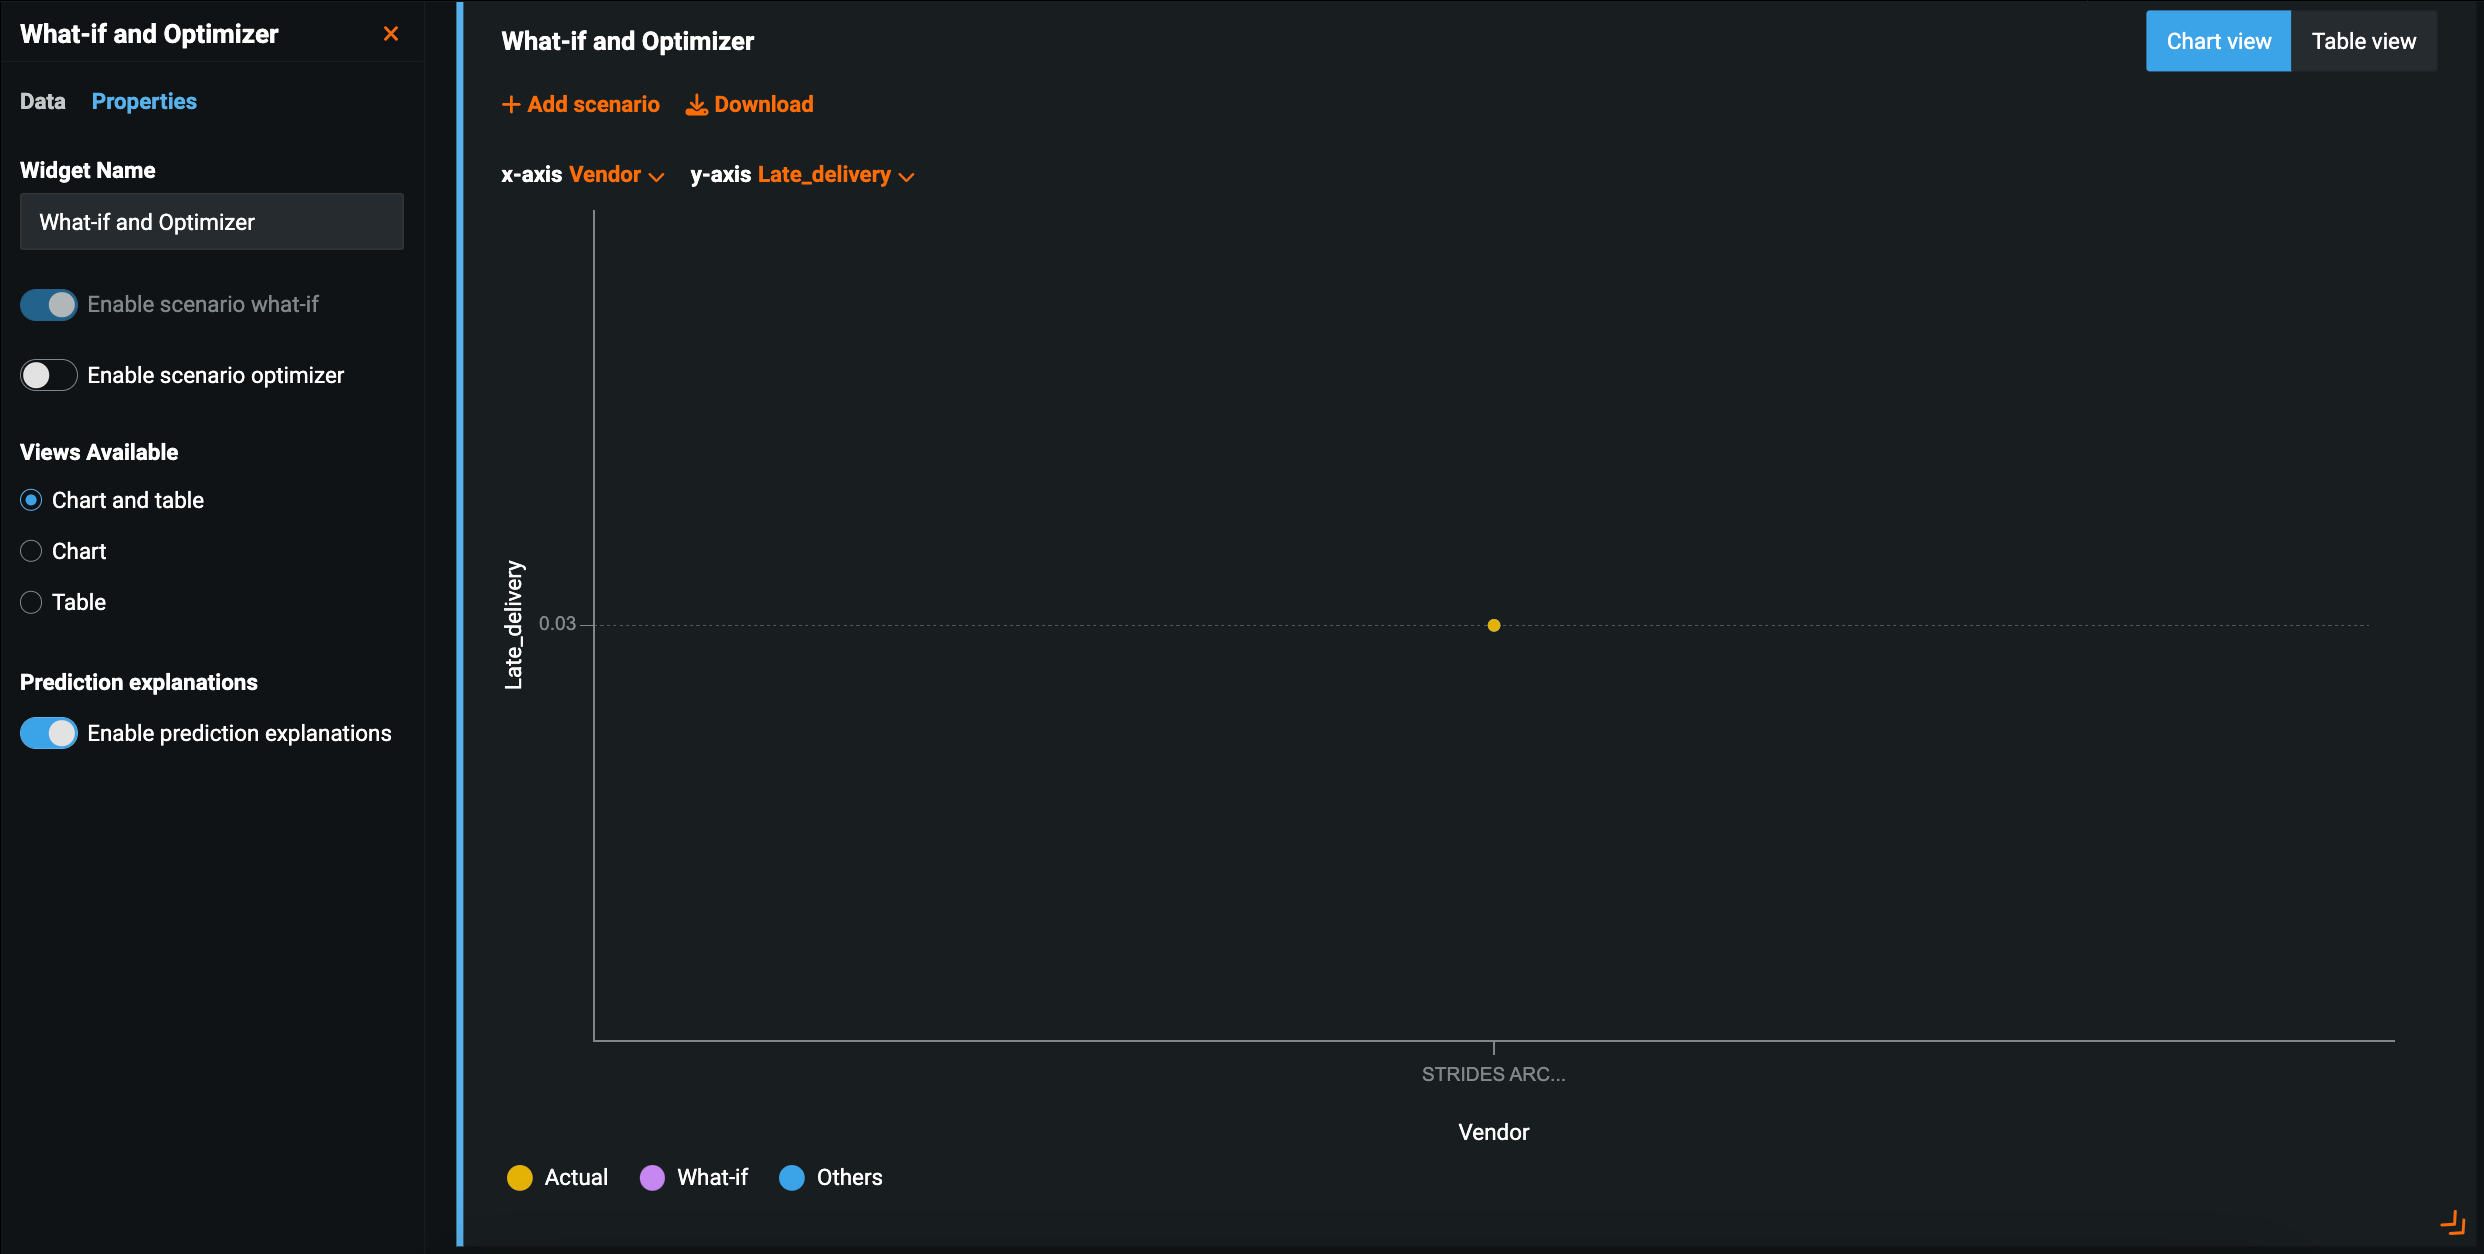
Select the widget and click the Properties tab. The app offers a number of settings that enhance the output of predicted values for your target. The settings displayed are based on which tools are enabled as well as the project type.
The table below describes each configurable parameter:
| Parameter | Description |
|---|---|
| What-if and Optimizer toggles | Enable scenario what-if: Toggle to enable or disable the comparison functionality. Enable scenario optimizer: Toggle to enable or disable the optimizer functionality. If optimizer is enabled, you must select an option under Outcome of optimal scenario and can optionally include a custom optimization expression. |
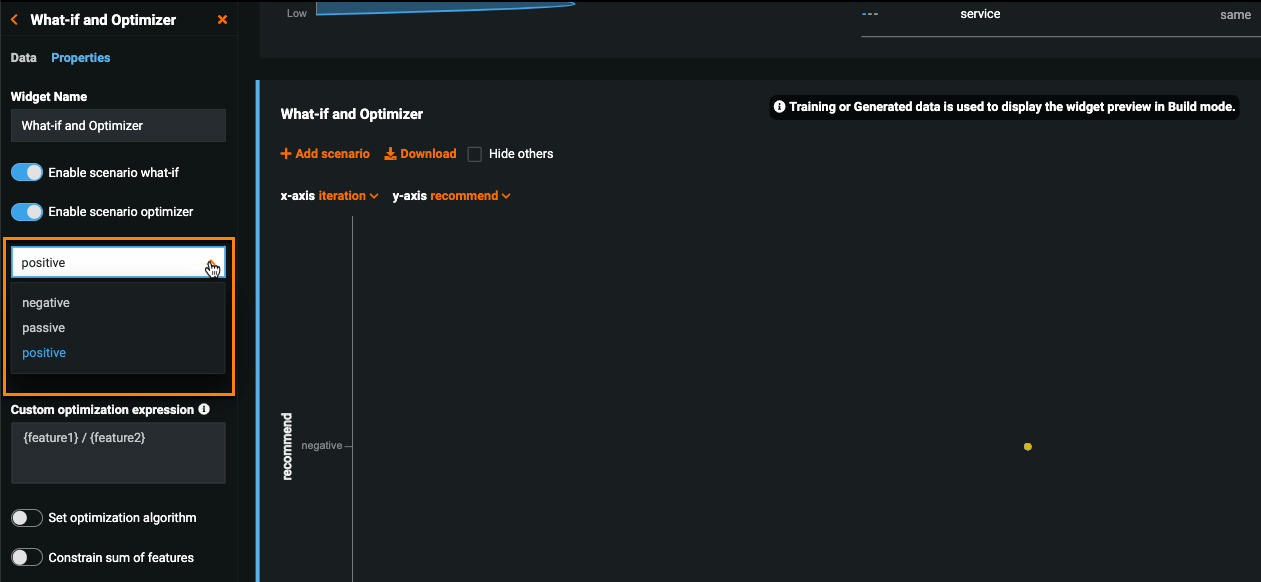
| Select target for optimizer dropdown (multiclass only) | Sets a target for the optimizer from the predicted class values if Enable scenario optimizer is toggled on. |
| Outcome of optimal scenario | Sets whether to minimize or maximize the predicted values for the target feature. Minimizing leads to the lowest outcome (e.g., custom churn), and maximizing the highest (e.g., sale price). |
| Custom optimization expression | Creates an equation using curly braces that uses one or more features, such as {converted} * {renewal_price}. |
| Set optimization algorithm | Sets an algorithm, when enabled; otherwise leaves the optimization choice to DataRobot. Choose from the algorithms listed and determine the number of simulations to run. Grid Search is an exhaustive, brute-force search of options on up to three flexible features. This may result in long run times because it tries many possibilities, even if prior iterations don't suggest a strong outcome. Particle Swarm is a metaheuristic strategy that tests a large number of options with up to 30 flexible features. It can be effective for numeric flexible features but may not be as effective for flexible categorical features. Hyperopt efficiently explores significantly fewer options on up to 20 flexible features. It is effective for categorical and numeric features. With this algorithm, you can set up to 400 simulations. More iterations may yield better results, but can result in longer run times as it takes many iterations to converge. |
| Constrain sum of features | Sets output constraints. Constraints ensure that each record’s optimization iterations don’t output results that exceed a given value for the target feature. For example, if you are optimizing the price of a home, you may want to expand the gross living area by finishing part of the basement or adding a bedroom. You can use a sum constraint to limit the space each project is allowed to occupy in sq/ft. Choose Maximum (selected solutions must never exceed) or Equality (selected solutions must be equal) to the constrain value. |
| Views | Displays the information as a chart, a table, or both. |
Note
The default configuration is determined by the template selected during app creation. The What-if and Optimizer widget is disabled for the Predictor template but can be enabled by clicking the Eye icon.
Reduce runtime by disabling Prediction Explanations
Computing Prediction Explanations can increase prediction times, so if speed is more important than computing Prediction Explanations, turn off the Enable prediction explanations toggle.
Custom optimization expressions
For batch prediction optimization, use a field defined in the batch upload as part of the custom optimization expression the same way you use a feature from the dataset that the app is deployed from. For example, if you label a field in a spreadsheet net_profit, and you have a time_to_market feature in the project's underlying dataset, the following would be a valid custom expression:
{net_profit}/{time_to_market}
Add constraints to custom expressions
Not only can you use custom expressions to specify an optimal outcome by modifying the distance to a target number (instead of just minimizing or maximizing the predicted value for the target), you can also use custom expressions to add constraints on conditions of other flexible features. To do this, you must add a constraint to the custom expression as a penalty term.
For example, your target feature is sales and you want to maximize sales while monitoring how much is being spent on marketing (e.g., YouTube and TV ads). To do this, you want to make sure overspending on marketing is penalized appropriately—overspending by $1.00 should be less penalized than overspending by $1,000,000.
If you have a marketing budget of $100,000 to split between YouTube and TV ads, the custom expression might look like this:
Maximize
Sales
    - (((youtube_spend + tv_spend) > 100000) * factor1)
    - ((youtube_spend + tv_spend) * factor2)
factor1 represents how much you want to penalize for overspending, and factor2 represents how much you want to penalize for spending in general.
factor2 can be thought of as the marketing ROI. If your industry expects a 3% ROI for marketing then this value would be 1.03
Constrain sum of features
To select the features that you want to be part of the sum:
-
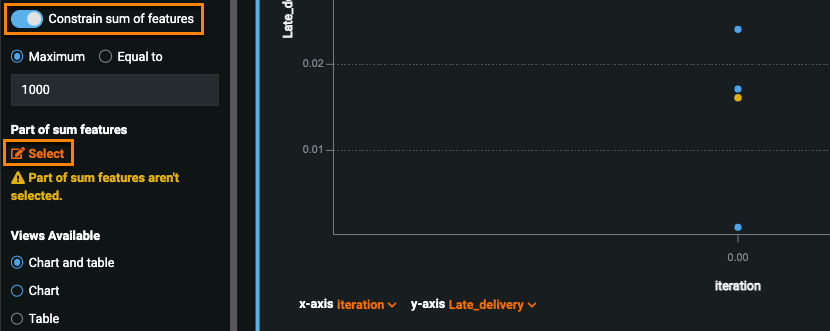
Turn on Constrain sum of features at the bottom of the Properties tab. Under Part of sum features, click Select.
-
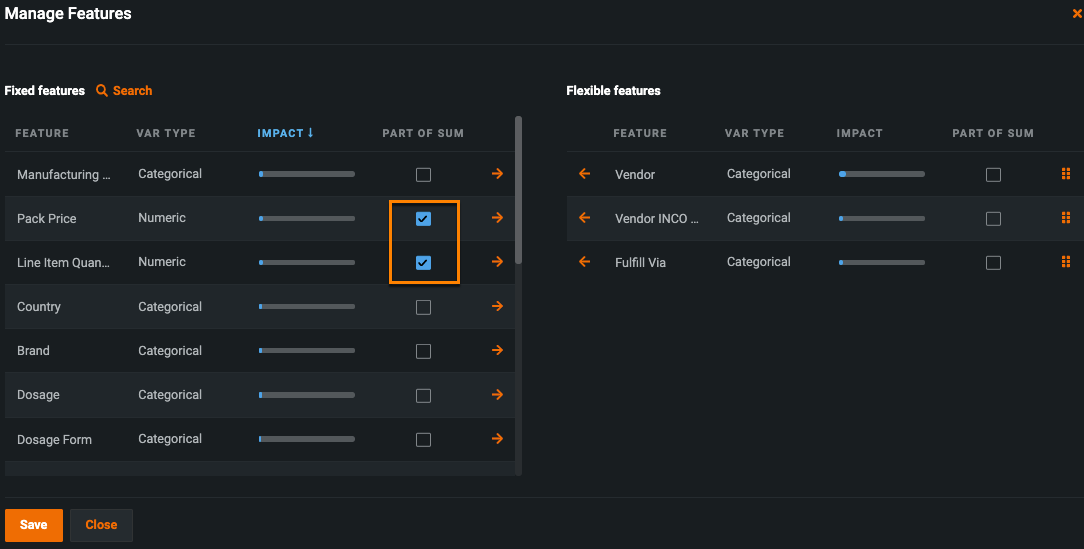
In the Manage Features window, check the box next to at least two fixed or flexible features—the selected features must be numeric. This option is not available if you use the Hyperopt algorithm.
-
Click Save when you are finished selecting features.
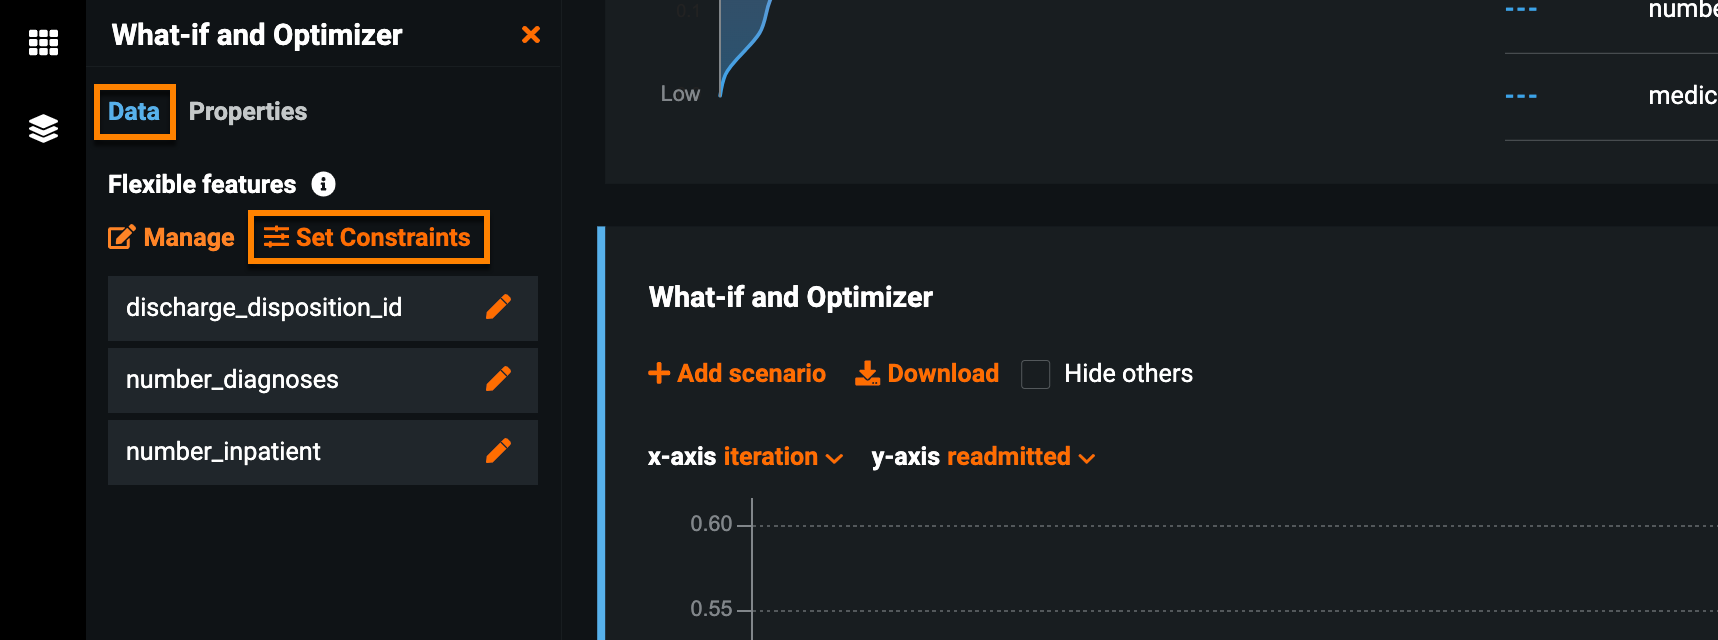
Flexible features
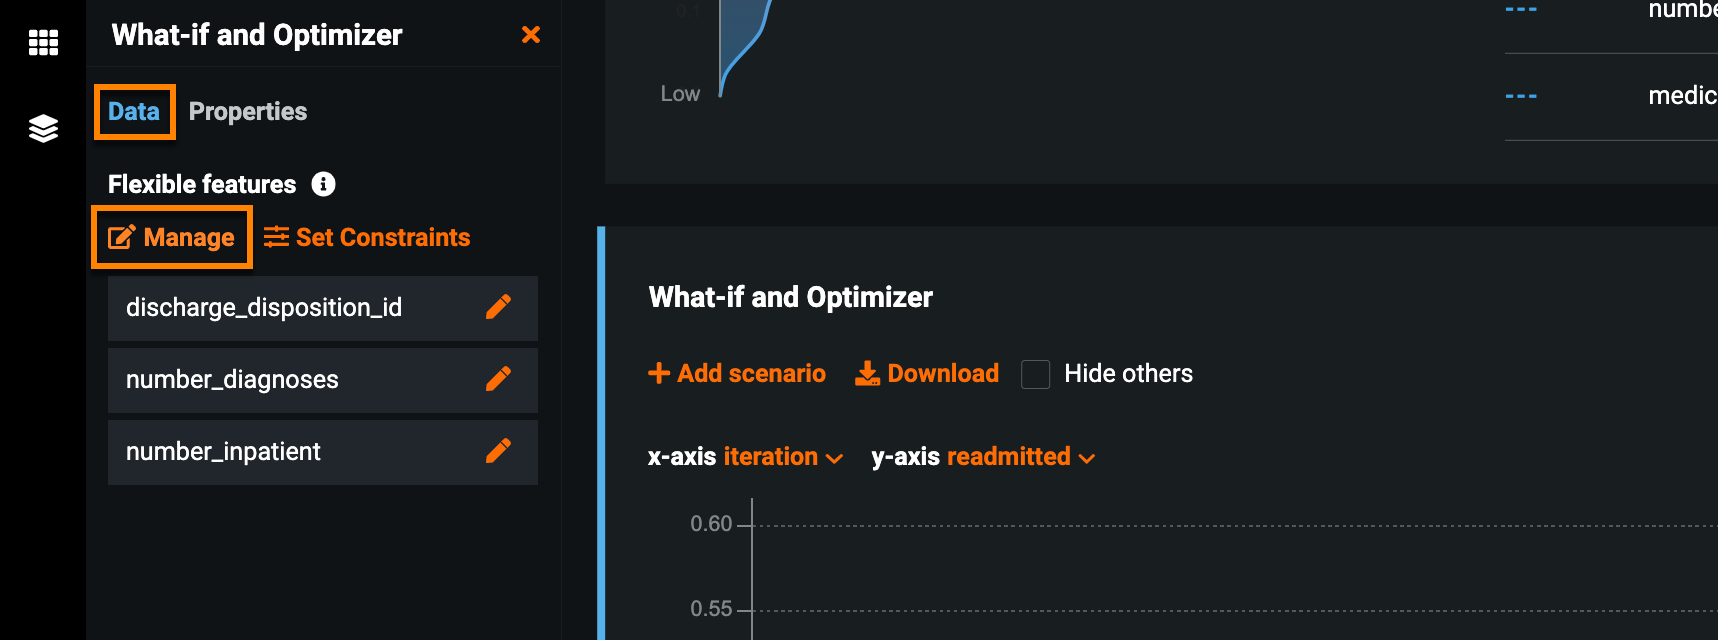
The Data tab allows you to select the features that represent the factors you have control over when searching for your optimized outcome. For example, when optimizing the price of homes, some flexible features are the quality of the kitchen, the cost of the mortgage, and the size of the garage.
To manage flexible features:
-
Click Manage.
-
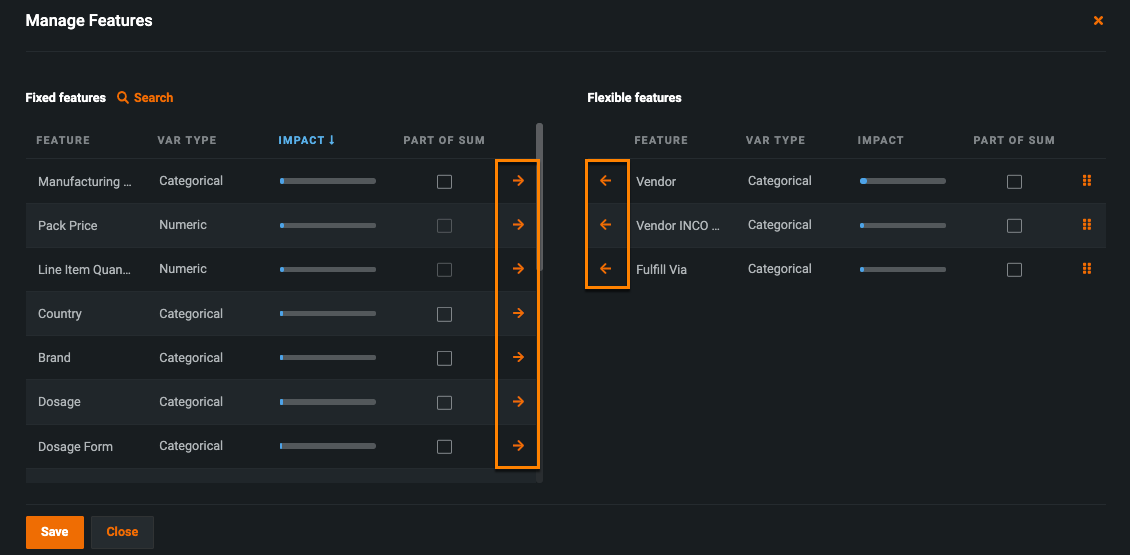
Use the orange arrows to add or remove features.
-
Click Save to confirm your flexible features.
Constraints
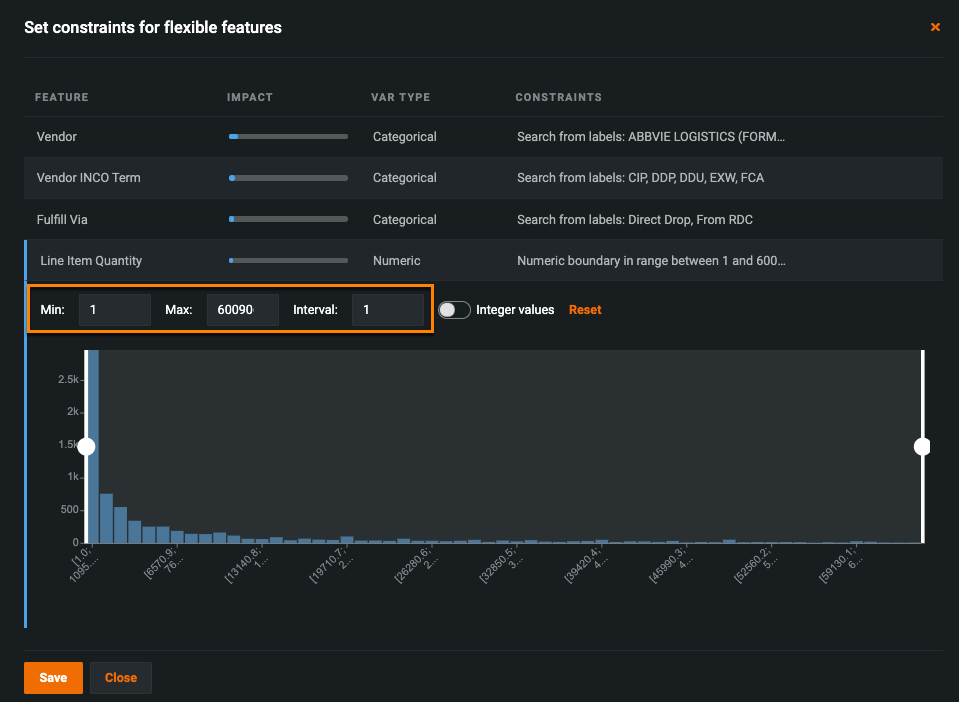
When you have selected flexible features, you can apply constraints to them. This instructs the app to only include values falling in the range determined by numeric constraints or specific values for a categorical feature.
To apply constraints to a feature, click Set Constraints on the Data tab.
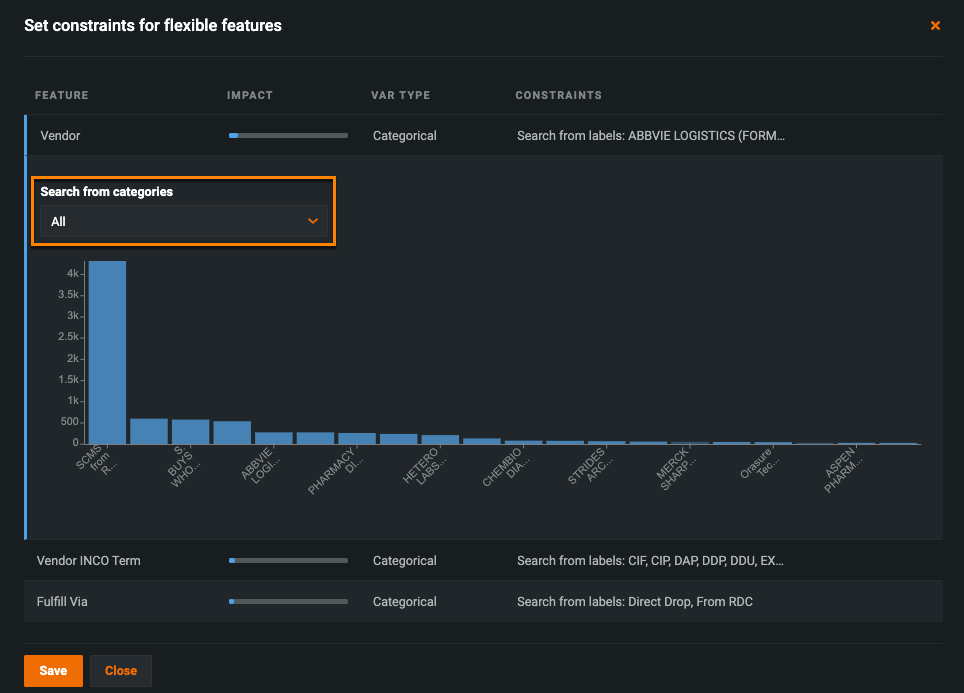
Selecting a flexible feature expands a dropdown displaying the feature distribution.
For categorical features, open the Search from categories dropdown and choose which features to include in the simulation by checking the corresponding box.
Click Save to confirm your feature constraints.

