Time Series
The Time Series tab sets a variety of features that can be set to customize time series projects.
Using the advanced options settings can impact DataRobot's feature engineering and how it models data. There are a few reasons to work with these options, although for most users, the defaults that DataRobot selects provide optimized modeling. The following describes the available options, which vary depending on the product type:
| Option | Description |
|---|---|
| Use multiple time series | Set or change the series ID for multiseries modeling. |
| Allow partial history in predictions | Allow predictions that are based on feature derivation windows with incomplete historical data. |
| Enable cross-series feature generation | Set cross-series feature derivation for regression projects. |
| Add features as known in advance (KA) | Add features that do not need to be lagged. |
| Exclude features from derivation | Identify features that will have automatic time-based feature engineering disabled. |
| Add calendar | Upload, add from the catalog, or generate an event file that specifies dates or events that require additional attention. |
| Customize splits | Specify the number of groupings for model training (based on the number of workers). |
| Treat as exponential trend | Apply a log-transformation to the target feature. |
| Exponentially weighted moving average | Set a smoothing factor for EWMA. |
| Apply differencing | Set DataRobot to apply differencing to make the target stationary prior to modeling. |
| Weights | Set weights to indicate a row's relative importance. |
| Use supervised feature reduction | Prevent DataRobot from discarding low impact features. |
After setting any advanced options, scroll to the top of the page to begin modeling.
Use multiple time series
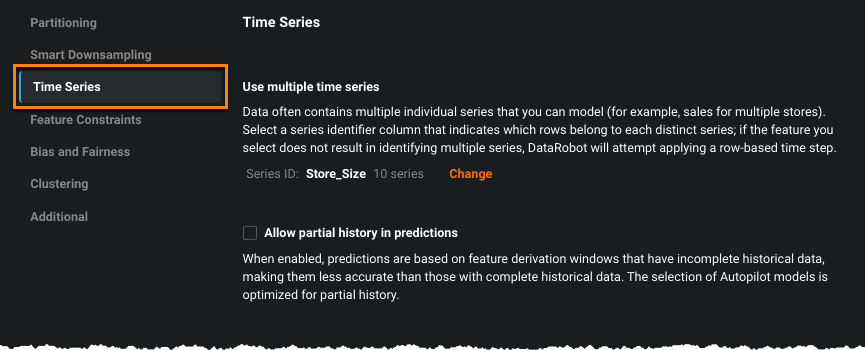
For multiseries modeling (automatically detected when the data has multiple rows with the same timestamp), you initially set the series identifier from the start page. You can, however, change it before modeling either by editing it on that page or editing on this section of the Advanced Options > Time Series tab:
Allow partial history
Not all blueprints are designed to predict on new series with only partial history, as it can lead to suboptimal predictions. This is because for those blueprints the full history is needed to derive the features for specific forecast points. "Cold start" is the ability to model on series that were not seen in the training data; partial history refers to prediction datasets with series history that is only partially known (historical rows are partially available within the feature derivation window). When Allow partial history is checked, this option "instructs" Autopilot to run those blueprints optimized for cold start and also for partial history modeling, eliminating models with less accurate results for partial history support.
Enable cross-series feature generation
In multiseries datasets, time series features are derived, by default, based on historical observations of each series independently. For example, a feature “Sales (7 day mean)” calculates the average sales for each store in the dataset. Using this method allows a model to leverage information across multiple series, potentially yielding insight into recent overall market trends.
It may be desirable to have features that consider historical observations across series to better capture signals in the data, a common need for retail or financial market forecasting. To address this, DataRobot allows you to extract rolling statistics on the total target across all series in a regression project. Some examples of derived features using this capability:
- Sales (total) (28 day mean): total sales across all stores within a 28 day window
- Sales (total) (1st lag): latest value of total sales across all stores
- Sales (total) (naive 7 day seasonal value): total sales 7 days ago
- Sales (total) (7 day diff) (28 day mean): average of 7-day differenced total sales in a 28 day window
Note
Cross-series feature generation is an advanced feature and most likely should only be used if hierarchical models are needed. Use caution when enabling it as it may result in errors at prediction time. If you do choose to use the feature, all series must be present and have the same start and end date, at both training and prediction time.
To enable the feature, select Enable cross-series feature generation. Once selected:
-
Set the aggregation method to either total or average target value. As it builds models, DataRobot will generate, in addition to the diffs, lags, and statistics it generates for the target itself, features labeled
target (average) ...ortarget (total) ..., based on your selection. -
(Optional) Set a column to base group aggregation on, for use when there are columns that are meaningful in addition to a series ID. For example, consider a dataset that consists of stock prices over time and that includes a column labeling the industry of the given stock (for example, tech, healthcare, manufacturing, etc.). By entering
industryas the optional grouping column, target values will be aggregated by industry as well as by the total or average across all series.When there is no cross-series group-by feature selected, there is only one group—all series.
The resulting features DataRobot builds are named in the format
target(groupby-feature average)ortarget (groupby-feature total). If the "group-by" field is left blank, the target is only aggregated across all series. -
Hierarchical models are enabled for datasets with non-negative target values when cross-series features are generated by using total aggregation. These two-stage models generate the final predictions by first predicting the total target aggregated across series, then predicting the proportion of the total to allocate to each series. DataRobot's hierarchical blueprints apply reconciliation methods to the results, correcting for results where the prediction proportions don't add up to 1. To do this, DataRobot creates a new hierarchical feature list. When running Autopilot, DataRobot only runs hierarchical models using the hierarchical feature list. For user-initiated model builds, you can select any feature list to run a hierarchical model or you can use the hierarchical feature list on other model types. Be aware that results from these options may not yield the best results however.
Note
If cross-series aggregation is enabled:
- All series data must be included in the training dataset. That is, you cannot introduce new series data at prediction time.
- The ability to create a job definition for all ARIMA and non-ARIMA cross-series models is disabled.
Set "known in advance" (KA)
Variables for which you know the value in advance (KA) and that do not need to be lagged can be added for different handling from Advanced options prior to model building. You can add any number of original (parent) features to this list of known variables (i.e., user-transformed or derived features cannot be handled as KA). By informing DataRobot that some variables are known in advance and providing them at prediction time, forecast accuracy is significantly improved (e.g., better forecasts for public holidays or during promotions).
If a feature is flagged as known, its future value needs to be provided at prediction time or predictions will fail. While KA features can have missing values in the prediction data inside of the forecast window, that configuration may affect prediction accuracy. DataRobot surfaces a warning and also an information message beneath the affected dataset.
Deep dive: Known in advance
For time series problems, DataRobot takes original features, lags them, and creates rolling statistics from the history available. Some features, however, are known in advance and their future value can be provided and used at prediction time. For those features, in addition to the lags and rolling statistics, DataRobot will use the actual value as the modeling data.
Holidays are a good example of this—Christmas is on December 25 this year. Or, last week was Christmas. Is December 25 a holiday 0=true, 1=false? Because the value of that variable will always be true on that date, you can use the actual, known, real-time value. Sales promotions are another good example. Knowing that a promotion is planned for next week, by flagging the promotion variable as a "known in advance" variable, DataRobot will:
- exploit the information from the past (that a promotion also happened last week)
- when generating the forecast for next week, leverage the knowledge that a promotion is planned.
If the variable is not flagged as known in advance, DataRobot will ignore the promotion schedule knowledge and forecast quality might be affected.
Because DataRobot cannot know which variables are known in advance, the default for forecasting is that no features are marked as such. Nowcasting, by contrast, adds all covariate features to the KA list by default (although the list can be modified).
Tip
See the section below for information that helps determine whether to use a calendar event file or to manually add the calendar event and set it to known in advance.
Exclude features from derivation
DataRobot's time series functionality derives new features from the modeling data and creates a new modeling dataset. There are times, however, when you do not want to automate time-based feature engineering (for example, if you have extracted your own time-oriented features and do not want further derivation performed on them). For these features, you can exclude them from derivation from the Advanced options link. Note that the standard automated transformations, part of EDA1, are still performed.
You can exclude any feature from further derivation with the exception of:
See the section on adding features, immediately below. Also, consider excluding features from modeling feature lists after derivation.
Add/identify known or excluded features
To add a feature, either:
- Begin typing in the box to filter feature names to match your string, select the feature, and click Add. Repeat for each desired features.
-
Click Add All Features to add every feature from the dataset.
To remove a feature, click the x to the right of the feature name; to clear all features click Clear Selections.
-
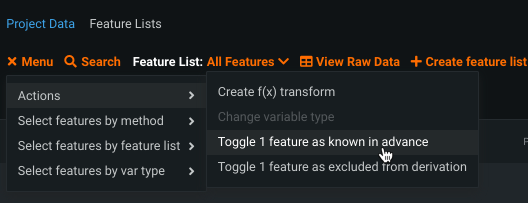
From the EDA1 data table (data prior to clicking Start), check the boxes to the left of one or more features and, from the menu, choose Actions > Toggle x features as... (known in advance or excluded from derivation). To remove a feature, check the box and toggle the selection.
Known in advance and excluded from derivation features must be set separately.
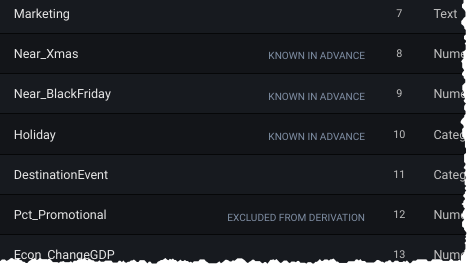
Features that are known in advance or excluded from derivation are marked as such in the raw features list prior to pressing Start:
Calendar files
Calendars provide a way to specify dates or events in a dataset that require additional attention. A calendar file lists different (distinct) dates and their labels, for example:
date,holiday
2019-01-01,New Year's Day
2019-01-21,Martin Luther King, Jr. Day
2019-02-18,Washington's Birthday
2019-05-27,Memorial Day
2019-07-04,Independence Day
2019-09-02,Labor Day
.
.
.
When provided, DataRobot automatically derives and creates special features based on the calendar events (e.g., time until the next event, labeling the most recent event). The Accuracy Over Time chart provides a visualization of calendar events along the timeline, helping to provide context for predicted and actual results.
Multiseries calendars (supported for uploaded calendars only) provide additional capabilities for multiseries projects, allowing you to add events per series.
Tip
See the section below for information that helps determine whether to use a calendar event file or to manually add the calendar event and set it to KA.
Specify a calendar file
You can specify a calendar file containing a list of events relevant to your dataset in one of two ways:
-
Use your own file, either by uploading a local file or using a calendar saved to the AI Catalog.
-
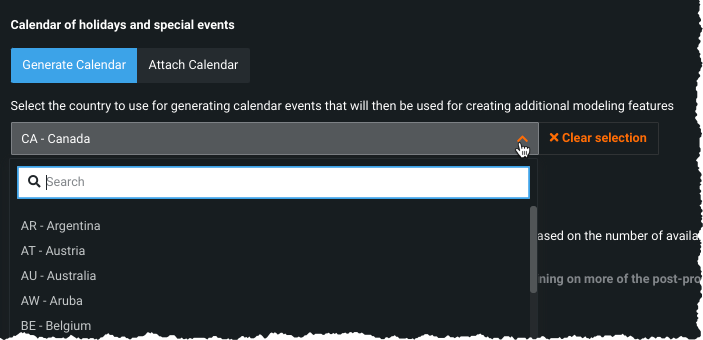
Generate a preloaded calendar based on country code.
Once used, regardless of the selection method, all calendars are stored in the AI Catalog. From there, you can view and download any calendar. See the AI Catalog for complete information.
Upload your own calendar file
When uploading your own file, you can define calendar events in the best format for your data (that also aligns with DataRobot's recognized formats) or, optionally, specified in ISO 8601 format.
The date/time format must be consistent across all rows. The following table shows sample dates and durations.
| Date | Event name | Event Duration* |
|---|---|---|
| 2017-01-05T09:30:00.000 | Start trading | P0Y0M0DT8H0M0S |
| 2017-01-08T00:00:00.003 | Sensor on | PT10H |
| 2017-12-25T00:00:00.000 | Christmas holiday | |
| 2018-01-01T00:00:00.000 | New Year's day | P1D |
* There is no support for ISO weeks (e.g., P5W).
The event duration field is optional. If not specified, DataRobot assigns a duration based on the time unit found in the uploaded data.
| When the detected time unit for the uploaded data is... | Default event duration, if not specified, is... |
|---|---|
| Year, quarter, month, day | 1 day (P1D) |
| Day, hour, minute, second, millisecond | 1 millisecond (PT0.001S) |
See the calendar file requirements for more detail.
Deep dive: Setting duration
When determining duration (to/from, next/previous), derived features reference the present point in time, where (1) is the duration to next calendar event and (2) is the duration from the previous/current calendar event.
These features can provide information such as:
- How long since the promotion ended?
- When should the next machine downtime be scheduled?
To ensure accuracy, DataRobot provides guardrails to support calendar-derived features based on calendar events that can overlap. In the event of overlap, DataRobot first considers the event of shorter duration and then uses lexical order as the determinator.
Following are examples of how DataRobot uses event duration and lexical order to handle overlapping events:
Derived features referenced to (a):
- (1) Next calendar event type = Event G, as it has the shortest duration. If Event G is absent, lexical order promotes Event A over Event D.
- (2) Previous calendar event type = Event B
Derived features referenced to (b):
- (3) Next calendar event type = Event B
- (4) Previous calendar event type = Event C
Derived features referenced to (c):
- (5) Next calendar event type = Event E
- (6) Previous calendar event type = Event G, as it has the shortest duration. If Event G is absent, lexical order promotes Event A over Event D.
Calendar file requirements
When uploading your own calendar file, note that the file:
-
Must have one date column.
-
The date/time format should be consistent across all rows.
-
Must span the entire training data date range, as well as all future dates in which any models will be forecasting.
-
If directly uploaded via a local file, must be in CSV or XLSX format with a header row. If it comes from the AI Catalog, it can be from any supported file format as long as it meets the other data requirements and the columns are named.
-
Cannot be updated in an active project. You must specify all future calendar events at project start or if you did not, train a new project.
-
Can optionally include a second column that provides the event name or type.
-
Can optionally include a column named
Event Durationthat specifies the duration of calendar events. -
Can optionally include a series ID column that specifies which series an event is applicable to. This column name must match the name of the column set as the series ID.
- Multiseries ID columns are used to add an ability to specify different sets of events for different series (e.g., holidays for different regions).
- Values of the series ID may be absent for specific events. This means that the event is valid for all series in the project dataset (e.g., New Year's Day is a holiday in all series).
- If a multiseries ID column is not provided, all listed events will be applicable to all series in the project dataset.
Within the app, click See file requirements to display an infographic summarizing the format of the calendar file.
Best practice column order
- Single series calendars: Date/time, Calendar Events, Event Duration.
- Multiseries calendars: Date/time, Calendar Events, Series ID, Event Duration.
Note that the duration column must be named Event Duration; other columns have no naming requirements.
Use a preloaded calendar file
To use a preloaded calendar, simply select the country code from the dropdown. DataRobot automatically generates a calendar that covers the span of the dataset (start and end dates).
Preloaded calendars are not available for multiseries projects. To include series-specific events, use the Attach Calendar method.
Calendar file or KA?
There are times when you can handle dates either by uploading a calendar event file or manually adding the calendar event as a categorical feature and setting it as KA. In other words, you can:
- Enter calendar events as columns in your dataset and set them as KA.
- Import events as a calendar.
The following are differences to consider when choosing a method:
- Calendars must be daily; if you need a more granular time step, you must use KA.
- DataRobot generates additional features from calendars, such as "days until" or "days after" a calendar event.
- Calendar events must be known into the future at training time; KA features must be known into the future at predict time.
- For KA, when deploying predictions you must generate the KA features for each prediction request.
- Calendar events in a multiseries project can apply to a specific series or to all series.
Customize model splits
Use the Customize splits option to set the number of splits—groups of models trained— that a given model takes. Set this advanced option based on the number of available workers in your organization. With fewer workers, you may want to have fewer splits so that some workers will be available for other processing. If you have a large number of workers, you can set the number higher, which will result in more jobs in the queue.
Note
The maximum number of splits is dependent on DataRobot version. Managed AI Platform users can configure a maximum of five splits; Self-Managed AI Platform users can configure up to 10.
Splits are a group of models that are trained on a set of derived features that have been downsampled. Configuring more splits results in less downsampling of derived features and therefore training on more of the post-processed data. Working with more post-processed data, however, results in longer training times.
Treat as exponential trend
Accounting for an exponential trend is valuable when your target values rise or fall at increasingly higher rates. A classic example of an exponential trend can be seen in forecasting population size—the size of the population in the next generation is proportional to the size of the previous generation. What will the population be in five generations?
When DataRobot detects exponential trends, it applies a log-transformation to the target feature. DataRobot automatically detects exponential trends and applies a log transform, but you can force a setting if desired. To determine whether DataRobot applied a log transform (e.g., detected an exponential trend) to the target, review the derived, post-EDA2 data. If it was applied, features involving the target have a suffix (log) (for example, Sales (log) (naive 7 day value)). If you want a different outcome, reload the data and set exponential trends to No.
Exponentially weighted moving average
An exponentially weighted moving average (EWMA) is a moving average that places a greater weight and significance on the most recent data points, measuring trend direction over time. The "exponential" aspect indicates that the weighting factor of previous inputs decreases exponentially. This is important because otherwise a very recent value would have no more influence on the variance than an older value.
In regression projects, specify a value between 0 and 1 and it is applied as a smoothing factor (lambda). Each value is weighted by a multiplier; the weight is a constant multiplier of the prior time step's weight.
With this value set, DataRobot creates:
- New derived features, identified by the addition of
ewmato the feature name. - An additional feature list: With Differencing (ewma baseline).
Apply differencing
DataRobot automatically detects whether or not a project's target value is stationary. That is, it detects whether the statistical properties of the target are constant over time (stationary). If the target is not stationary, DataRobot attempts to make it stationary by applying a differencing strategy prior to modeling. This improves the accuracy and robustness of the underlying models.
If you want to force a differencing selection, choose one of the following:
| Setting | Description |
|---|---|
| Auto-detect (default) | Allows DataRobot to apply differencing if it detects that the data is non-stationary. Depending on the data, DataRobot applies either simple differencing or seasonal differencing if periodicity is detected. |
| Simple | Sets differencing based on the delta from the most recent, available value inside the feature derivation window. |
| Seasonal | Sets differencing using the specified time step instead of using the delta from the last available value. The increment of the time step is based on the detected time unit of the data. |
| No | Disable differencing for this project. |
Apply weights
In some time series projects, the ability to define row weights is critical to the accuracy of the model. To apply weights to a time series project, use the Additional tab of advanced options.
Once set, weights are included (as applicable) as part of the derived feature creation. The weighted feature is appended with (actual) and the Importance column identifies the selection:
The actual row weighting happens during model training. Time decay weight blueprints, if any, are multiplied with your configured weight to produce the final modeling weights.
The following derived time series features take weights into account (when applicable):
- Rolling average
- Rolling standard deviation
The following time series features are derived as usual, ignoring weights:
- Rolling min
- Rolling max
- Rolling median
- Rolling lags
- Naive predictions
Use supervised feature reduction
Enabled by default, supervised feature reduction discards low-impact features prior to modeling. When identified features are removed, the resulting optimized feature set provides better runtimes with similar accuracy. Model interpretability is also improved as the focus is on only impactful features. When disabled, the feature generation process results in more features but also longer model build times. See also the section on restoring features discarded during feature reduction.


