Feature details
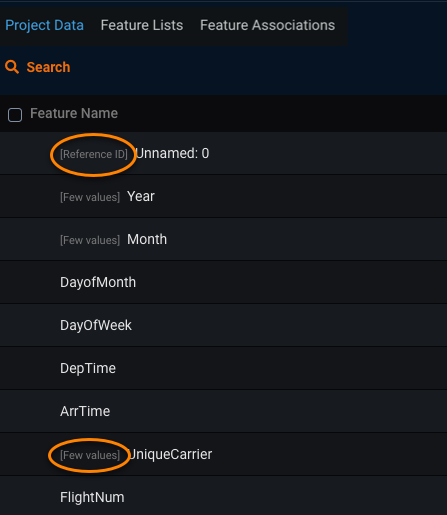
The Data page displays tags to indicate a variety of information that DataRobot uncovered while computing EDA1. You can also click a feature name to view its details.
Informational tags
Informational tags on the Data page include:
| Tag | Description |
|---|---|
| Duplicate | A feature column is duplicated in the ingest dataset. |
| Empty | Column contains no values. |
| Few values | Too few values, relative to the size of the dataset, for DataRobot to extrapolate meaningful information from the feature. Not an indicator of the number of unique values, but instead domination of a single value, making the feature inappropriate for modeling. Specifically:
|
| Too many values | Too many values, relative to the size of the dataset, for DataRobot to extrapolate meaningful information from the feature. For categorical features, the label is applied if: [ number of unique values ] > [ number of rows] / 2 | |
| Reference ID* | Column contains reference IDs (unique sequential numbers). |
| Associated with Target | Column was derived from target column. |
| Target leakage | Indicates a feature whose value cannot be known at the time of prediction. |
* Reference ID calculations
A feature is considered a reference ID if all of the following apply:
- The feature is an integer and not a date.
- The number of rows in the data is greater than 2000.
- Feature values are unique (
[ number of unique values] = [number of rows]) - Feature values are "compact." That is, the highest and lowest values are not more than
100 * rowsapart.
Available feature details
Once DataRobot displays features on the Data page, you can click a feature name to view its details and also (in some cases) modify its type. The options available are dependent on variable type:
| Option | Description | Variable Type |
|---|---|---|
| Tabs | ||
| Histogram | Buckets numeric feature values into equal-sized ranges to show a rough distribution of the variable. | numeric, summarized categorical, multicategorical |
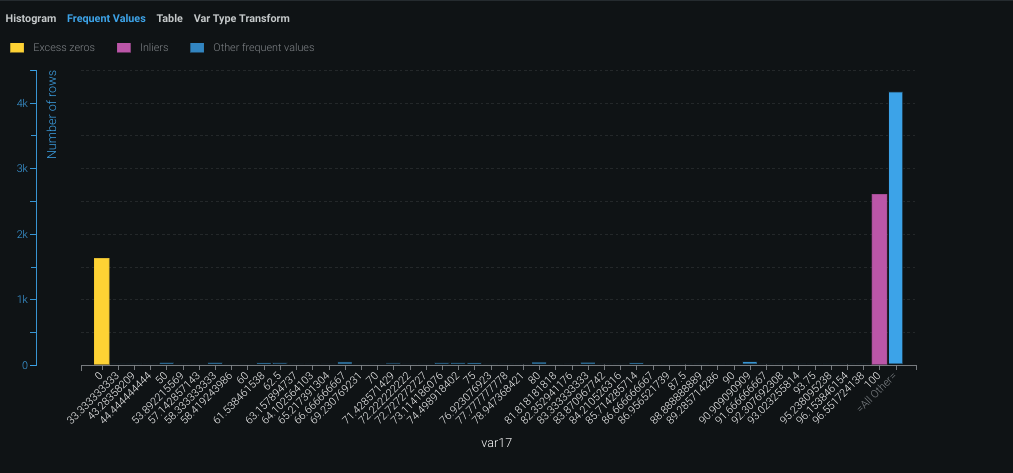
| Frequent Values | Plots the counts of each individual value for the most frequent values of a feature. If there are more than 10 categories, DataRobot displays values that account for 95% of the data; the remaining 5% of values are bucketed into a single "All Other" category. | numeric, categorical, text, boolean |
| Table | Provides a table of feature values and their occurrence counts. Note that if the value displayed contains a leading space, DataRobot includes a tag, leading space, to indicate as much. This is to help clarify why a particular value may show twice in the histogram (for example, 36 months and 36 months are both represented). | numeric, categorical, text, boolean, summarized categorical, multilabel |
| Illustration | Shows how summarized categorical data—features that host a collection of categories—is represented as a feature. See also the summarized categorical tab differences for information on Overview and Histogram. | summarized categorical |
| Category Cloud | After EDA2 completes, displays the keys most relevant to their corresponding feature in Word Cloud format. This is the same Word Cloud that is available from the Category Cloud on the Insights page. From the Data page you can more easily compare Clouds across features; on the Insights page you can compare Word Clouds for a project's categorically-based models. | summarized categorical |
| Feature Statistics | Reports overall multilabel dataset characteristics, as well as pairwise statistics for pairs of labels and the occurrence percentage of each label in the dataset. | multilabel |
| Over Time (time-aware only) | Identifies trends and potential gaps in data by displaying, for both the original modeling data and the derived data, how a feature changes over the primary date/time feature. | numeric, categorical, text, boolean |
| Feature Lineage (time series) or (Feature Discovery) | Provides a visual description of how a derived feature was created. | numeric, categorical, text, boolean |
| Actions | ||
| Var Type Transform | Provides a dialog to modify the variable type. (Not shown if the variable type for this feature was previously transformed.) | numeric, categorical, text |
| Transformation | Shows details for a selected transformed feature and a comparison of the transformed feature with the parent feature. (Applies to transformed features only.) | numeric, boolean |
Note
The values and displays for a feature may differ between EDA1 and EDA2. For EDA1, the charts represent data straight from the dataset. After you have selected a target and built models, the data calculations may have fewer rows due to, for example, holdout or missing values. Additionally, after EDA2 DataRobot displays average target values which are not yet calculated for EDA1.
Histogram chart
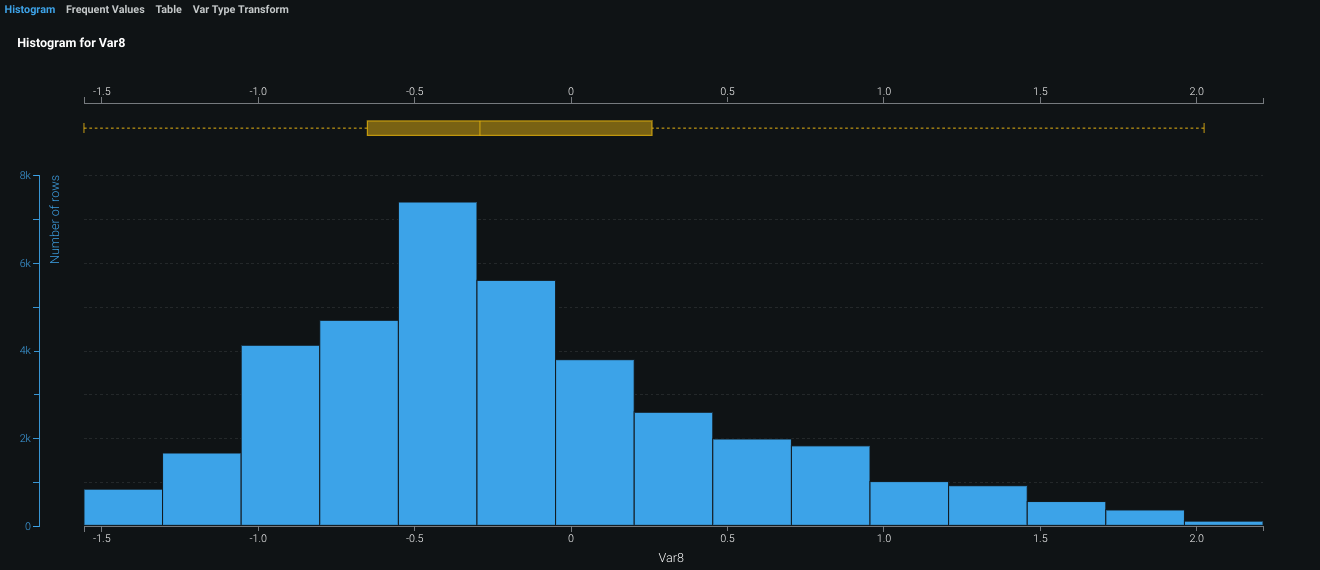
The Histogram chart is the default display for numeric features. It "buckets" numeric feature values into equal-sized ranges to show frequency distribution of the variable—the target observation (left Y-axis) plotted against the frequency of the value (X-axis). The height of each bar represents the number of rows with values in that range.
Histogram display variations
The display differs depending on whether the data quality issue "Outliers" was found.
Without data quality issues:
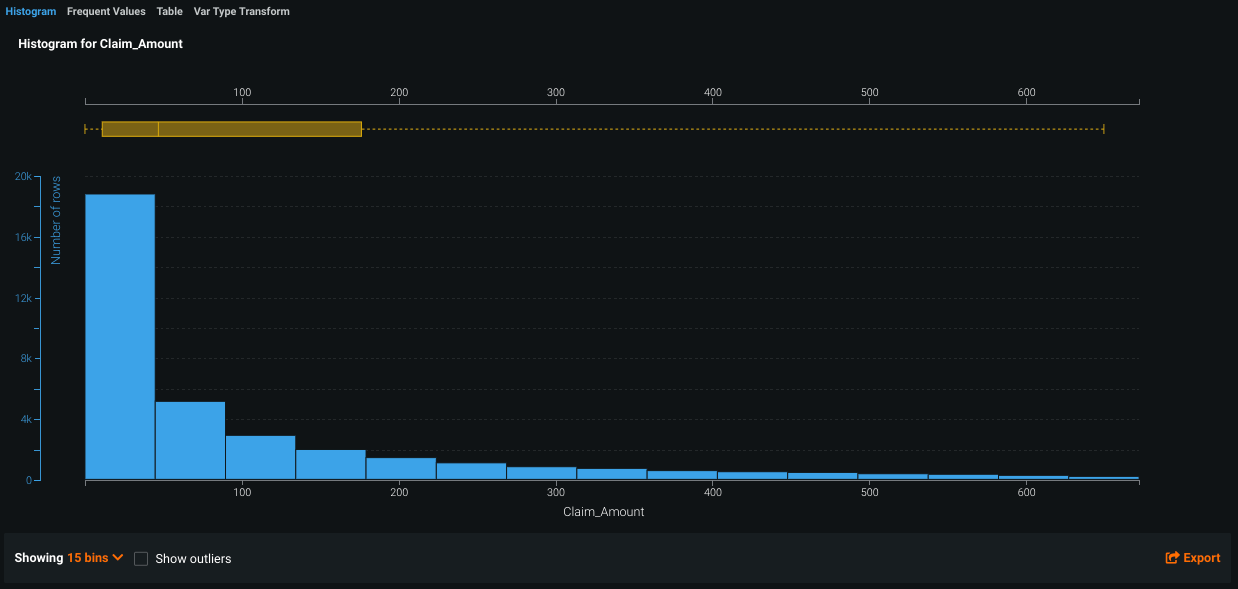
With data quality issues:
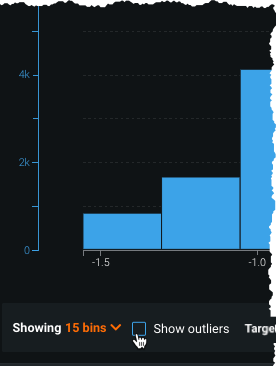
Initially, the display shows the bucketed data:
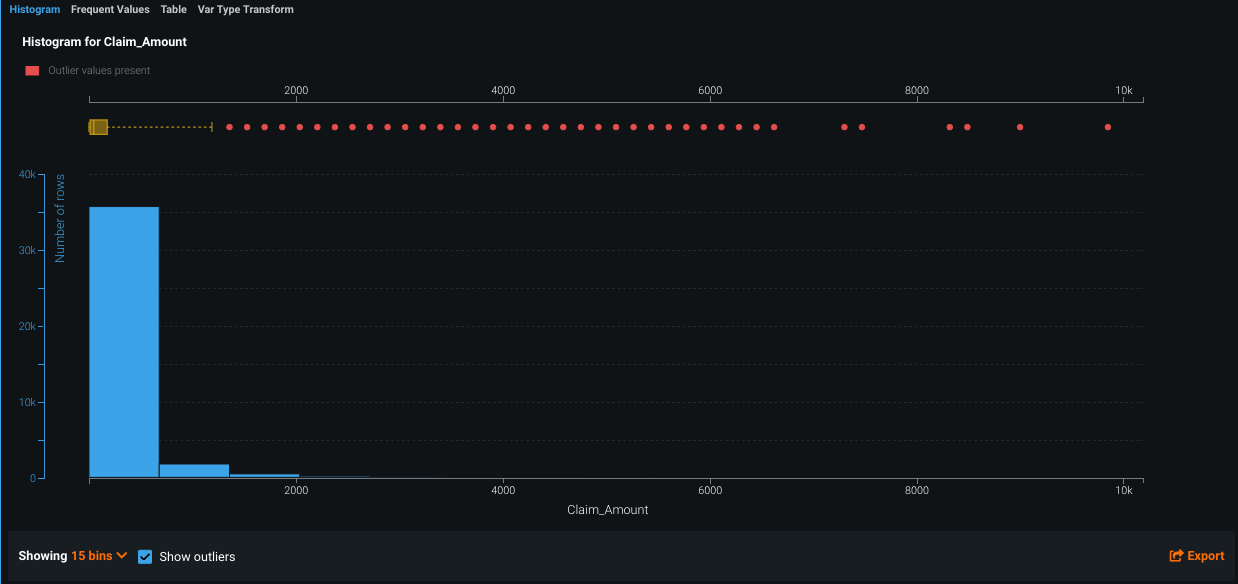
Select the Show outliers checkbox to calculate and display outliers:
The traditional box plot above the chart (shown in gold) highlights the middle quartiles for the data to help you determine whether the distribution is skewed. To determine whisker length, DataRobot uses Ueda's algorithm to identify the outlier points—the whiskers depict the full range for the lowest and highest data points in the dataset excluding those outliers. This is useful for helping to determine whether a distribution is skewed and/or whether the dataset contains a problematic number of outliers.
Note the change in the X-axis scale and compression of the box plot to allow for outlier display. Because there tend to be fewer rows recording an outlier value (it's what makes them outliers), the blue bar may not display. Hover on that column to display a tooltip with the actual row count.
After EDA2 completes, the histogram also displays an average target value overlay.
Calculate outliers
Outliers, the observation points at the far ends of the sample mean, may be the result of data variability. They can also represent data error, in which case you may want to exclude them from the histogram. Outlier detection—run as part of EDA1 using a combination of heuristics—is strictly a histogram visualization tool and does not influence the modeling process.
Check the Show outliers box and to initiate a calculation identifying the rows containing outliers. DataRobot then re-displays the histogram with outliers included:
Outliers are generally calculated as a collection of two ranges:
p25represents the values in the first quartile of a data distribution.p75represents the values in the third quartile of a data distribution.IQRis the Interquartile Range, equal to the difference of the first quartile subtracted from the third quartile:IQR = p75-p25.
The ranges are then calculated as the first quartile minus IQR (p25-IQR) and the third quartile plus IQR (p75+IQR). Note that this is a general overview of outlier calculation. Additional calculations are required depending on how these ranges compare to the minimal and maximal values of the data distribution. There are also additional heuristics used for corner cases that cover how DataRobot calculates IQR and the final values of the outlier threshold.
Frequent Values chart
The Frequent Values chart, in addition to showing common values, reports inliers, disguised missing values, and excess zeros.
Summarized categorical features
The summarized categorical variable type is used for features that host a collection of categories (for example, the count of a product by category or department). If your original dataset does not have features of this type, DataRobot creates them (where appropriate as described below) as part of EDA2. The summarized categorical variable type offers unique feature details in its Overview, Histogram, Category Cloud, and Table tabs.
Note
You cannot use summarized categorical features as your target for modeling.
Required dataset formatting
For features to be detected as the summarized categorical variable type (shown in the Var Type column on the Data tab), the column in your dataset must be a valid JSON-formatted dictionary:
"Key1": Value1, "Key2": Value2, "Key3": Value3, ...
"Key":must be a string.Valuemust be numeric (an integer or floating point value) and greater than 0.- Each key requires a corresponding value. If there is no value for a given key, the data will not be usable.
- The column must be JSON-serializable.
The following is an example of a valid summarized categorical column:
{“Book1”: 100, “Book2”: 13}
An invalid summarized categorical column can look like any of the following examples:
-
{‘Book1’: 100, ‘Book2’: 12}- The key is not in quotation marks (not JSON-serializable).
-
{‘Book1’: ‘rate’,‘Book2’: ‘rate1’}- These values are strings instead of positive numeric values.
-
{“Book1”, “Book2”}- This example is not in JSON dictionary format.
Overview tab
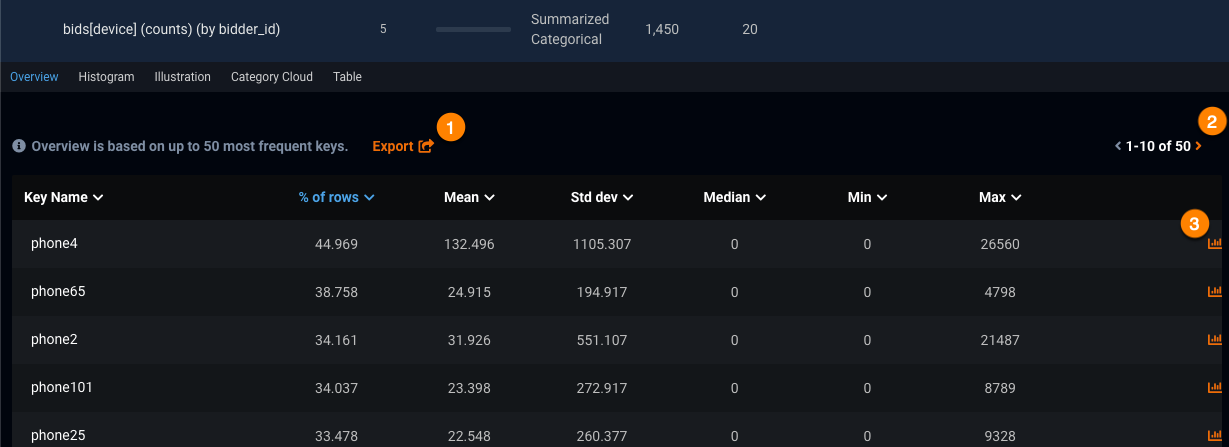
The Overview tab presents the top 50 most frequent keys for your feature. Each key displays the percentage of rows that it appears in, its mean, standard deviation, median, min, and max. You can sort the keys by any of these fields. Most of this information is available for other types of features in the columns on the Data page, but for summarized categorical features each individual key has its own values for these fields.
| Element | Description | |
|---|---|---|
| 1 | Export | Export the list of keys and their associated values as a PNG. You can choose to include the chart title in the image and edit the filename before you download it. |
| 2 | Page control | Move through pages of listed keys (10 keys per page). |
| 3 | Histogram icon | Access the histogram for a given key. |
Histogram tab
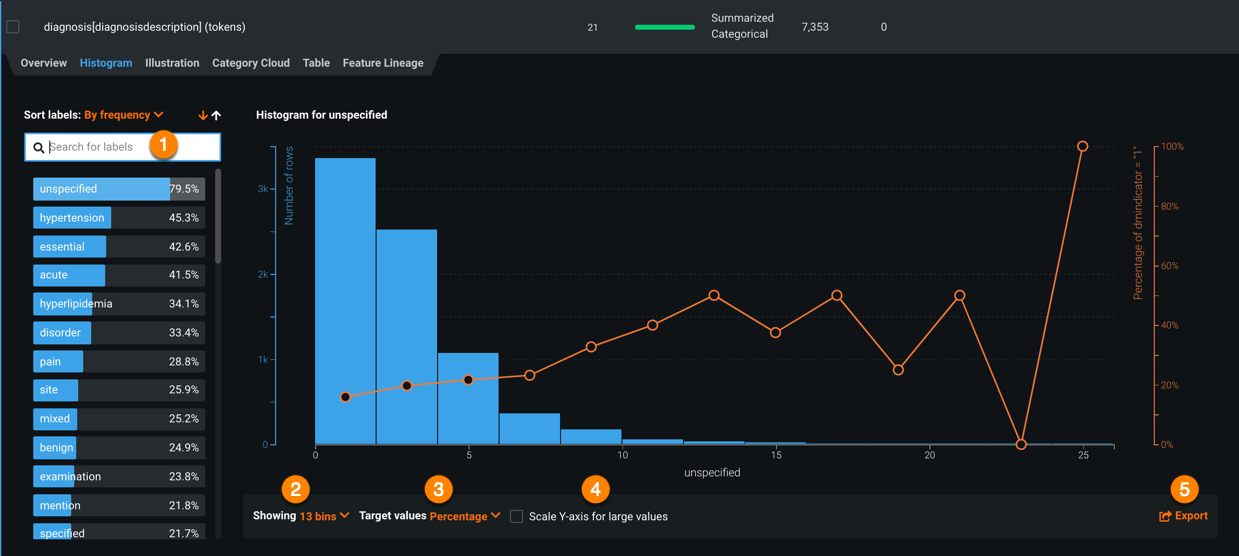
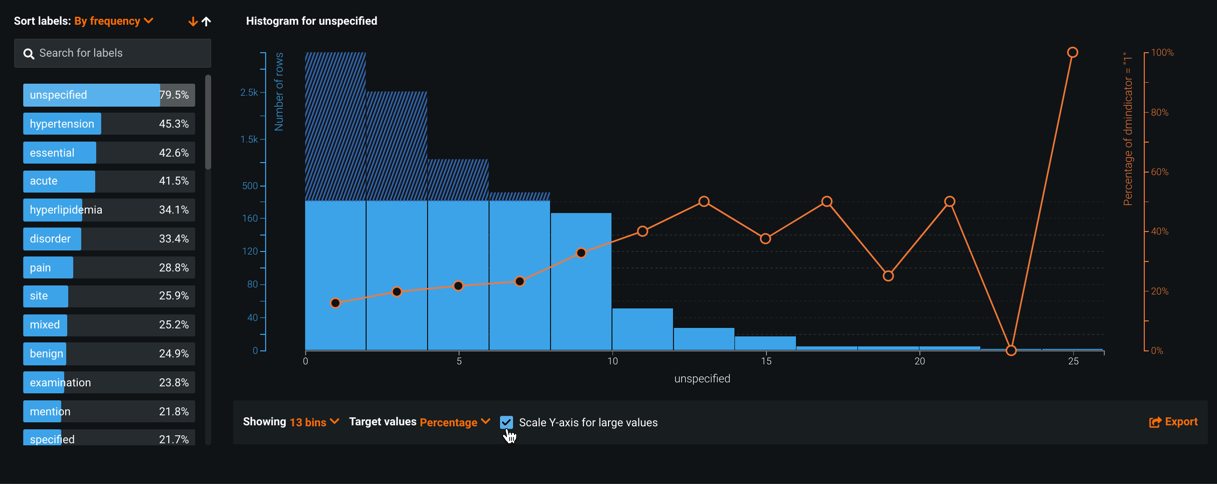
While most of the functionality for this tab is the same as described in the working with histograms section above, there are some differences unique to this variable type. The histograms displayed in this tab correspond to the individual labels (keys) of a feature instead of a feature itself. The list of keys can be sorted by percentage of occurrence in the dataset's rows or alphabetically.
| Element | Description | |
|---|---|---|
| 1 | Search | Searches for labels. |
| 2 | Showing | Changes the bin distribution. Select the number of bins to view. |
| 3 | Target values | Sets the basis of the target value display. |
| 4 | Scale Y-axis for large values | Reduces the number of rows measured in the Y-axis for large values. |
| 5 | Export | Exports the histogram. |
Note
DataRobot automatically filters out stopwords when calculating values for the histogram.
Viewing large values
The Scale the Y-axis for large values option reduces the number of rows measured in the Y-axis and improves the visualization of larger values—it is common that large numbers are only represented in a few rows. Resizing the histogram above results in:
By scaling the Y-axis, you can see that the greatest value measured has been greatly reduced. As a result, the number of rows across all values are more evenly represented.
Category Cloud
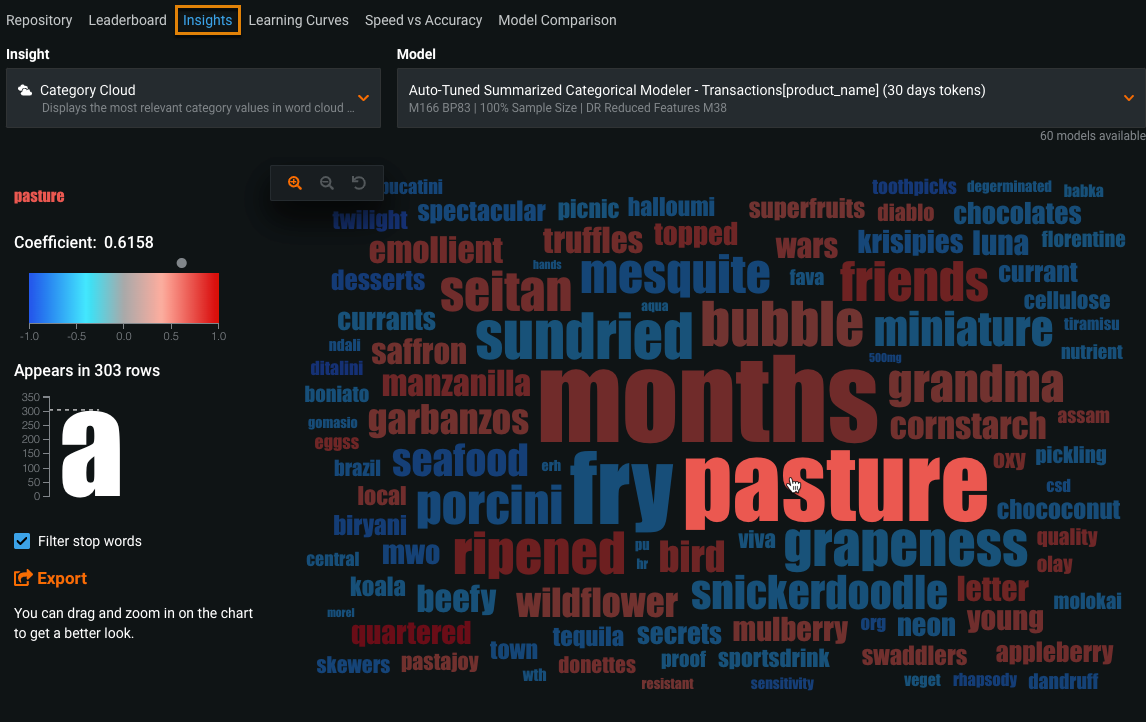
The Category Cloud tab provides insights into summarized categorical features. It displays as a word cloud and shows the keys that are most relevant to their corresponding feature.
Category Cloud availability
The Category Cloud insight is available on the Models > Insights tab and on the Data tab. On the Insights page, you can compare word clouds for a project's categorically-based models. From the Data page you can more easily compare clouds across features. Note that the Category Cloud is not created when using a multiclass target.
Keys are displayed in a color spectrum from blue to red, with blue indicating a negative effect and red indicating a positive effect. Keys that appear more frequently are displayed in a larger font size, and those that appear less frequently are displayed in smaller font sizes.
Check the Filter stop words box to remove stopwords (commonly used terms that can be excluded from searches) from the display. Removing these words can improve interpretability if the words are not informative to the Auto-Tuned Summarized Categorical Model.
Mouse over a key to display the coefficient value specific to that key and to read its full name (displayed with the information to the left of the cloud). Note that the names of keys are truncated to 20 characters when displayed in the cloud and limited to 100 characters otherwise.
Illustration tab
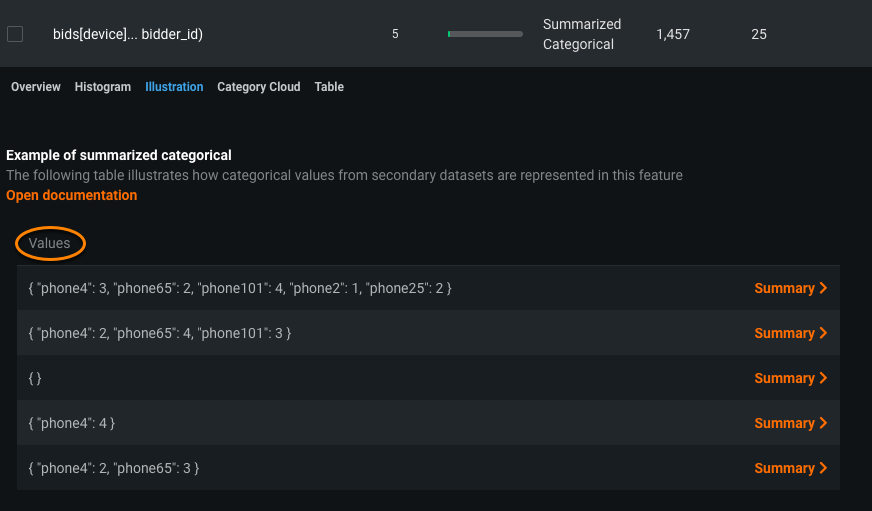
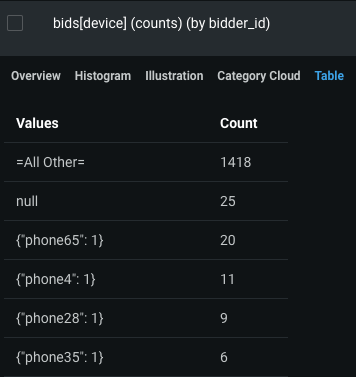
The Illustration tab shows how summarized categorical data is represented as a feature. For example, in the below image, the Values column contains five summarized categorical features displayed in JSON dictionary format (selected at random), as described above.
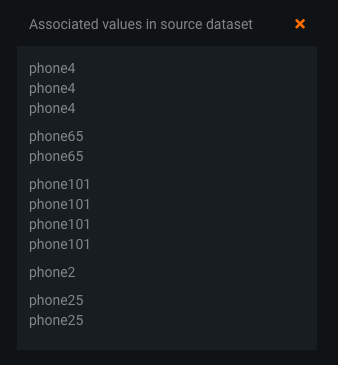
Click Summary to display a box that visualizes how categorical values appeared in their initial state, prior to being engineered as summarized categorical features.
Table tab
The Table tab, which is the default tab for multilabel projects, displays a two-column table detailing counts for the top 50 most frequent label sets in the multicategorical feature.
The table lists each key in the Values column, and the respective key's count in the Count column.
Unicode text in the Values column
If you are using Unicode text and it appears abnormal in the Values column, make sure your text is UTF8 encoded.
Average target values
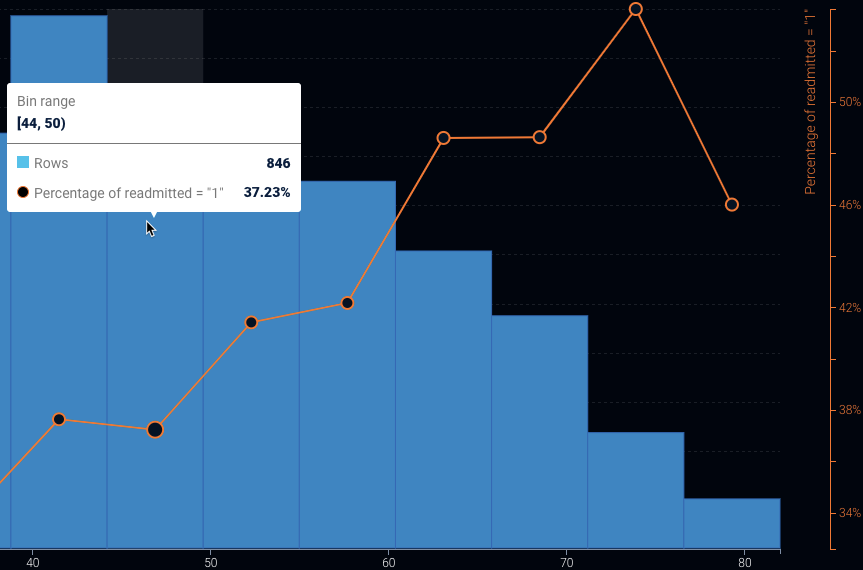
After EDA2, DataRobot displays orange circles as graph overlays on the Histogram and Frequent Values charts. The circles indicate the average target value for a bin. (These circles are connected for numeric features and not for categorical, since the ordering of categorical variables is arbitrary and histograms display a continuous range of values.)
For example, consider the feature num_lab_procedures:
In this example, there are 846 people who had between 44-49.999999 lab procedures. The average target value represented by the circle (in this case, the percent readmitted) is 37.23%. (The orange dots correspond to the right axis of the histogram.)
How Exposure changes output
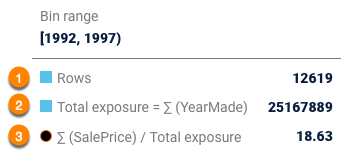
If you used the Exposure parameter when building models for the project, the Histogram and Frequent values tabs display the graphs adjusted to exposure. In this case:
- The number of rows (1) in each bin.
- The sum of exposure (2) in each bin. That is, the sum of the weights for all rows weighted by exposure.
- The sum of target value divided by the sum of the exposure (3) in a bin.
How Weight changes output
If you set the Weight parameter for a project, DataRobot weights the number of rows and average target values by weight.
