Accuracy Over Space
To assess model fidelity in a spatial setting, Location AI adds powerful model evaluation tools to DataRobot. Location AI insights help to discover spatial patterns in prediction errors and visualize prediction errors across data partitions on a map visualization. Location AI facilitates these insights through the Evaluate > Accuracy Over Space tab for an individual model.
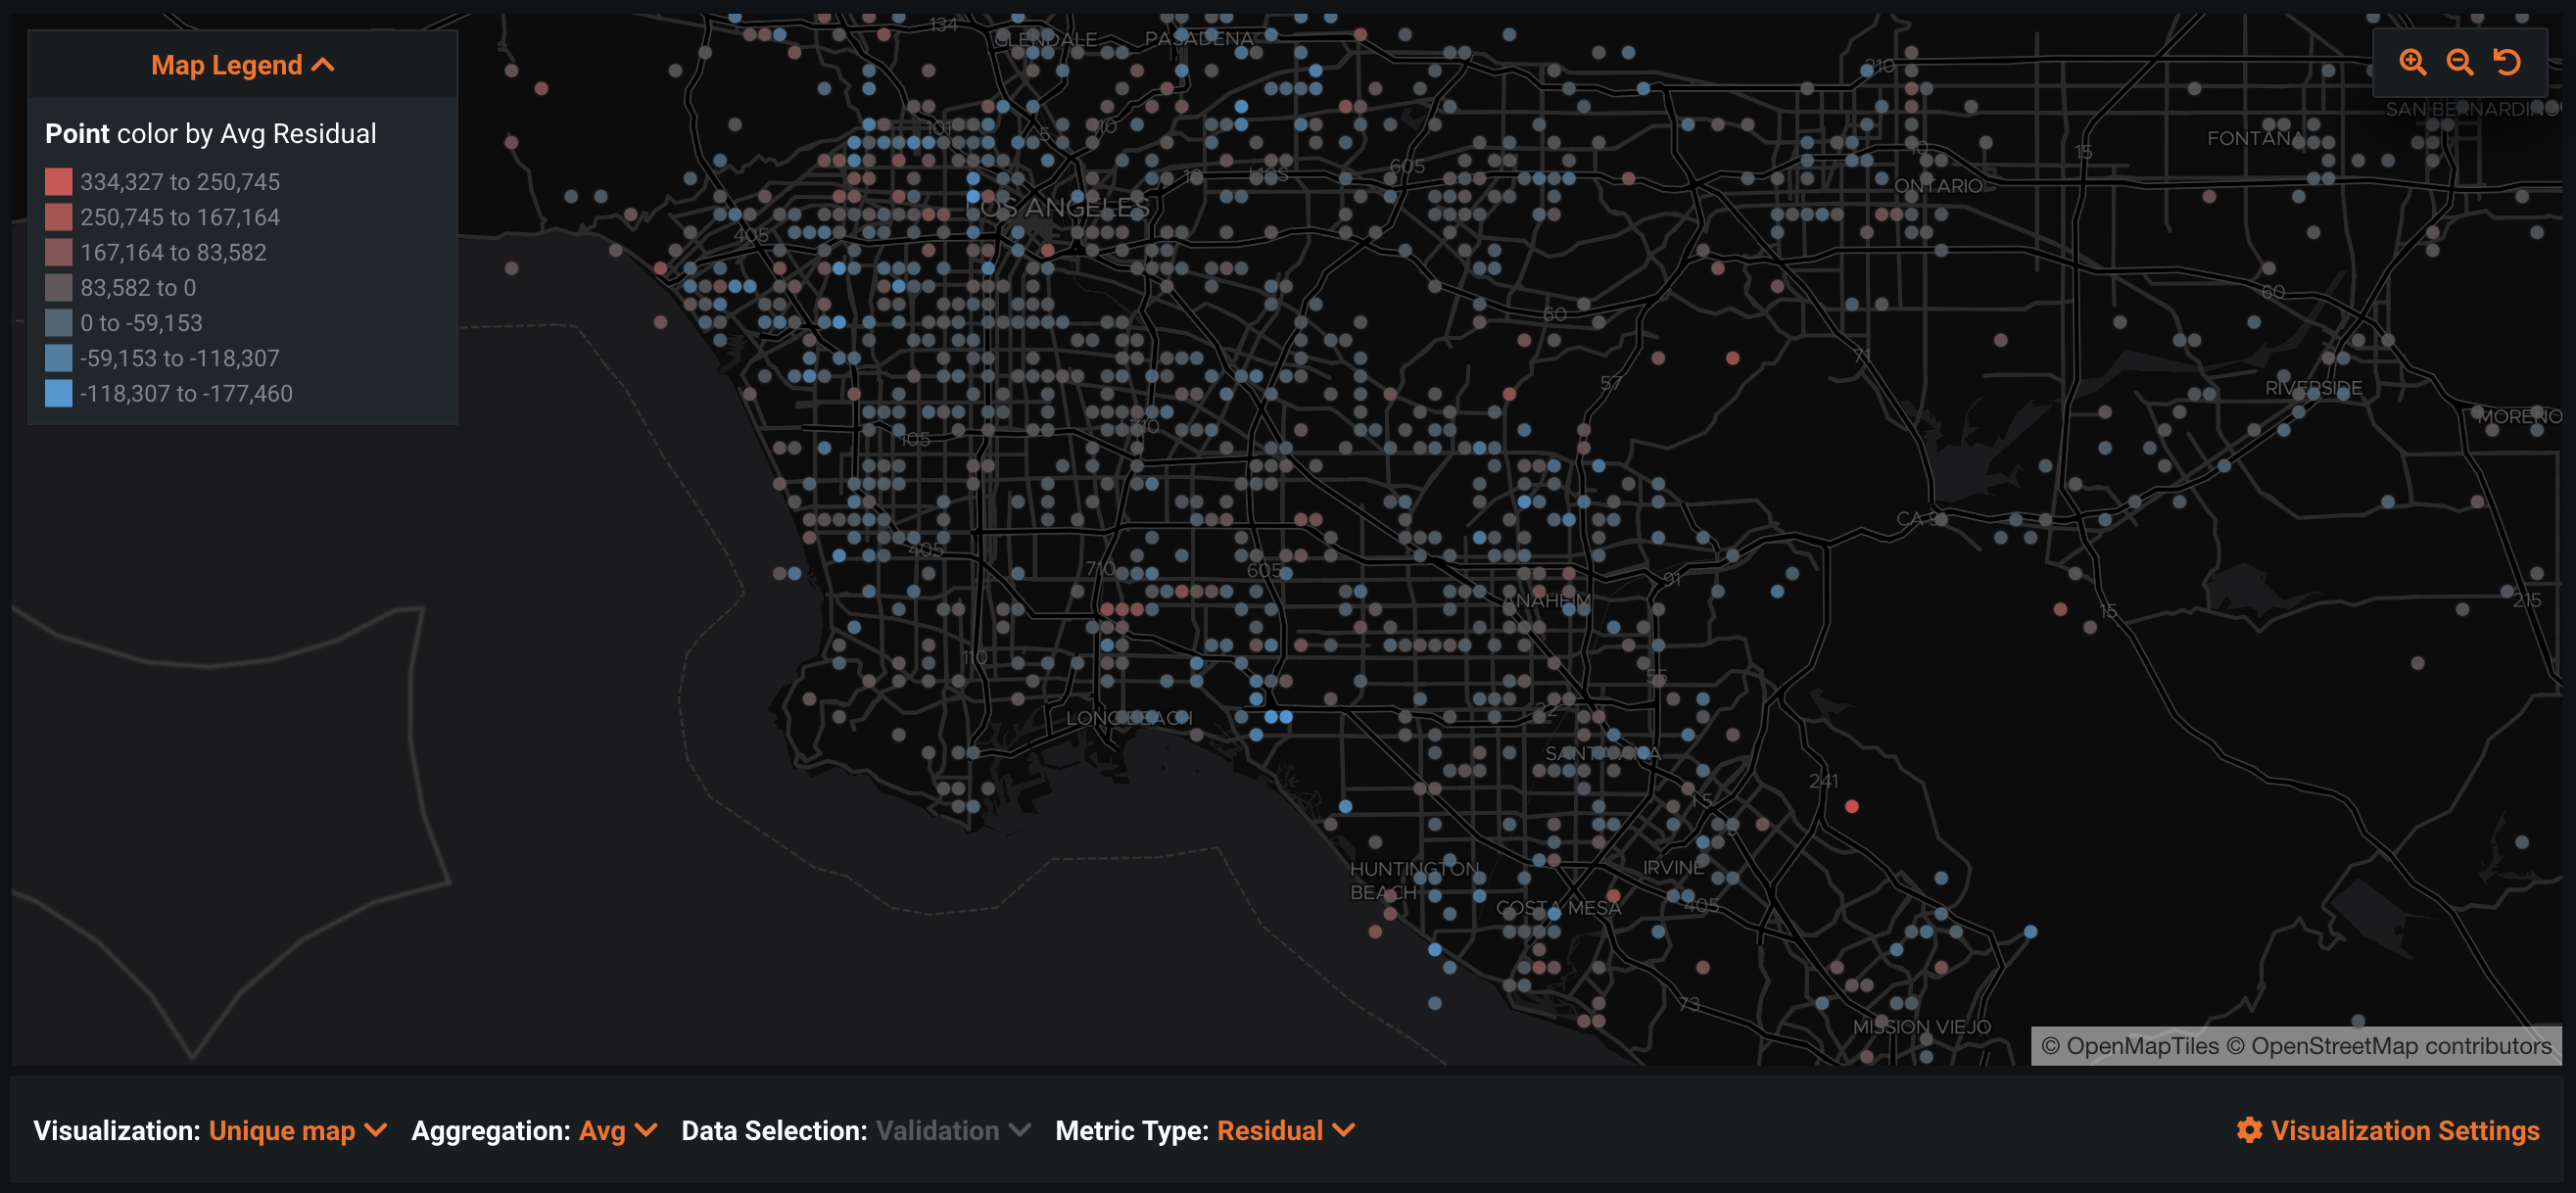
The Accuracy Over Space tab provides a spatial residual mapping within an individual model. It provides similar visualizations to Location AI ESDA, but allows you to explore prediction error metrics across all data partitions.
By default, Accuracy Over Space displays residual (prediction error) values on a unique map based on the validation partition. Co-located points are displayed using the average value of all points at that location. The visualization settings for the map can be adjusted in the same manner as Location AI ESDA visualizations. Additional settings for the tool include:
-
Data Selection: Sets which data partition to visualize, either validation, cross-validation, or holdout.
-
Metric Type: Sets the value to report at each location, either Residual, Actual, or Predicted.
-
Aggregation: Sets the arithmetic to use for co-located locations, either Avg, Min, Max, Count, or Value.
-
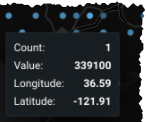
Count reports the count of each geometry in the dataset. It reports the sum of counts for a hexagon or grid map of a geometry feature.
-
Value: When all geometries have a count of 1, displays the feature value (no aggregation).
-
Accuracy Over Space also supports different map visualizations: Kernel density map, Hexagon map, and Heatmap.

