Time series insights
This section describes the visualizations available to help interpret your data and models, both prior to modeling and once models are built.
Prior to modeling
The following insights, with availability dependent on modeling stage, are available to help understand your data.
- EDA1: Over Time chart
- EDA2: Feature Lineage graph
Understand a feature's Over Time chart
The Over time chart helps you identify trends and potential gaps in your data by displaying, for both the original modeling data and the derived data, how a feature changes over the primary date/time feature. It is available for all time-aware projects (OTV, single series, and multiseries). For time series, it is available for each user-configured forecast distance.
Using the page's tools, you can focus on specific time periods. Display options for OTV and single-series projects differ from those of multiseries. Note that to view the Over time chart you must first compute chart data. Once computed:
-
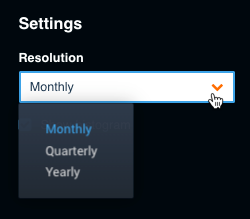
Set the chart's granularity. The resolution options are auto-detected by DataRobot. All project types allow you to set a resolution (this option is under Additional settings for multiseries projects).
-
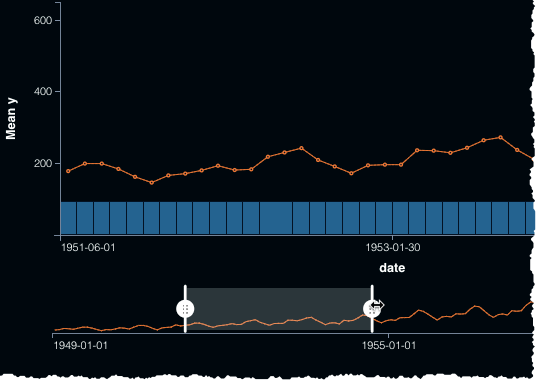
Toggle the histogram display on and off to see a visualization of the bins DataRobot is using for EDA1.
-
Use the date range slider below the chart to highlight a specific region of the time plot. For smaller datasets, you can drag the sliders to a selected portion. Larger datasets use block pagination.
-
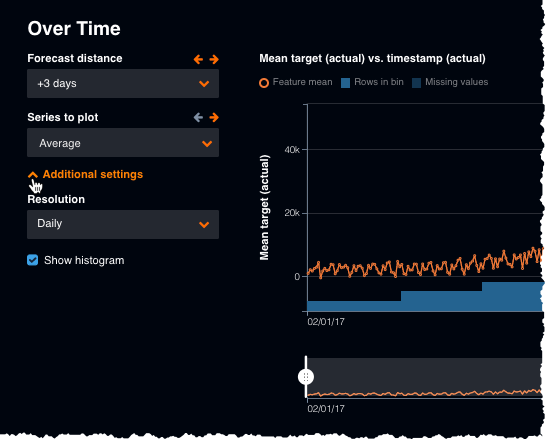
For multiseries projects, you can set both the forecast distance and an individual series (or average across series) to plot:
For time series projects, the Data page also provides a Feature Lineage chart to help understand the creation process for derived features.
Partition without holdout
Sometimes, you may want to create a project without a holdout set, for example, if you have limited data points. Date/time partitioning projects have a minimum data ingest size of 140 rows. If Add Holdout fold is not checked, minimum ingest becomes 120 rows.
By default, DataRobot creates a holdout fold. When you toggle the switch off, the red holdout fold disappears from the representation (only the backtests and validation folds are displayed) and backtests recompute and shift to the right. Other configuration functionality remains the same—you can still modify the validation length and gap length, as well as the number of backtests. On the Leaderboard, after the project builds, you see validation and backtest scores, but no holdout score or Unlock Holdout option.
The following lists other differences when you do not create a holdout fold:
- Both the Lift Chart and ROC Curve can only be built using the validation set as their Data Source.
- The Model Info tab shows no holdout backtest and or warnings related to holdout.
- You can only compute predictions for All data and the Validation set from the Predict tab.
- The Learning Curves graph does not plot any models trained into Validation or Holdout.
- Model Comparison uses results only from validation and backtesting.
Feature Lineage tab
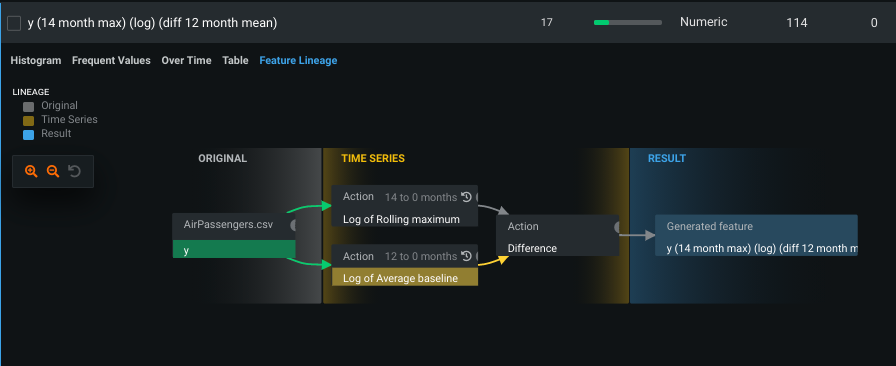
To enhance understanding of the results displayed in the log, use the Feature Lineage tab for a visual "description" that illustrates each action taken (the lineage) to generate a derived feature. It can be difficult to understand how a feature that was not present in the original, uploaded dataset was created. Feature Lineage makes it easy to identify not only which features were derived but the steps that went into the end result.
From the Data page, click Feature Lineage to see each action taken to generate the derived feature, represented as a connectivity graph showing the relationship between variables (directed acyclic graph).
For more complex derivations, for example those with differencing, the graph illustrates how the difference was calculated:
Elements of the visualization represent the lineage. Click a cell in the graph to see the previous cells that are related to the selected cell's generation—parent actions are to the left of the element you click. Click once on a feature to show its parent feature, click again to return to the full display.
The graph uses the following elements:
Build time-aware models
Once you click Start, DataRobot begins the model-building process and returns results to the Leaderboard. Because time series modeling uses date/time partitioning, you can run backtests, change window sampling, change training periods, and more from the Leaderboard.
Note
Model parameter selection has not been customized for date/time-partitioned projects. Though automatic parameter selection yields good results in most cases, Advanced Tuning may significantly improve performance for some projects that use the Date/Time partitioning feature.
Date duration features
Because having raw dates in modeling can be risky (overfitting, for example, or tree-based models that do not extrapolate well), DataRobot generally excludes them from the Informative Features list if date transformation features were derived. Instead, for OTV projects, DataRobot creates duration features calculated from the difference between date features and the primary date. It then adds the duration features to an optimized Informative Features list. The automation process creates:
- New duration features
- New feature lists
New duration features
When derived features (hour of day, day of week, etc.) are created, the feature type of the newly derived features are not dates. Instead, they become categorical or numeric, for example. To ensure that models learn time distances better, DataRobot computes the duration between primary and non-primary dates, adds that calculation as a feature, and then drops all non-primary dates.
Specifically, when date derivations happen in an OTV project, DataRobot creates one or more new features calculated from the duration between dates. The new features are named duration(<from date>, <to date>), where the <from date> is the primary date. The var type, displayed on the Data page, displays Date Duration.
The transformation applies even if the time units differ. In that case, DataRobot computes durations in seconds and displays the information on the Data page (potentially as huge integers). In some cases, the value is negative because the <to date> may be before the primary date.
New feature lists
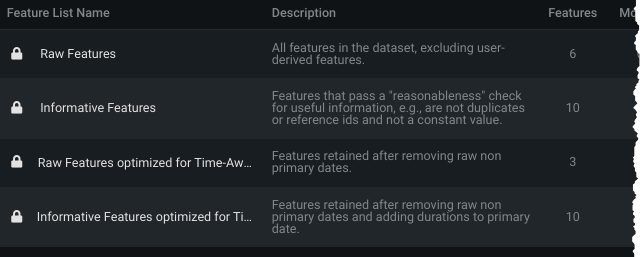
The new feature lists, automatically created based on Informative Features and Raw Features, are a copy of the originals with the duration feature(s) added. They are named the same, but with "optimized for time-aware modeling" appended. (For univariate feature lists, duration features are only added if the original date feature was part of the original univariate list.)
When you run full or Quick Autopilot, new feature lists are created later in the EDA2 process. DataRobot then switches the Autopilot process to use the new, optimized list. To use one of the non-optimized lists, you must rerun Autopilot specifying the list you want.
Time-aware models on the Leaderboard
Once you click Start, DataRobot begins the model-building process and returns results to the Leaderboard.
Note
Model parameter selection has not been customized for date/time-partitioned projects. Though automatic parameter selection yields good results in most cases, Advanced Tuning may significantly improve performance for some projects that use the Date/Time partitioning feature.
While most elements of the Leaderboard are the same, DataRobot's calculation and assignment of recommended models differs. Also, the Sample Size function is different for date/time-partitioned models. Instead of reporting the percentage of the dataset used to build a particular model, under Feature List & Sample Size, the default display lists the sampling method (random/latest) and either:
-
The start/end date (either manually added or automatically assigned for the recommended model:
-
The duration used to build the model:
-
The number of rows:
-
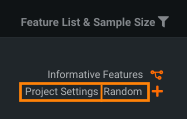
the Project Settings label, indicating custom backtest configuration:
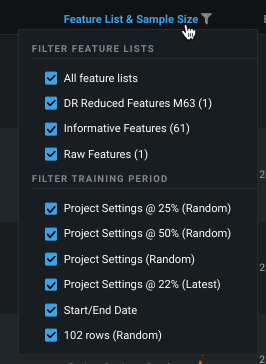
You can filter the Leaderboard display on the time window sample percent, sampling method, and feature list using the dropdown available from the Feature List & Sample Size. Use this to, for example, easily select models in a single Autopilot stage.
Autopilot does not optimize the amount of data used to build models when using Date/Time partitioning. Different length training windows may yield better performance by including more data (for longer model-training periods) or by focusing on recent data (for shorter training periods). You may improve model performance by adding models based on shorter or longer training periods. You can customize the training period with the Add a Model option on the Leaderboard.
Another partitioning-dependent difference is the origination of the Validation score. With date partitioning, DataRobot initially builds a model using only the first backtest (the partition displayed just below the holdout test) and reports the score on the Leaderboard. When calculating the holdout score (if enabled) for row count or duration models, DataRobot trains on the first backtest, freezes the parameters, and then trains the holdout model. In this way, models have the same relationship (i.e., end of backtest 1 training to start of backtest validation will be equivalent in duration to end of holdout training data to start of holdout).
Note, however, that backtesting scores are dependent on the sampling method selected. DataRobot only scores all backtests for a limited number of models (you must manually run others). The automatically run backtests are based on:
-
With random, DataRobot always backtests the best blueprints on the max available sample size. For example, if
BP0 on P1Y @ 50%has the best score, and BP0 has been trained onP1Y@25%,P1Y@50%andP1Y(the 100% model), DataRobot will score all backtests for BP0 trained on P1Y. -
With latest, DataRobot preserves the exact training settings of the best model for backtesting. In the case above, it would score all backtests for
BP0 on P1Y @ 50%.
Note that when the model used to score the validation set was trained on less data than the training size displayed on the Leaderboard, the score displays an asterisk. This happens when training size is equal to full size minus holdout.
Just like cross-validation, you must initiate a separate build for the other configured backtests (if you initially set the number of backtest to greater than 1). Click a model’s Run link from the Leaderboard, or use Run All Backtests for Selected Models from the Leaderboard menu. (You can use this option to run backtests for single or multiple models at one time.)
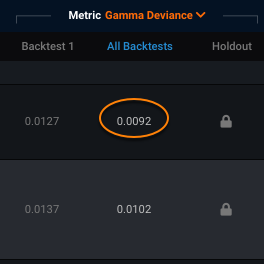
The resulting score displayed in the All Backtests column represents an average score for all backtests. See the description of Model Info for more information on backtest scoring.
Change the training period
Note
Consider retraining your model on the most recent data before final deployment.
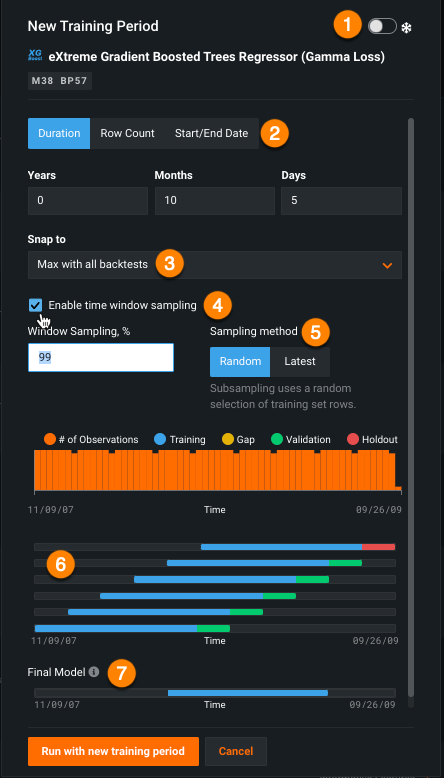
You can change the training range and sampling rate and then rerun a particular model for date-partitioned builds. Note that you cannot change the duration of the validation partition once models have been built; that setting is only available from the Advanced options link before the building has started. Click the plus sign (+) to open the New Training Period dialog:
The New Training Period box has multiple selectors, described in the table below:
| Selection | Description | |
|---|---|---|
| 1 | Frozen run toggle | Freeze the run |
| 2 | Training mode | Rerun the model using a different training period. Before setting this value, see the details of row count vs. duration and how they apply to different folds. |
| 3 | Snap to | "Snap to" predefined points, to facilitate entering values and avoid manually scrolling or calculation. |
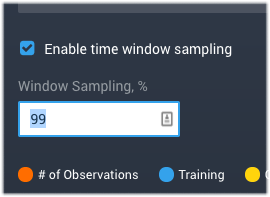
| 4 | Enable time window sampling | Train on a subset of data within a time window for a duration or start/end training mode. Check to enable and specify a percentage. |
| 5 | Sampling method | Select the sampling method used to assign rows from the dataset. |
| 6 | Summary graphic | View a summary of the observations and testing partitions used to build the model. |
| 7 | Final Model | View an image that changes as you adjust the dates, reflecting the data to be used in the model you will make predictions with (see the note below). |
Once you have set a new value, click Run with new training period. DataRobot builds the new model and displays it on the Leaderboard.
Setting the duration
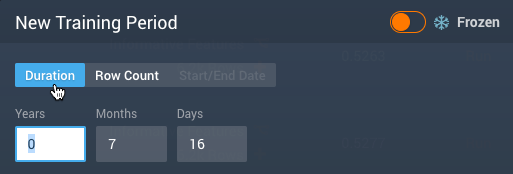
To change the training period a model uses, select the Duration tab in the dialog and set a new length. Duration is measured from the beginning of validation working back in time (to the left). With the Duration option, you can also enable time window sampling.
DataRobot returns an error for any period of time outside of the observation range. Also, the units available depend on the time format (for example, if the format is %d-%m-%Y, you won't have hours, minutes, and seconds).
Setting the row count
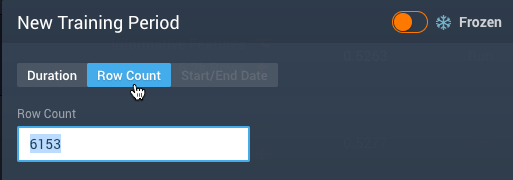
The row count used to build a model is reported on the Leaderboard as the Sample Size. To vary this size, Click the Row Count tab in the dialog and enter a new value.
Setting the start and end dates
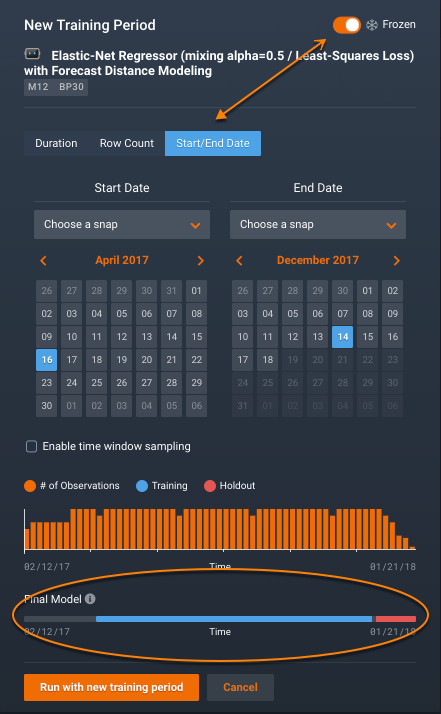
If you enable Frozen run by clicking the toggle, DataRobot re-uses the parameter settings it established in the original model run on the newly specified sample. Enabling Frozen run unlocks a third training criteria, Start/End Date. Use this selection to manually specify which data DataRobot uses to build the model. With this setting, after unlocking holdout, you can train a model into the Holdout data. (The Duration and Row Count selectors do not allow training into holdout.) Note that if holdout is locked and you overlap with this setting, the model building will fail. With the start and end dates option, you can also enable time window sampling.
When setting start and end dates, note the following:
- DataRobot does not run backtests because some of the data may have been used to build the model.
- The end date is excluded when extracting data. In other words, if you want data through December 31, 2015, you must set end-date to January 1, 2016.
- If the validation partition (set via Advanced options before initial model build) occurs after the training data, DataRobot displays a validation score on the Leaderboard. Otherwise, the Leaderboard displays N/A.
- Similarly, if any of the holdout data is used to build the model, the Leaderboard displays N/A for the Holdout score.
- Date/time partitioning does not support dates before 1900.
Click Start/End Date to open a clickable calendar for setting the dates. The dates displayed on opening are those used for the existing model. As you adjust the dates, check the Final model graphic to view the data your model will use.
Time window sampling
If you do not want to use all data within a time window for a date/time-partitioned project, you can train on a subset of data within a time window specification. To do so, check the Enable Time Window sampling box and specify a percentage. DataRobot will take a uniform sample over the time range using that percentage of the data. This feature helps with larger datasets that may need the full time window to capture seasonality effects, but could otherwise face runtime or memory limitations.
View summary information
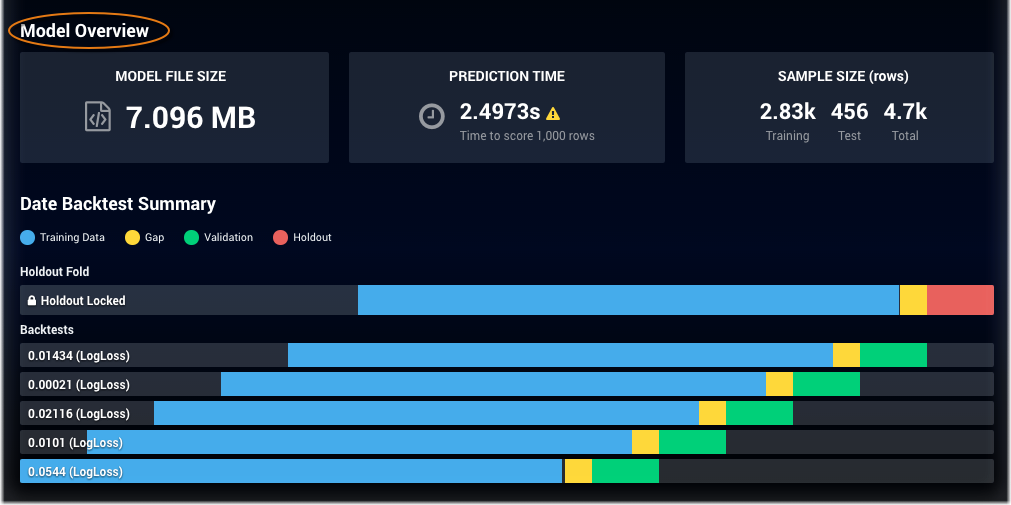
Once models are built, use the Model Info tab for the model overview, backtest summary, and resource usage information.
Some notes:
-
Hover over the folds to display rows, dates, and duration as they may differ from the values shown on the Leaderboard. The values displayed are the actual values DataRobot used to train the model. For example, suppose you request a Start/End Date model from 6/1/2015 to 6/30/2015 but there is only data in your dataset from 6/7/2015 to 6/14/2015, then the hover display indicates the actual dates, 6/7/2015 through 6/15/2015, for start and end dates, with a duration of eight days.
-
The Model Overview is a summary of row counts from the validation fold (the first fold under the holdout fold).
-
If you created duration-based testing, the validation summary could result in differences in numbers of rows. This is because the number of rows of data available for a given time period can vary.
-
A message of Not Yet Computed for a backtest indicates that there was not available data for the validation fold (for example, because of gaps in the dataset). In this case, where all backtests were not completed, DataRobot displays an asterisk on the backtest score.
-
The “reps” listed at the bottom correspond to the backtests above and are ordered in the sequence in which they finished running.
Investigate models
The following insights are available from the Leaderboard to help with model evaluation:
| Tab | Availability |
|---|---|
| Accuracy Over Time | OTV; additional options for time series and multiseries |
| Anomaly Assessment | Anomaly detection: time series, multiseries |
| Anomaly Over Time, Anomaly detection | OTV, time series, multiseries |
| Forecasting Accuracy | Time series, multiseries |
| Forecast vs Actual | Time series, multiseries |
| Period Accuracy | OTV, time series, multiseries |
| Segmentation | Time series/segmented modeling |
| Series Insights | Multiseries |
| Stability | OTV, time series, multiseries |
