Exploratory Spatial Data Analysis (ESDA)
DataRobot Location AI provides a variety of tools for conducting ESDA within the DataRobot AutoML environment, including geometry map visualizations, categorical/numeric thematic maps, and smart aggregation of large geospatial datasets. Location AI’s modern web mapping tools allow you to interactively visualize, explore, and aggregate target, numeric, and categorical features on a map.
Location visualization
Within the Data tab, you can visualize and explore the spatial distribution of observations by expanding location features from the list and selecting the Geospatial Map link. Clicking Compute feature over map creates a chart showing the distribution on a map.
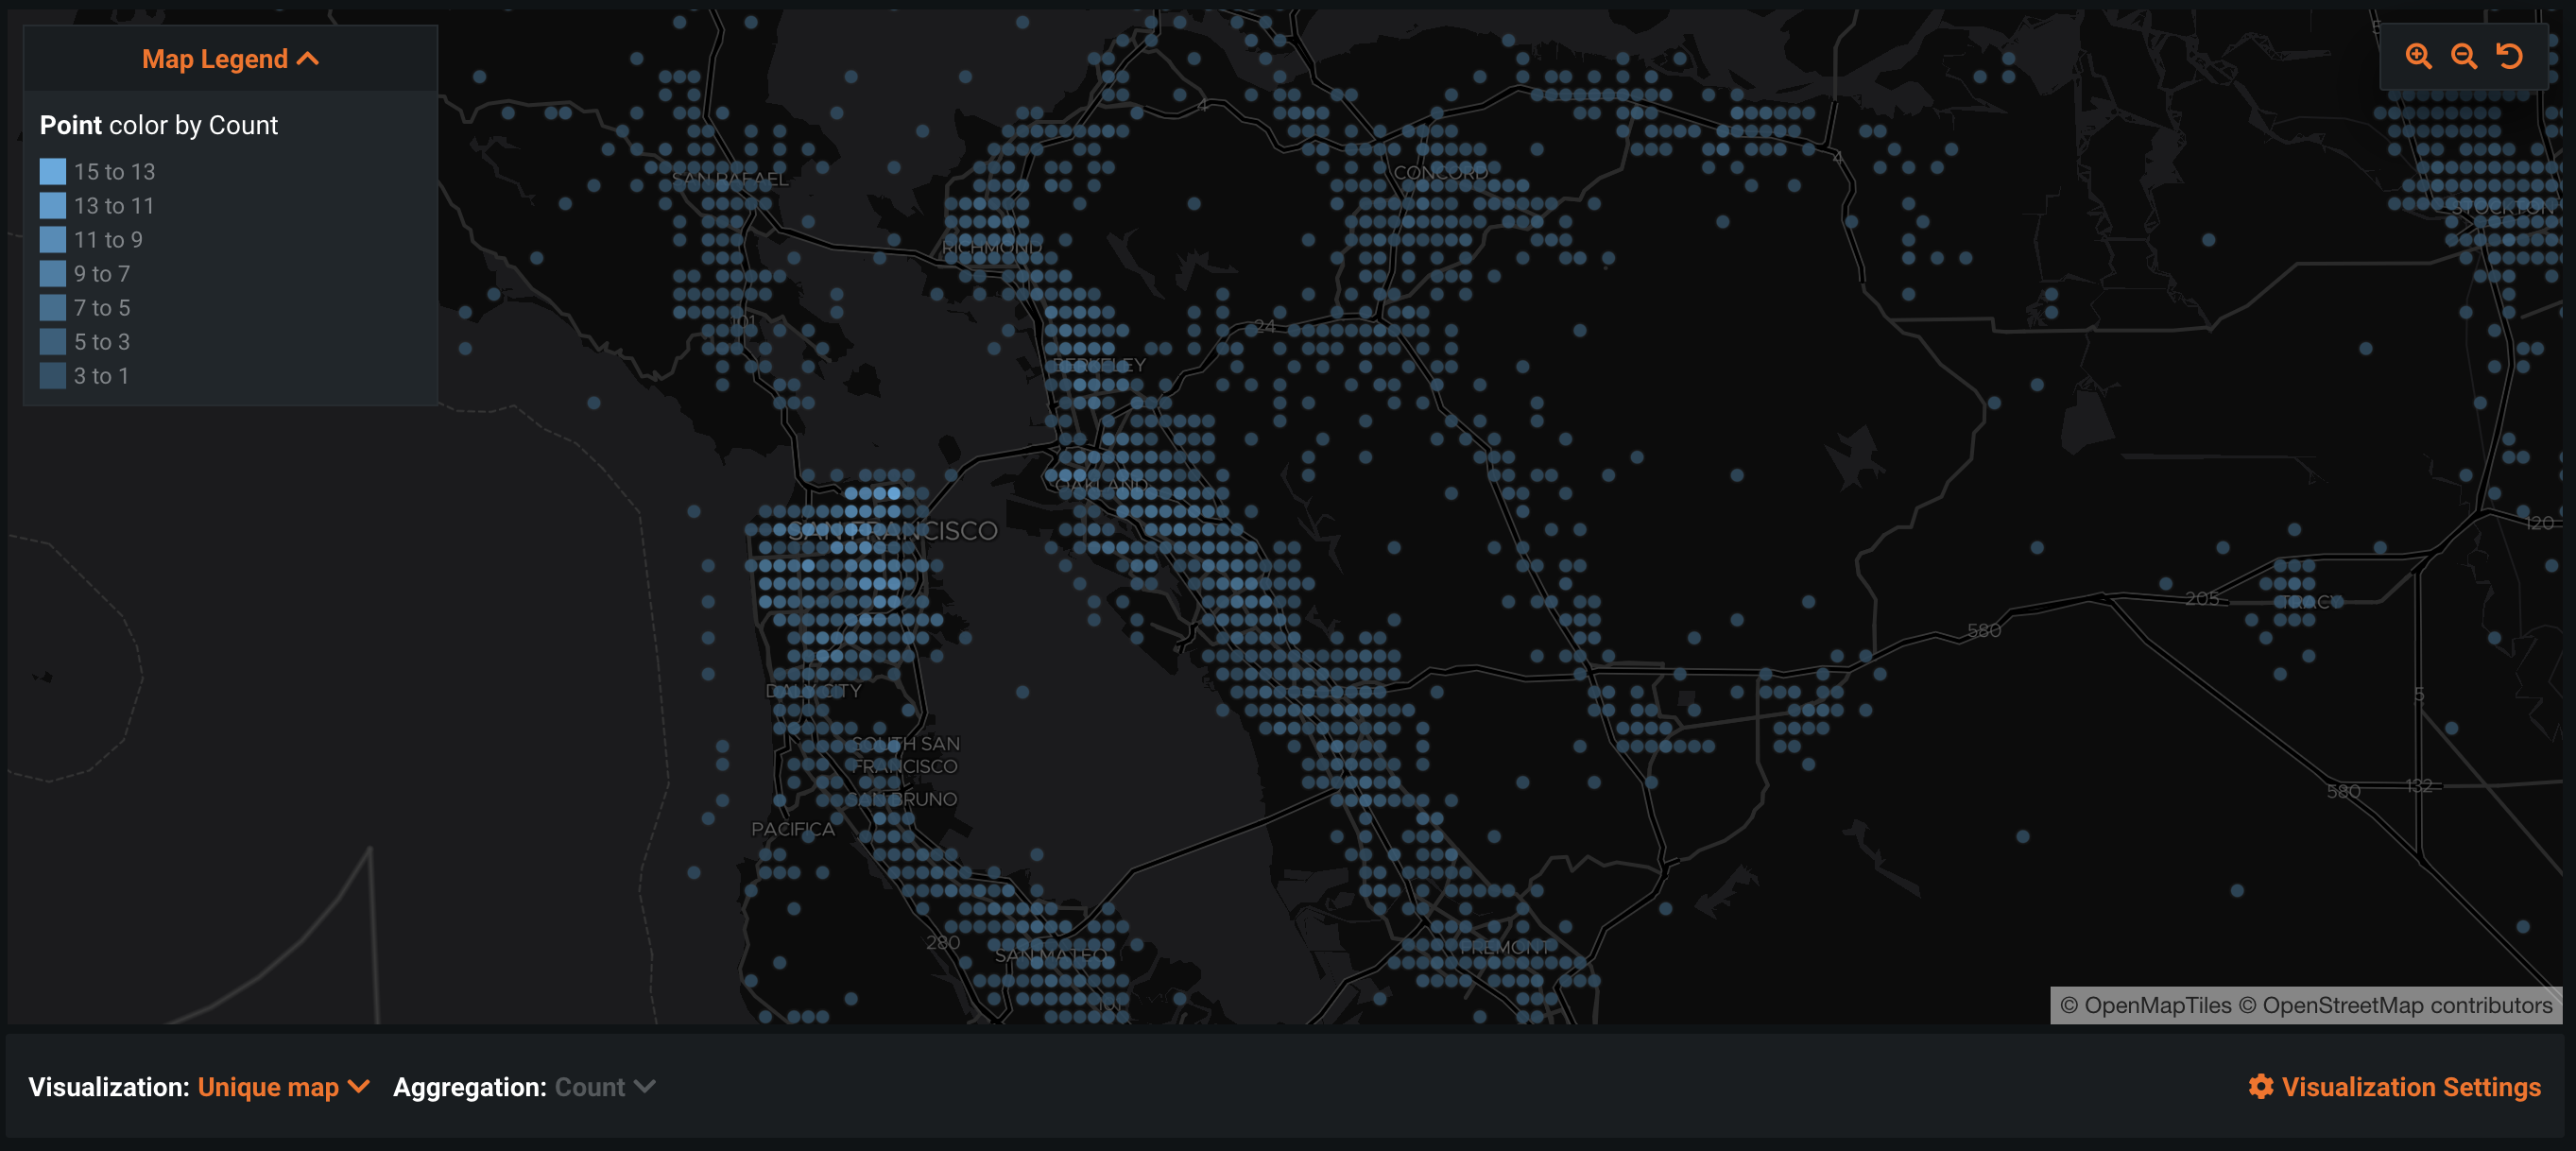
By default, Location AI displays a Unique map visualization depicting individual rows in the dataset as unique geometries. You can:
- Pan the map using a left-click hold (or equivalent touch gesture) and moving it.
- Zoom in left by double-clicking (or equivalent touch gesture).
- Use the zoom controls in the top-right corner of the map panel to zoom in and out.
Within the Unique map view, rows from the input dataset that are co-located in space are aggregated; the map legend in the top-left corner of the map panel displays a color gradient that represents counts of co-located points at a given location. Hovering over a geometry produces a pop-up displaying the count of co-located points and the coordinates of the location at that geometry. The opacity of the data can be controlled in Visualization Settings.
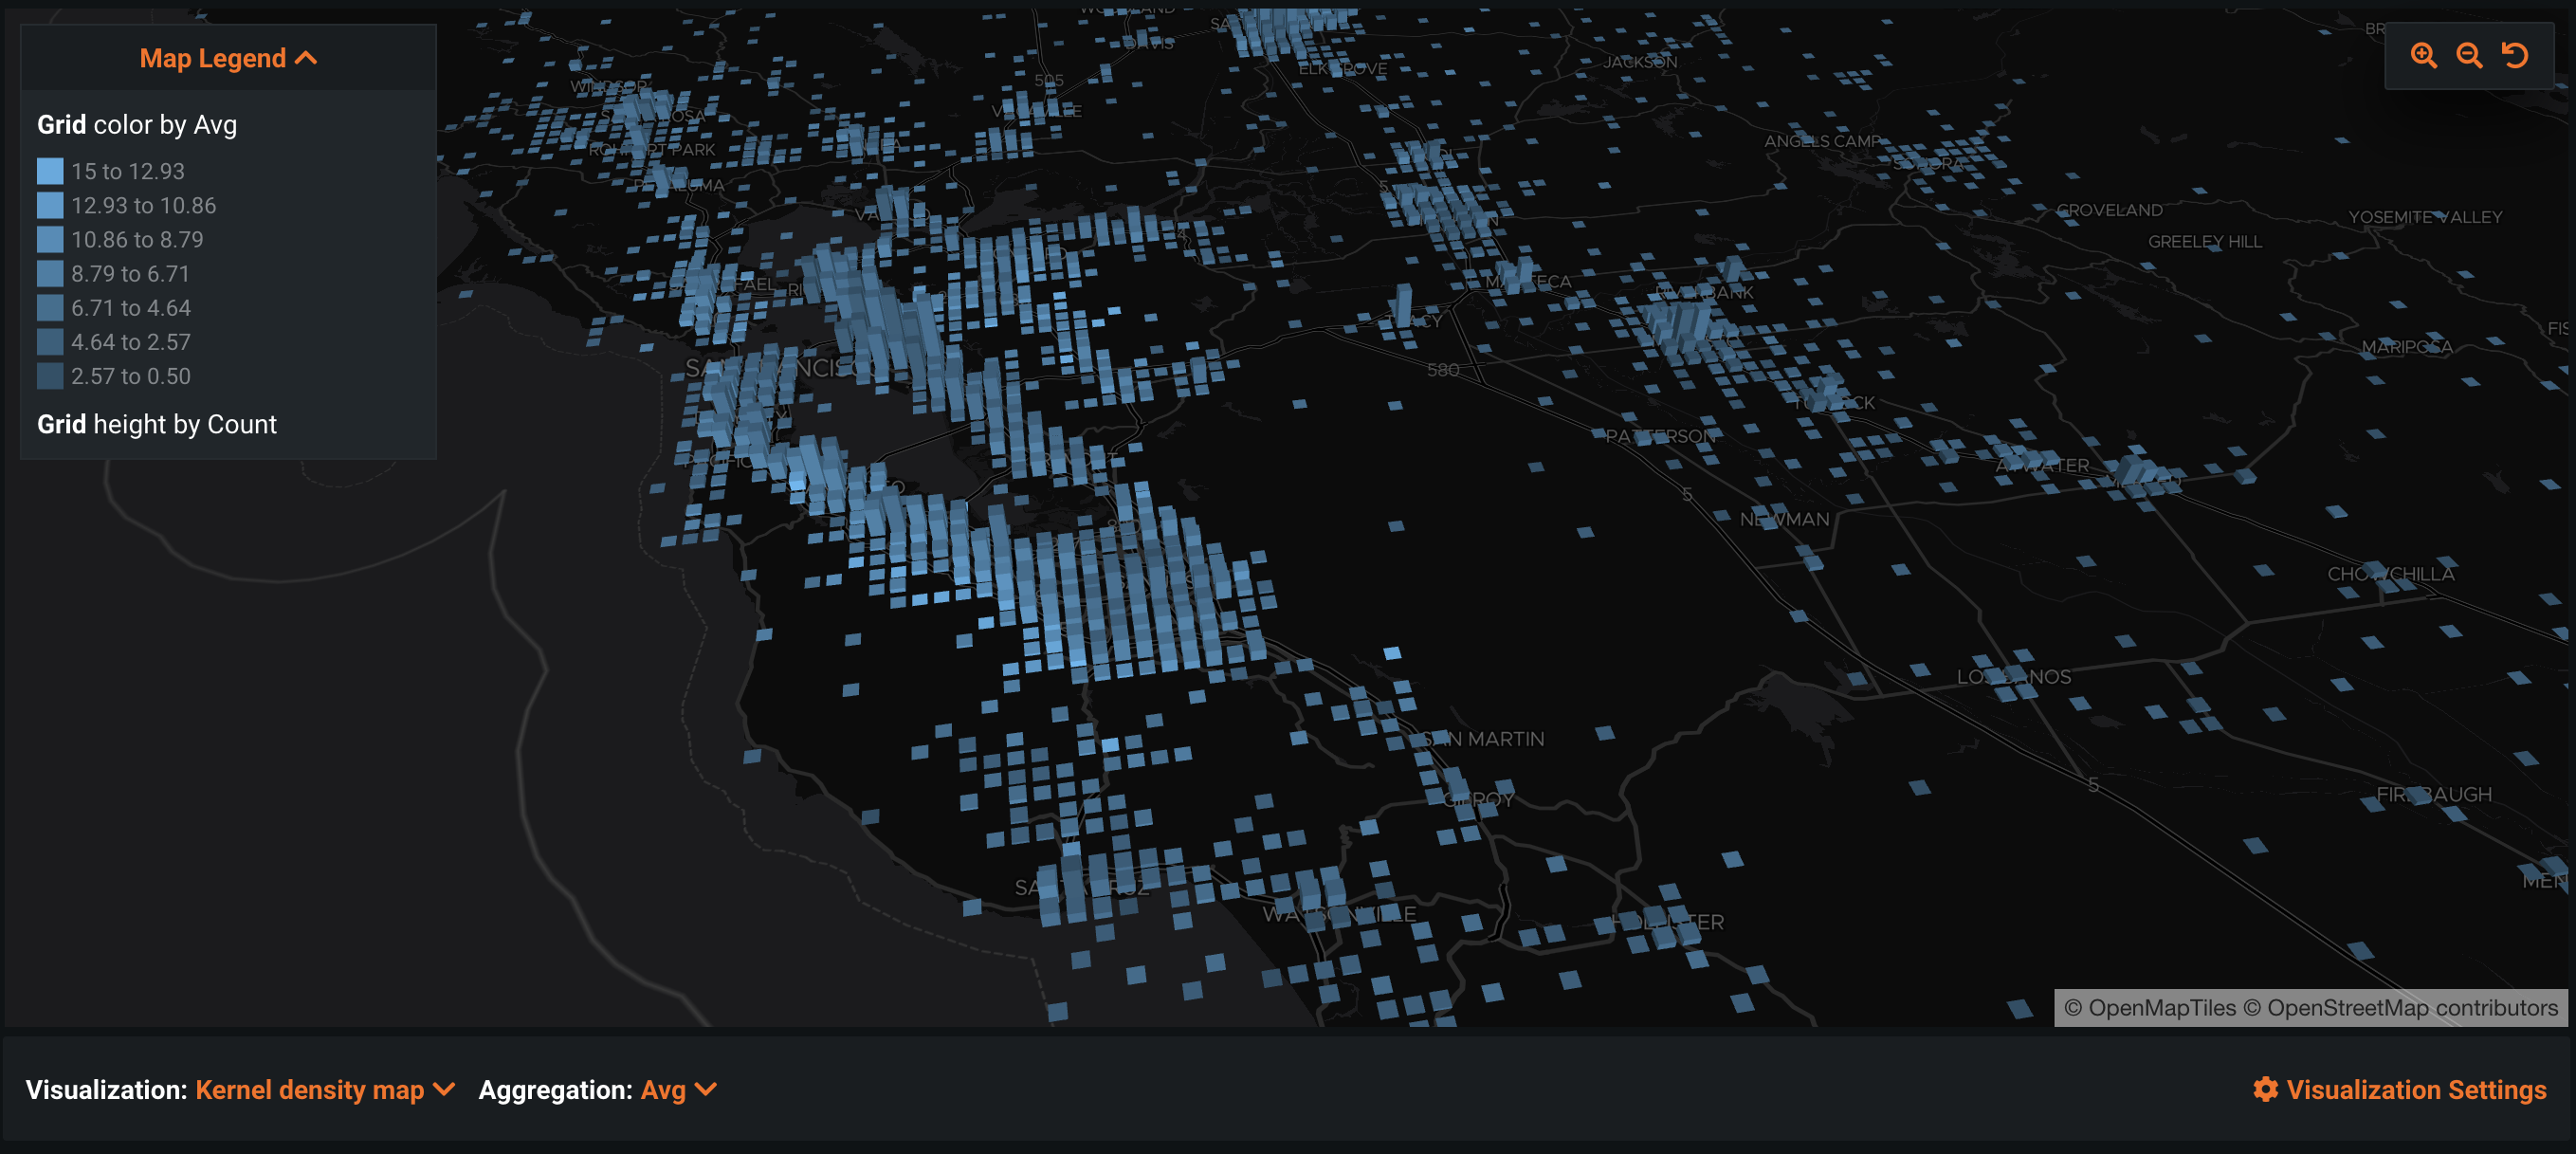
When the number or complexity of input geometries meets a certain threshold, Location AI automatically aggregates geometries into a Kernel density map to enhance the visualization experience and interpretability.
Feature Over Space
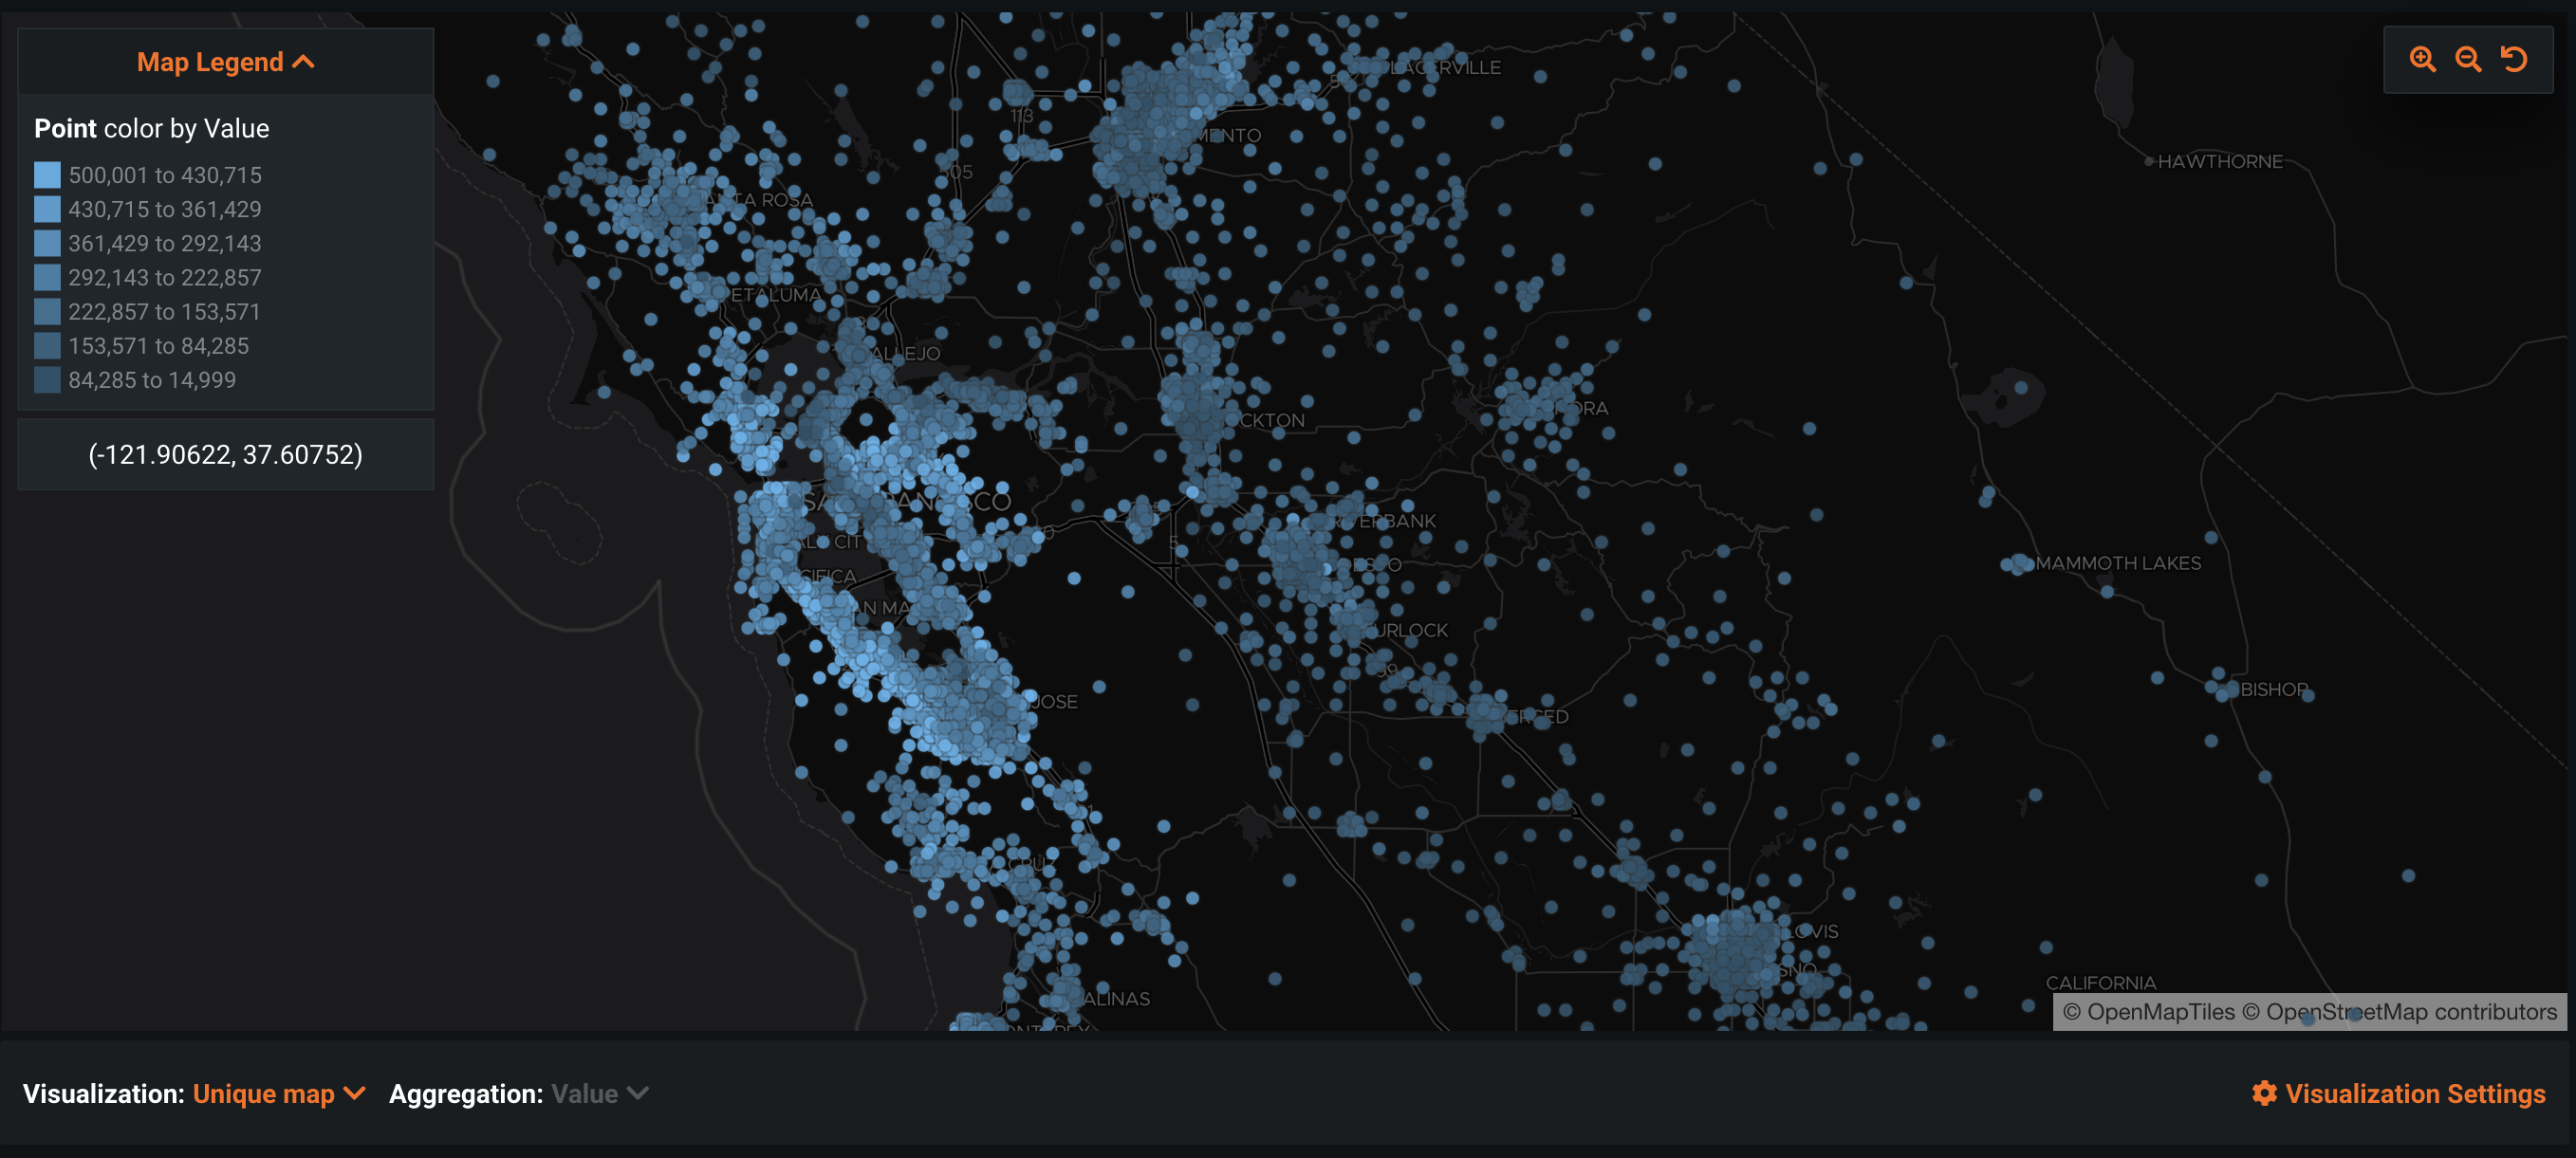
In addition to visualizing the spatial distribution of the input geometries, Location AI also displays distributions of numeric and categorical variables on the Geospatial Map. Within the Data tab, navigate to any numeric or categorical features, select Geospatial Map, and click Calculate Feature Over Map to create the visualization.
By default, the Feature Over Space visualization displays a thematic map of unique locations with feature values depicted as colors. For geometries that are co-located spatially, the average value for the co-located locations are displayed. For numeric variables, you can change the metric used for the display by selecting “min”, “max”, or “avg” from the Aggregation dropdown menu at the bottom-left of the map panel. For categorical variables, the mode of the co-located categories is displayed. When the number of unique geometries grows large, DataRobot automatically aggregates individual geometries to enhance the visualization.
Kernel density map
A Kernel density map collects multiple observations within each given kernel and displays aggregated statistics with a color gradient. For location features, the count, min, max, and average can be selected from the Aggregation dropdown. For numeric features, the min, max, or average is available. For categorical features, the mode is displayed. Several visualization customizations are available in Visualization Settings.
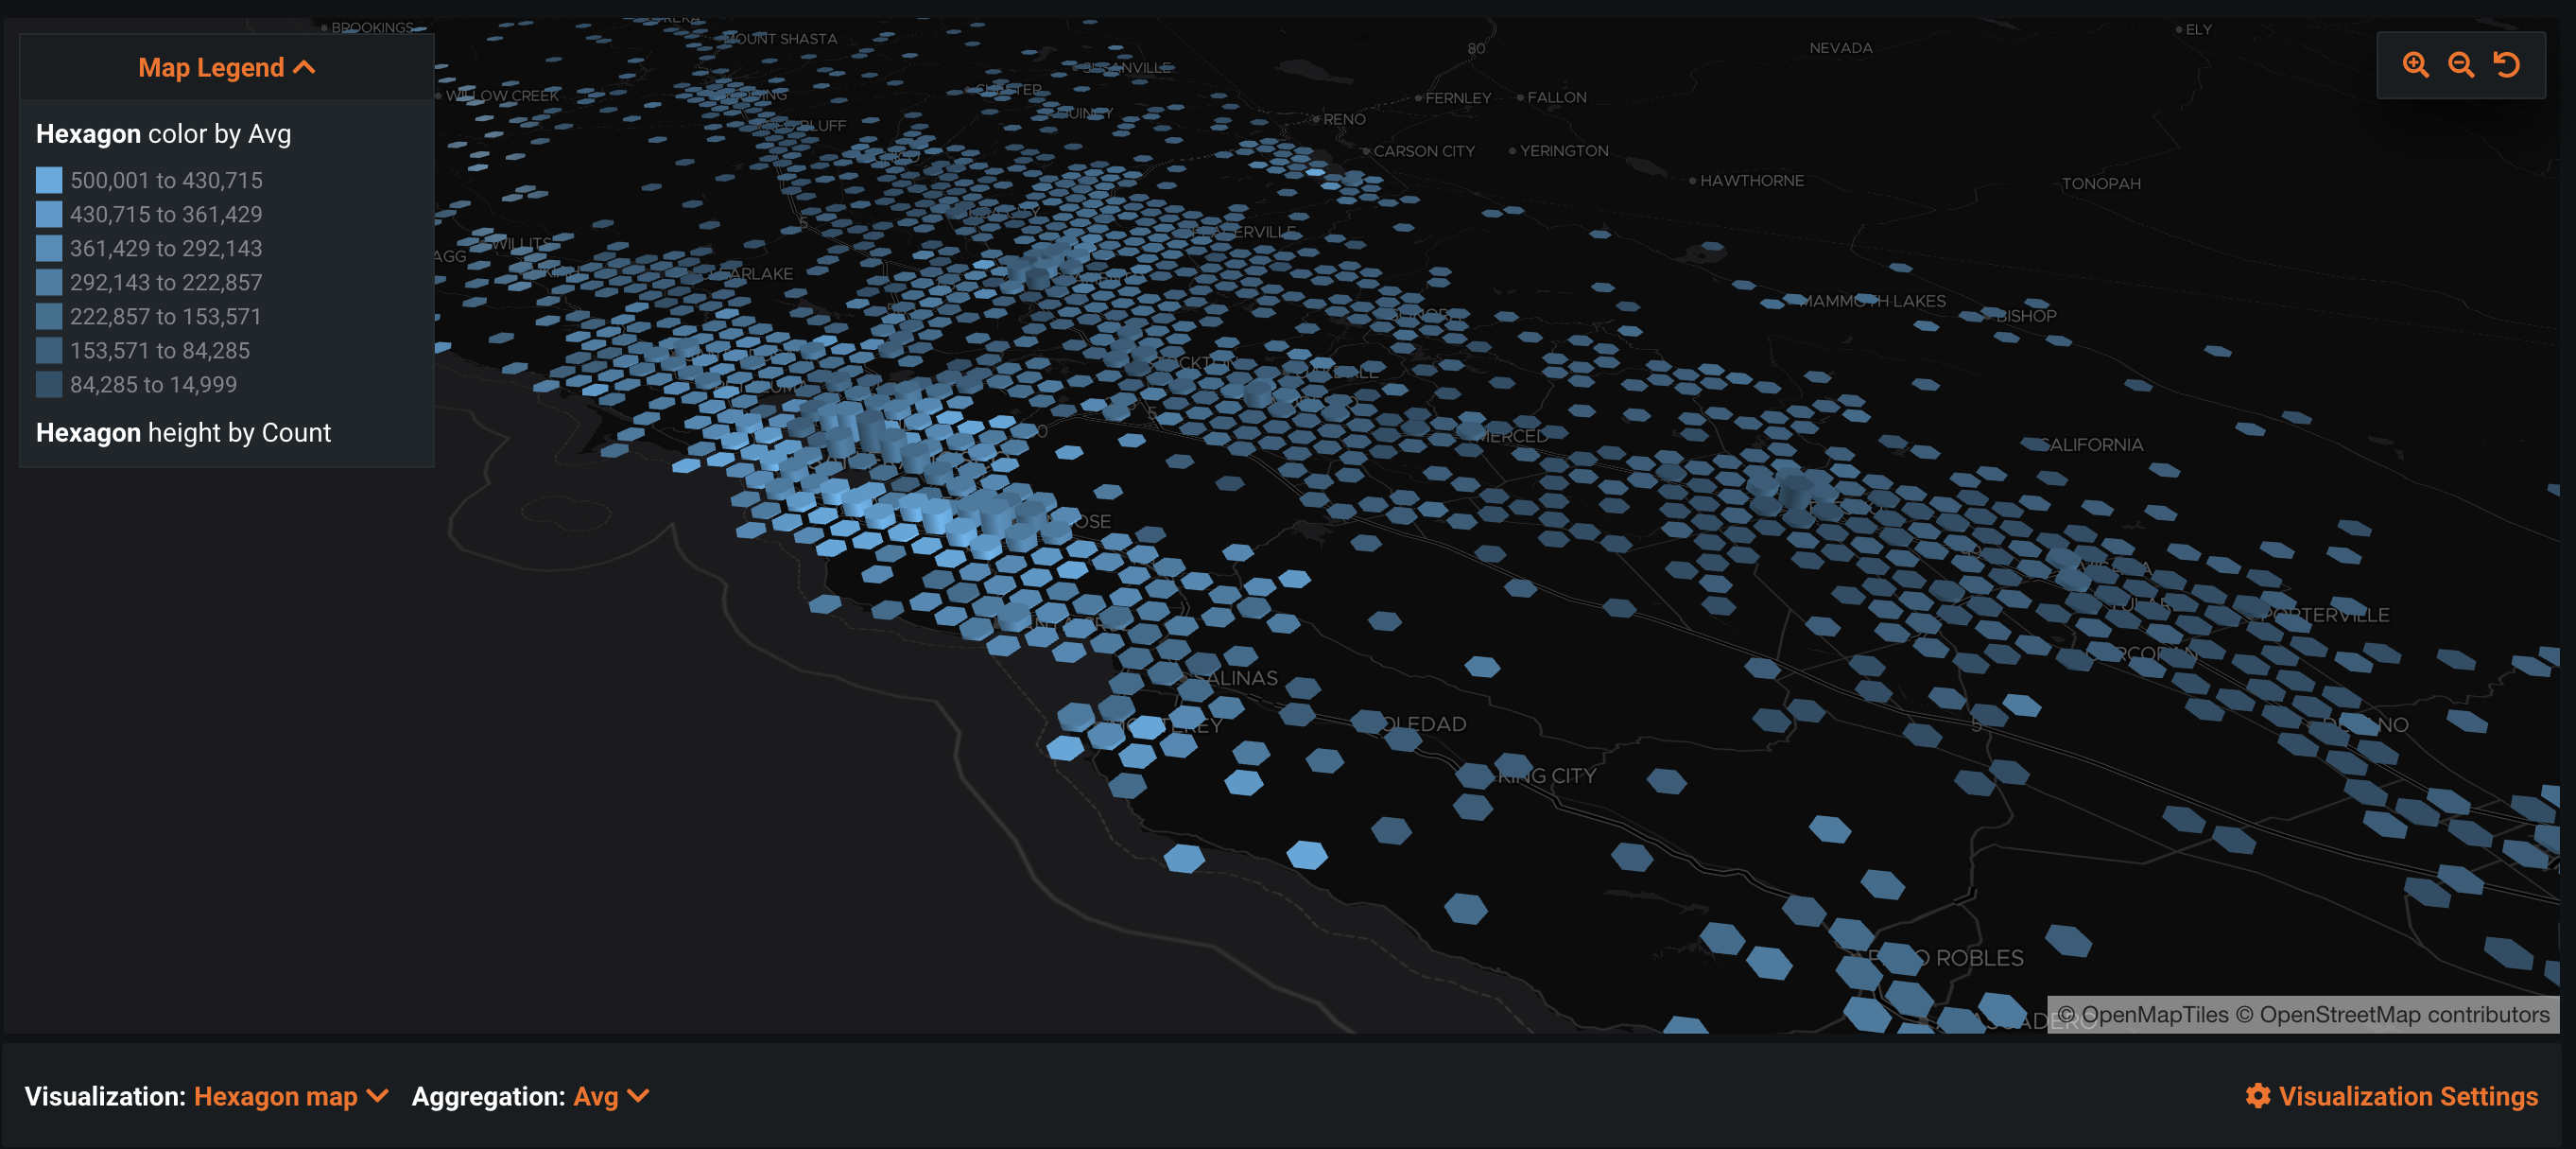
Hexagon map
In addition to viewing kernel density and unique maps of features, you can also view hexagon map visualizations. Select Hexagon map from the Visualization dropdown at the bottom-left of the map panel. Once selected, the map visualization displays hexagon-shaped cells. For location features, the count, min, max, and average can be selected from the Aggregation dropdown. For numeric features, the min, max, or average is available. For categorical features, the mode is displayed. Use the Visualization settings in the bottom-right of the map panel to adjust the settings.
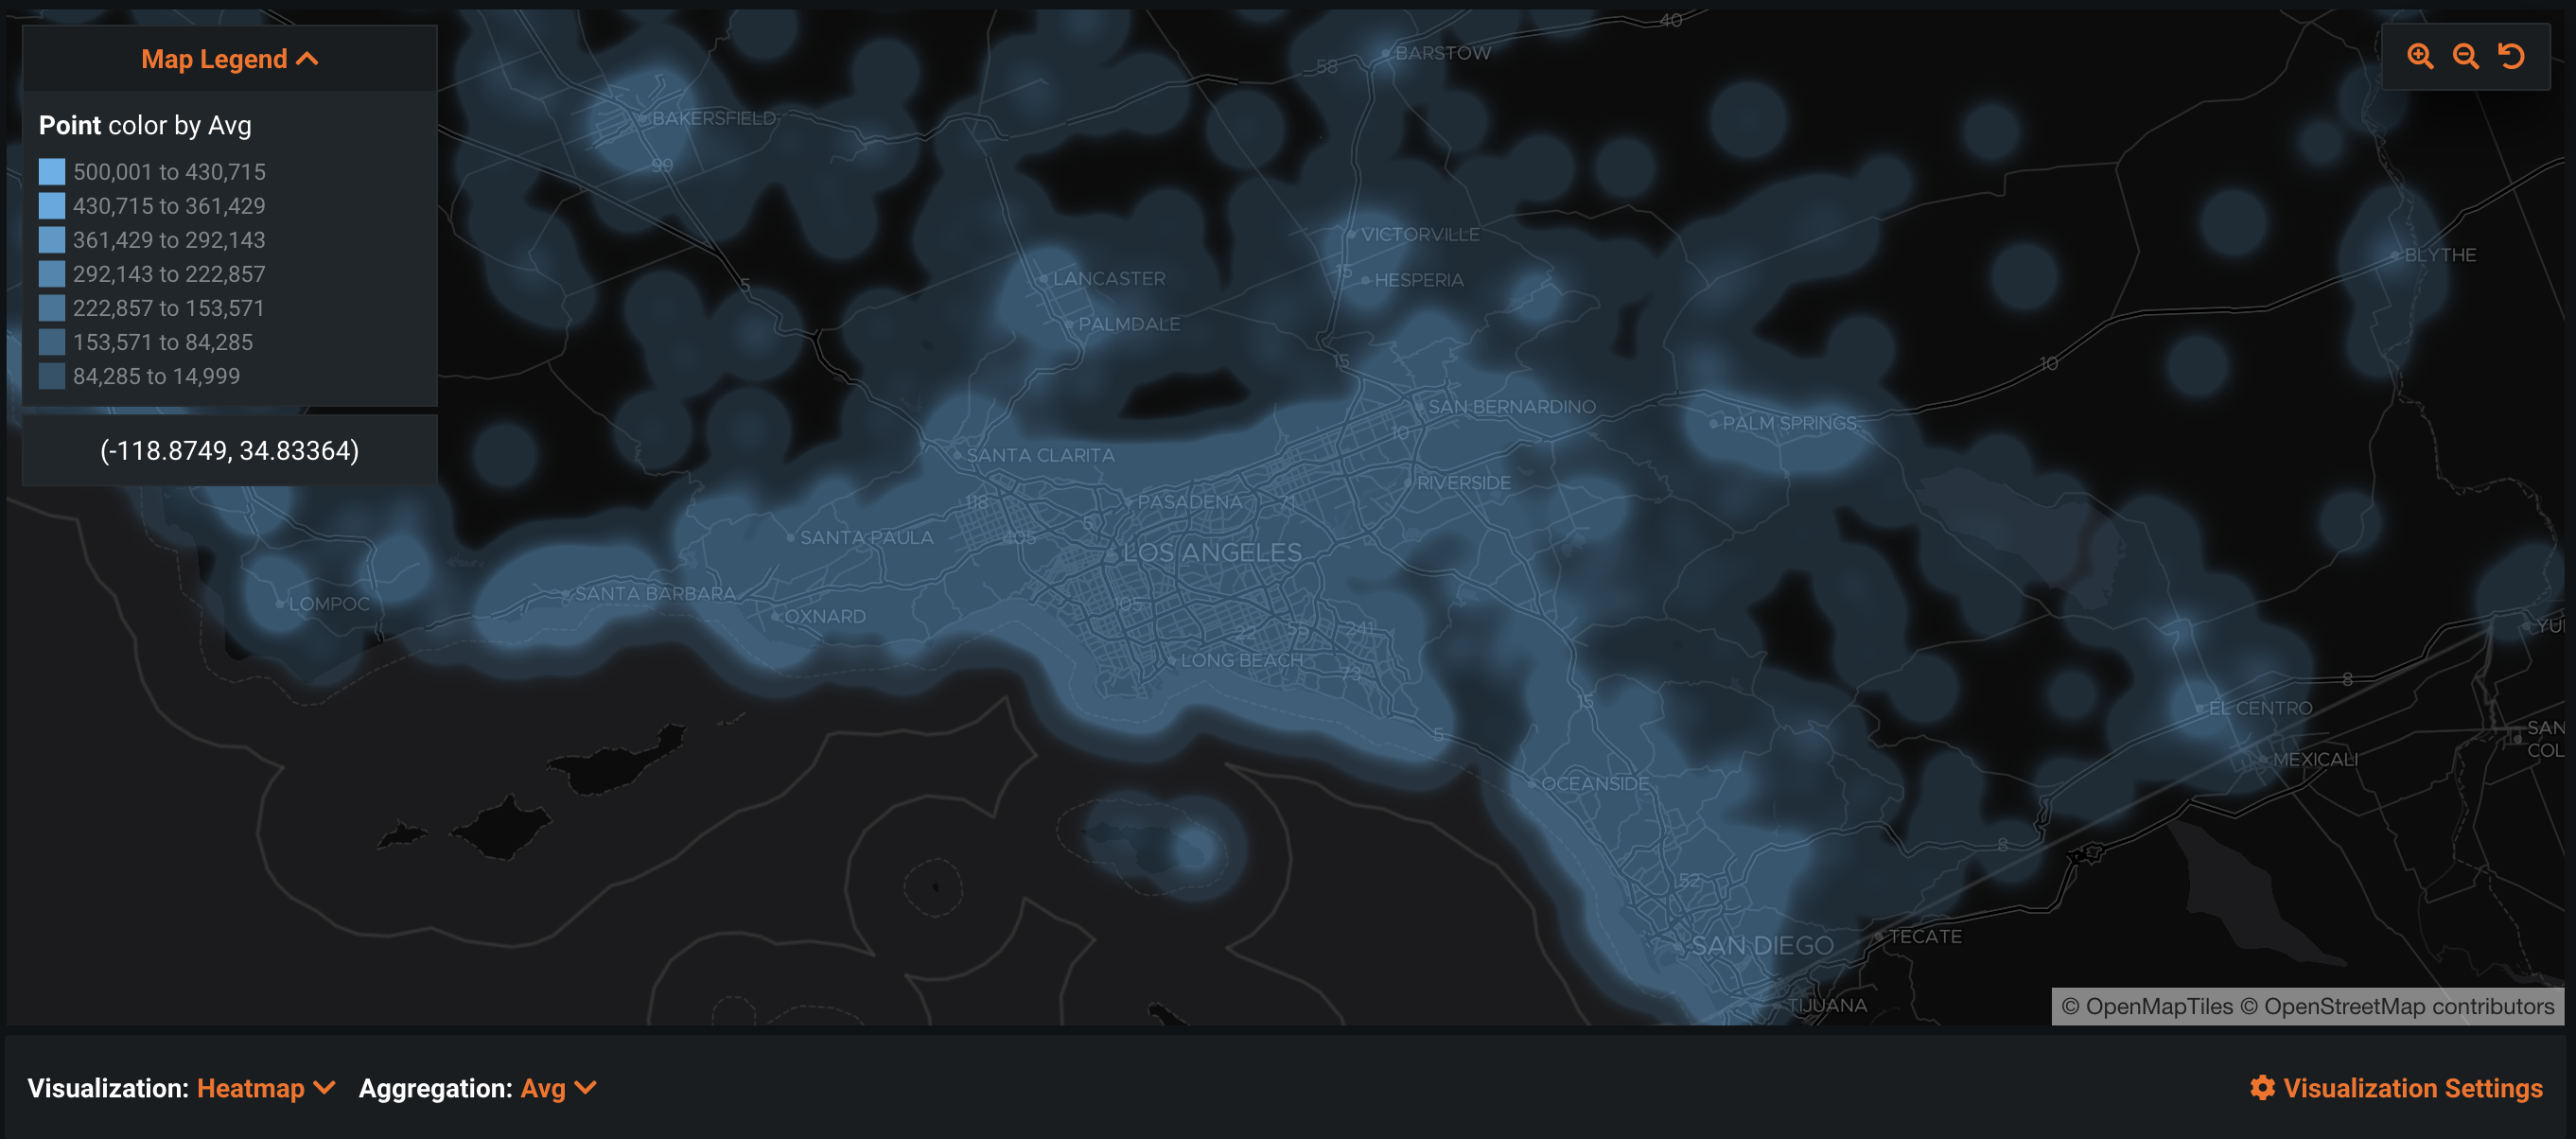
Heat map
You can also view heat map visualizations for geometry and numeric features. Heat map visualization is not available for categorical features. Select Heat map from the Visualization dropdown at the bottom-left of the map panel. Use the Visualization settings in the bottom-right of the map panel to adjust the settings.
