Series Insights (multiseries)
The Series Insights tab for time series multiseries projects provides series-specific information. (A clustering-specific version of Series Insights is also available.) For multiseries, insights are reported in both charted and tabular format:
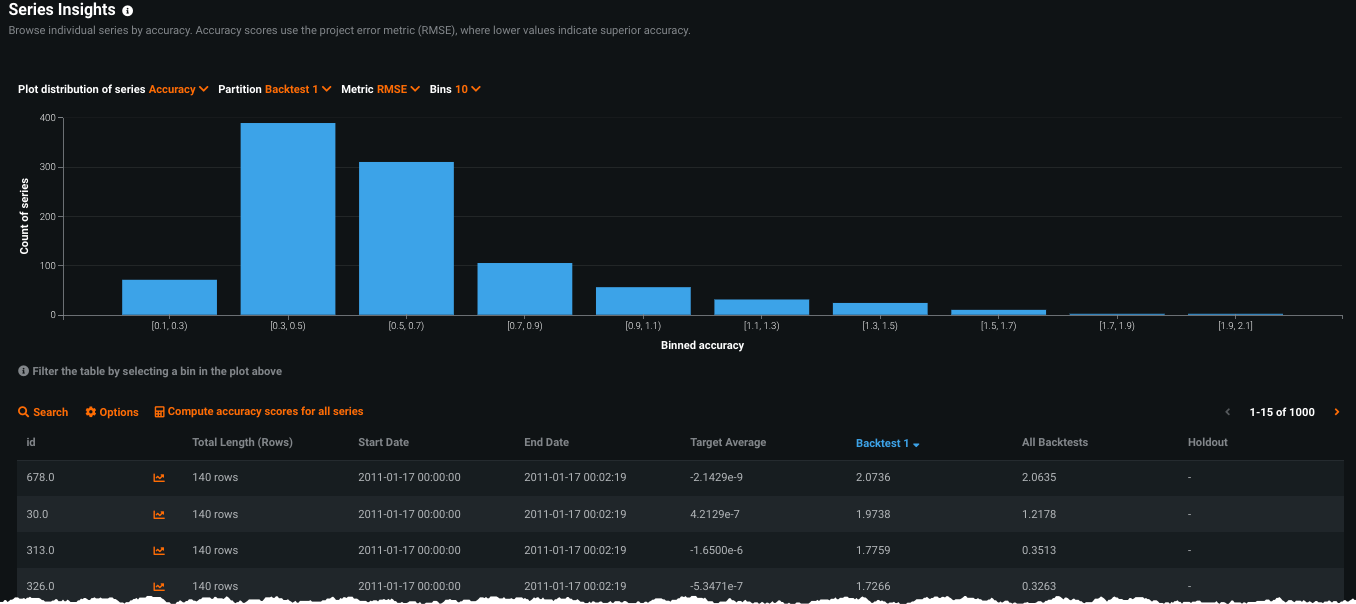
- The histogram provides binned data representing accuracy, average scores, length, and start/end date distribution by count for each series. Clicking on any bar populates the table below it with results from that bin.
- The table displays basic information for each series that falls within the selected binned region from the chart.
Note that for large datasets, DataRobot computes scores and values after downsampling.
Use Series Insights
To speed processing, Series Insights visualizations are initially computed for the first 1000 series (sorted by ID). You can, however, run calculations for the remaining series data. As each new calculation is computed, additional details become available. Complete information depends on accuracy calculations for all backtests.
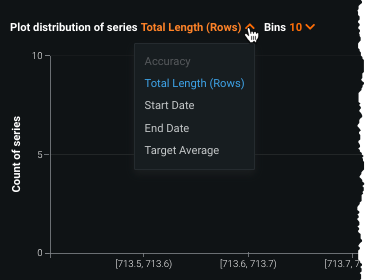
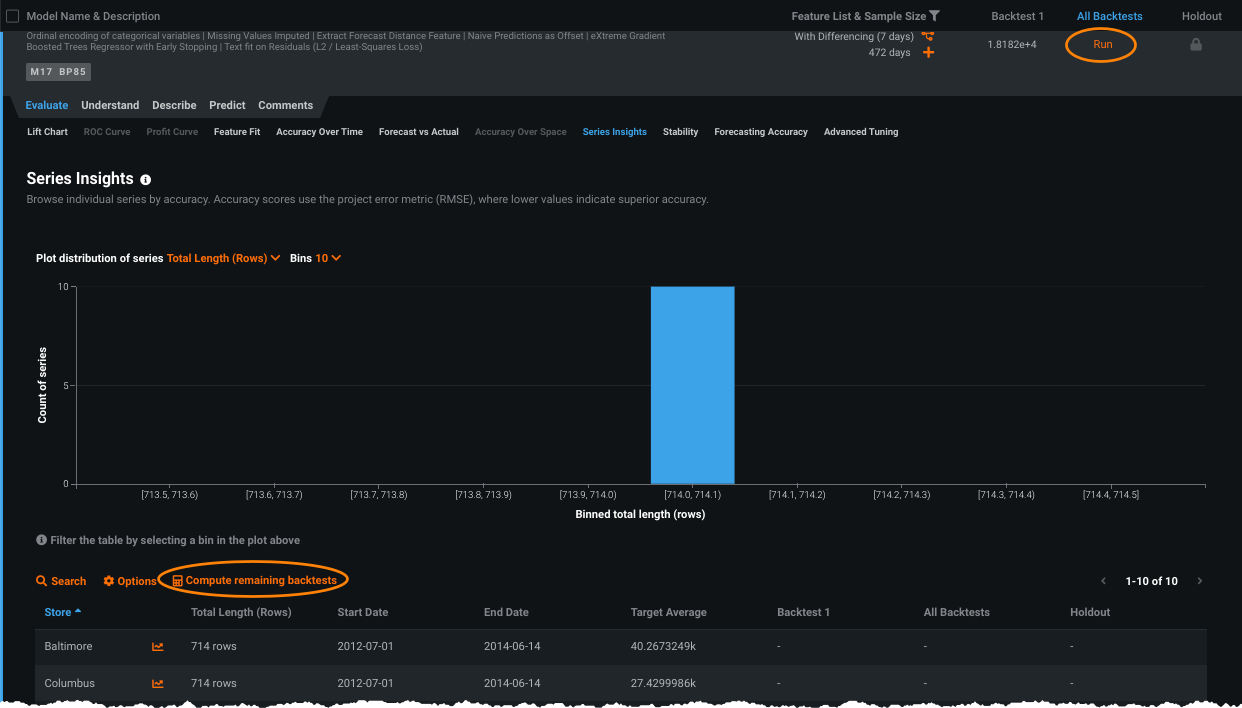
On first opening a model from the Leaderboard, the chart defaults to binning by Total Length. At this point you can select from a variety of plot distributions and bin counts. Note however that sorting by accuracy is disabled.
Click either Run (under All Backtests on the Leaderboard) or Compute remaining backtests (above the table) to activate additional options:
Selecting either one changes both to indicate that backtest calculations are in progress. Once completed, although backtests have been computed, accuracy has not. Click the Compute accuracy scores link above the table to compute accuracy. With accuracy calculations complete, the distribution options change, as described in the chart interpretation section below.
Interpret the insights
The page insights display aggregated (chart) and individual (table) series information. The insights are available immediately upon opening the tab, but all accuracy calculations must be complete before the full functionality is available. The sections below describe how to understand the output.
Series Insights histogram
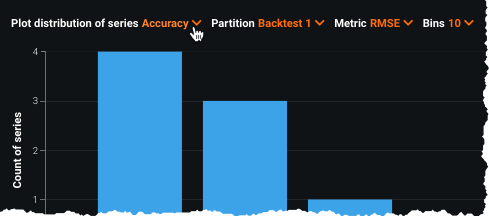
The histogram provides an at-a-glance indication of the series distribution (for the first 1000 series, regardless of whether all series are computed) based on a variety of metrics. Initially you can set the distribution to length, start or end date, or target average. Use the dropdowns to set the method and the number of bins for the display. When you have calculated accuracy, selecting that distribution adds options.
If you select Accuracy as the distribution method, you can additionally filter the display by partition and metric:
-
Partition: Sorts by accuracy score for Backtest 1, the average score across all backtests, or the Holdout score. Regardless of the number of backtests configured for a project, only Backtest 1 and an average value are available for selection.
-
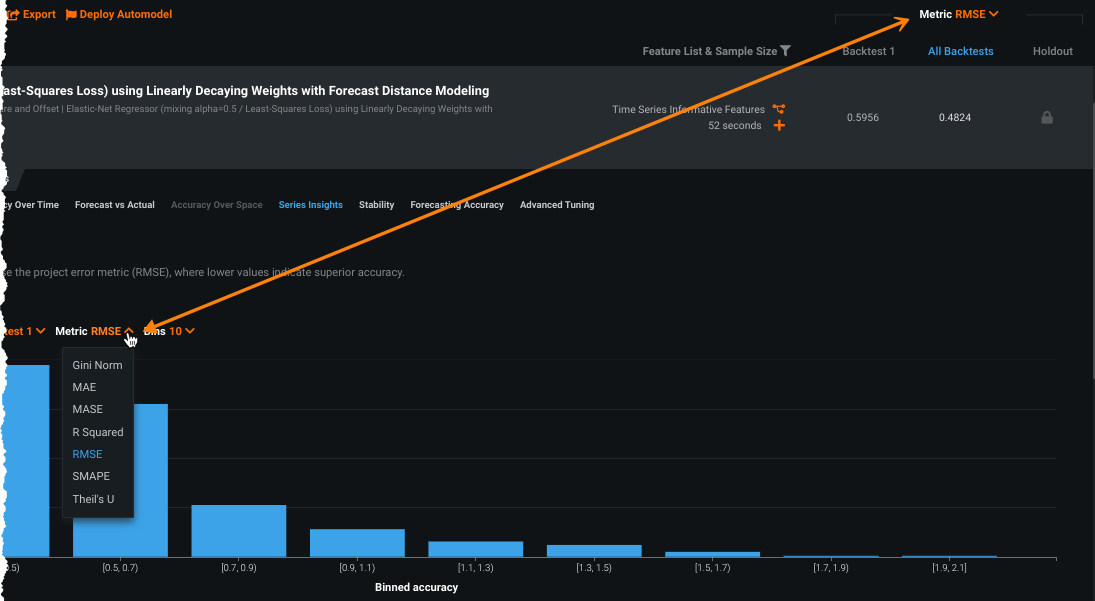
Metric: Selects the metric to base the accuracy score on. By default, the display uses the project metric.
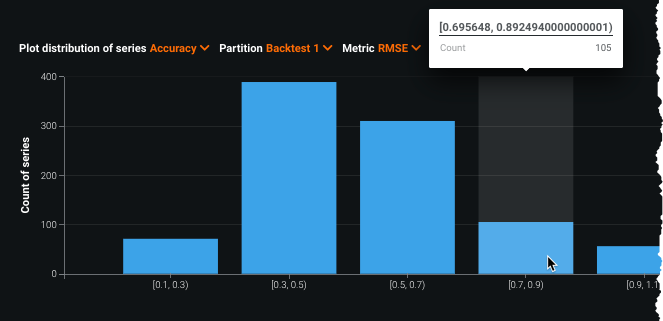
Hover on a bin to show a tooltip that displays series counts and binned value. In this example, when displayed for accuracy, 105 series had scores between (roughly) .69 and .89 when the metric was RMSE:
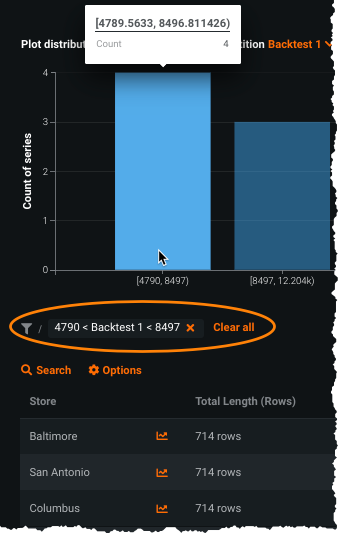
Clicking on a bin updates the table display to include results only for those series within the selected bin.
Series Insights table view
The table below the histogram provides series-specific information for either the first 1000 series (based on the histogram filters) or the series in a selected bin. The sort order defaults to series ID but you can click any column to re-sort. Some entries in the table may be missing values. This is most likely because you have not yet computed their scores or the individual series does not overlap with the selected partition.
Use the search function to view metrics for any series. Note in the example below that additional accuracy scores have not yet been computed:
The displayed table reports the following for each series:
Use the Options (![]() ) link to download the table data to a CSV file.
) link to download the table data to a CSV file.
Interpreting scaled metrics in Series Insights
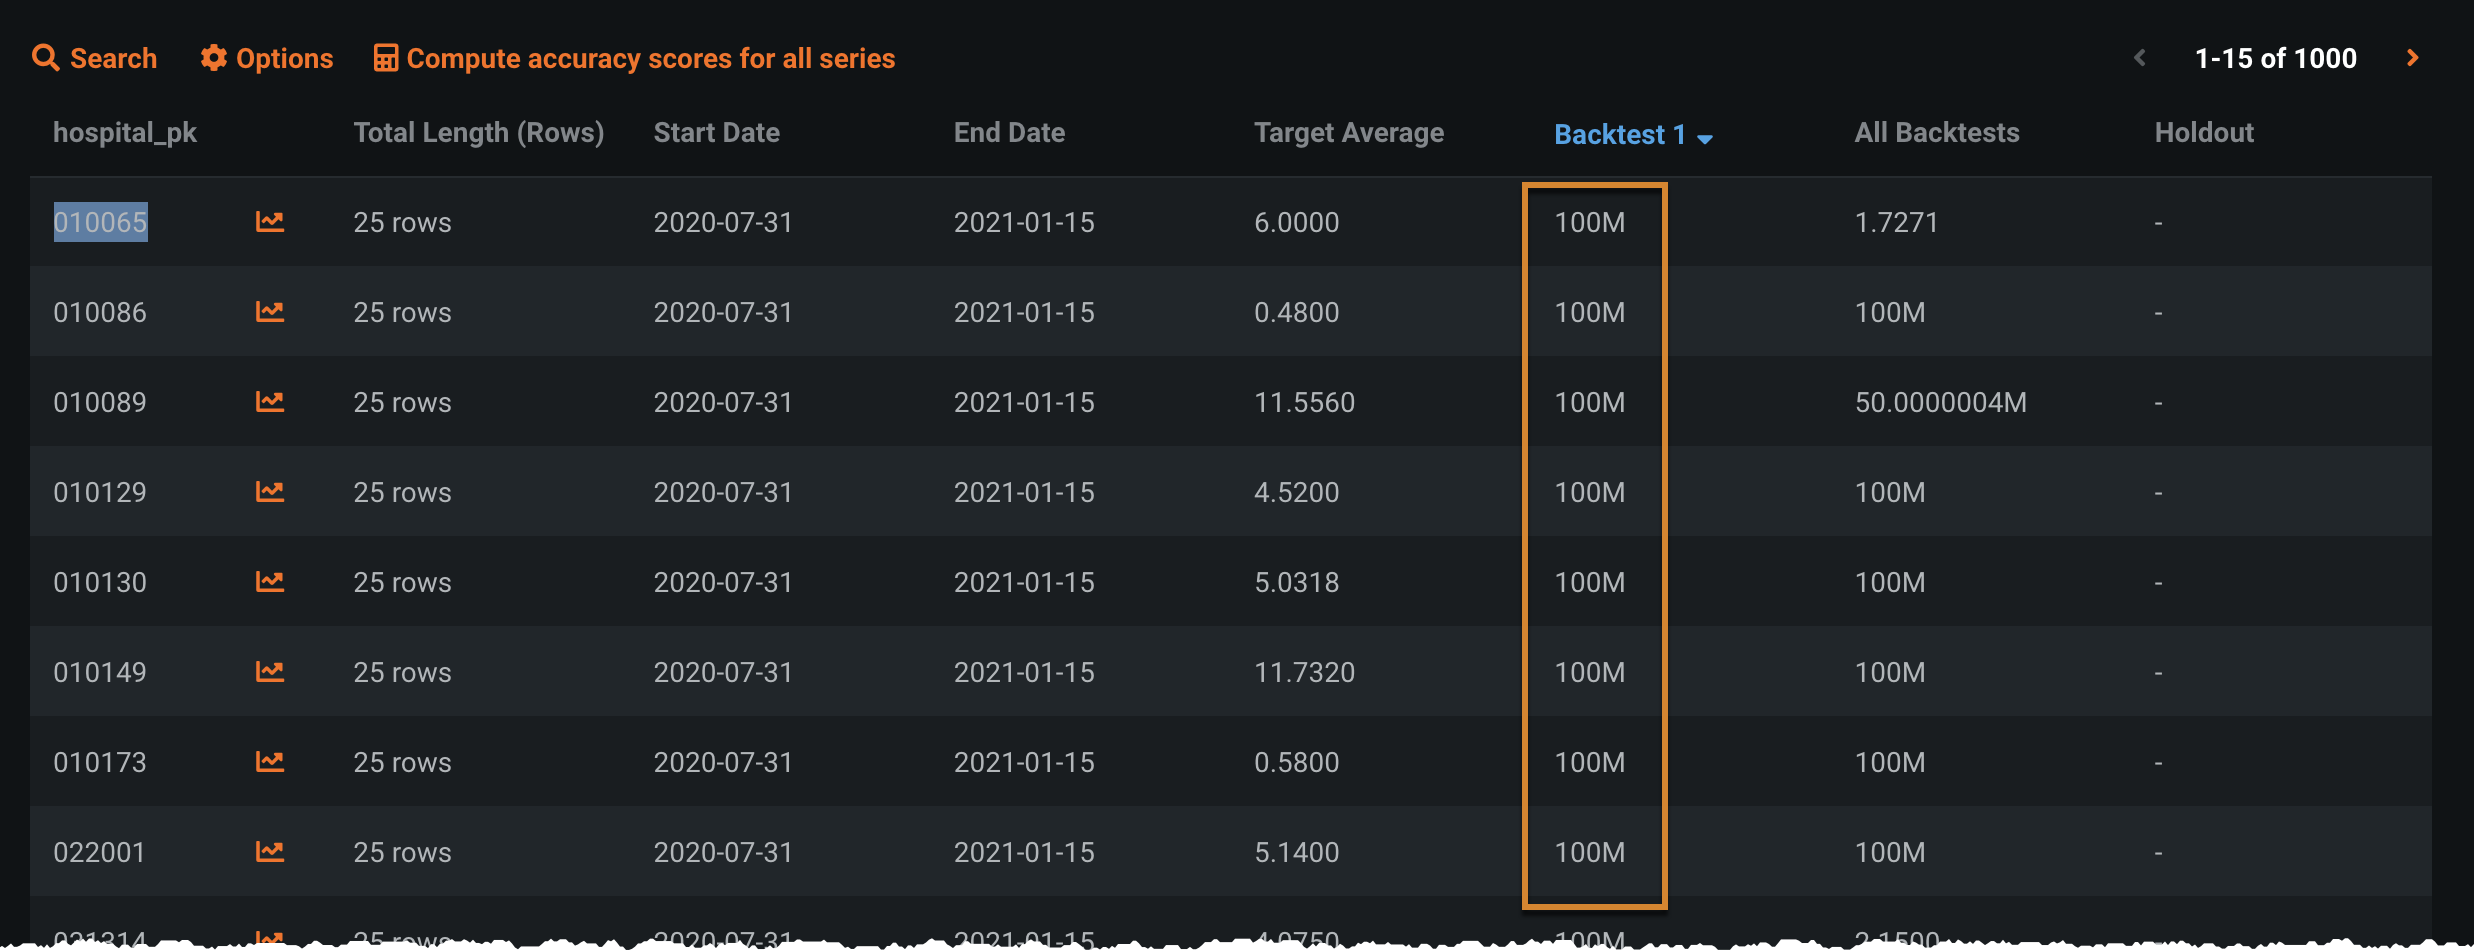
Series Insights handle time-series scaled metrics MASE and Theil's U differently from other metrics. MASE and Theil's U metrics compare the model to a baseline model and are calculated using ratios. As ratios, they can result in values of infinity, so DataRobot caps these values at 100M.
To prevent these high values from distorting the Series Insights histogram plot, DataRobot filters them out of the display. Thy are, however, retained in the corresponding Series Insights table, where they display as the capped value of 100M in backtest columns. The following table displays accuracy using the MASE metric:
For the All Backtests column, DataRobot averages all backtest scores, which can lead to fractions of 100M. If only one of the backtests has an infinity cap, the values are in the range of 100M/number of backtests - 100M (e.g., ~50M for two backtests, ~33M for three backtests, etc.)
