Widgets
Applications are composed of widgets that create visual, interactive, and purpose-driven end-user applications.
There are two main categories of widgets:
- Default widgets are included in every application, no matter the template, and cannot typically be removed.
- Optional widgets can be added to customize an application for your specific use case. All optional widgets, which add visualizations, surface insights, or filter content, must be configured before using an application. If a widget is not configured or is configured incorrectly, DataRobot displays an error message.
The tabs below further describe each widget type:
Applications automatically include the following default widgets to make predictions and view prediction results. Note that time series applications have a different set of default widgets.
| Widget | Description |
|---|---|
| Add Data | Allows you to upload prediction files. |
| All Rows | Displays prediction history by row. |
| Add New Row | Allows you to make single record predictions. |
| General Information | Displays feature values you want to view for each prediction that don't necessarily impact the results. |
| Prediction Information | Displays feature values likely to impact the prediction, as well as Prediction Explanations. |
| Prediction Explanations | Displays a chart with prediction results and a table with Prediction Explanations. |
Filter widgets provide additional filtering options within an application. The table below describes the available filter widgets:
| Widget | Description |
|---|---|
| Categories | Filters by one or more categorical features. |
| Dates | Filters by date features. |
| Numbers | Filters by numeric features. You must define a Min and Max in the widget properties. |
Chart widgets add visualizations to an application and can be configured to surface important insights in your data and prediction results. The table below describes the available chart widgets:
| Widget | Description |
|---|---|
| Line | Displays a Line chart for the selected features—useful for visualizing trends, understanding the distribution of your data, comparing values in larger datasets, and understanding the relationship between value sets. |
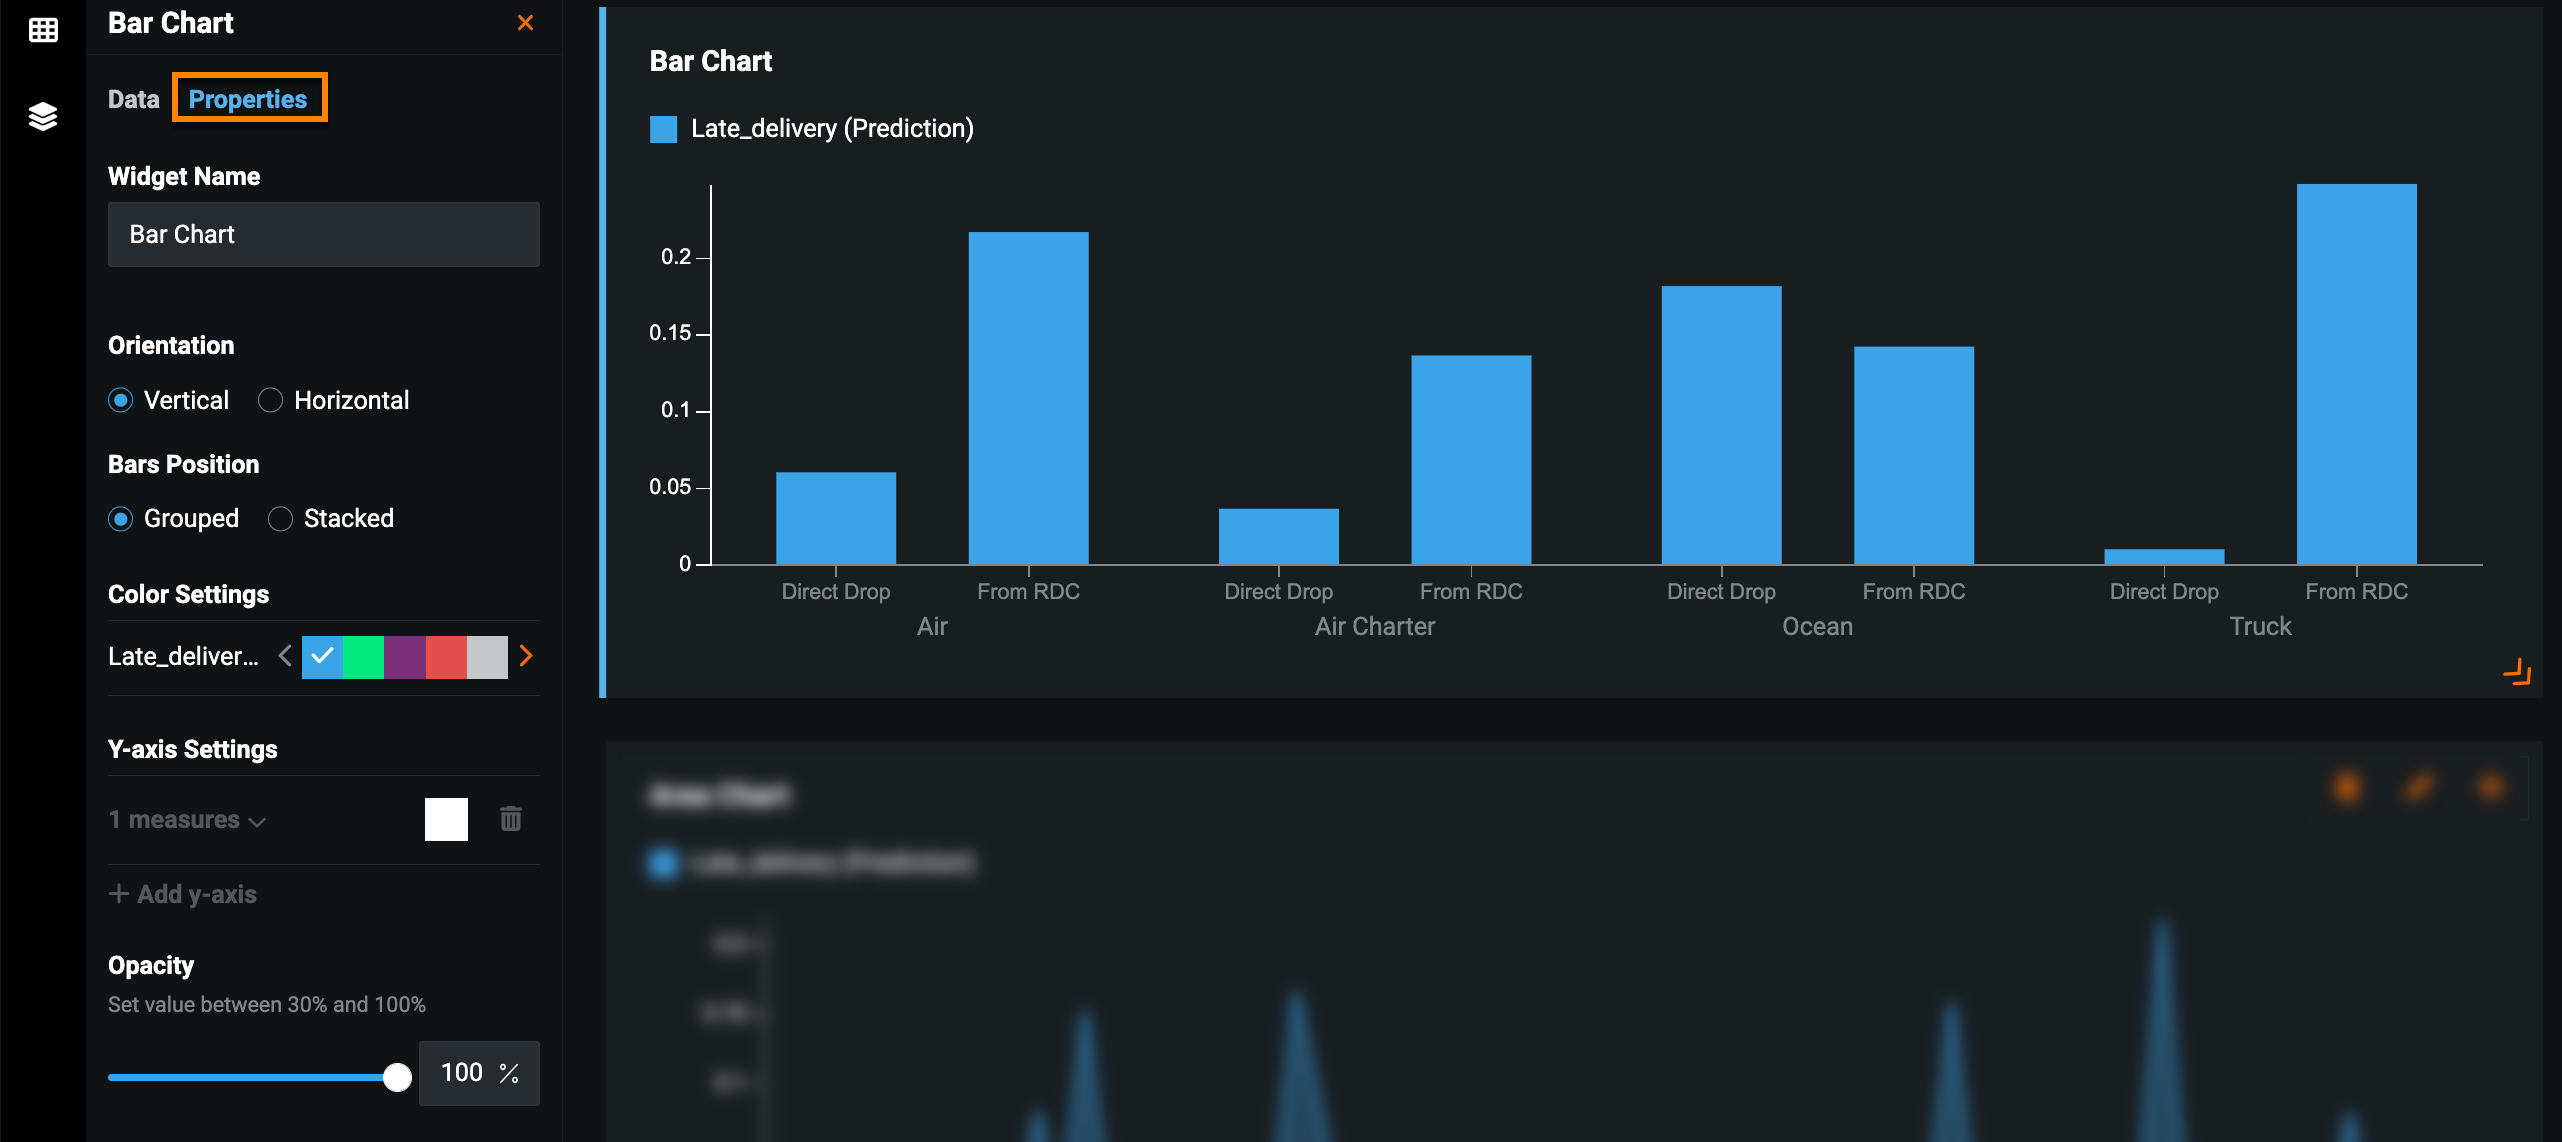
| Bar | Displays a Bar chart for the selected features—useful for understanding the distribution of your data and comparing values in smaller datasets. |
| Line + Bar | Displays a Line and Bar chart for the selected features. You can toggle between the two in the open application. |
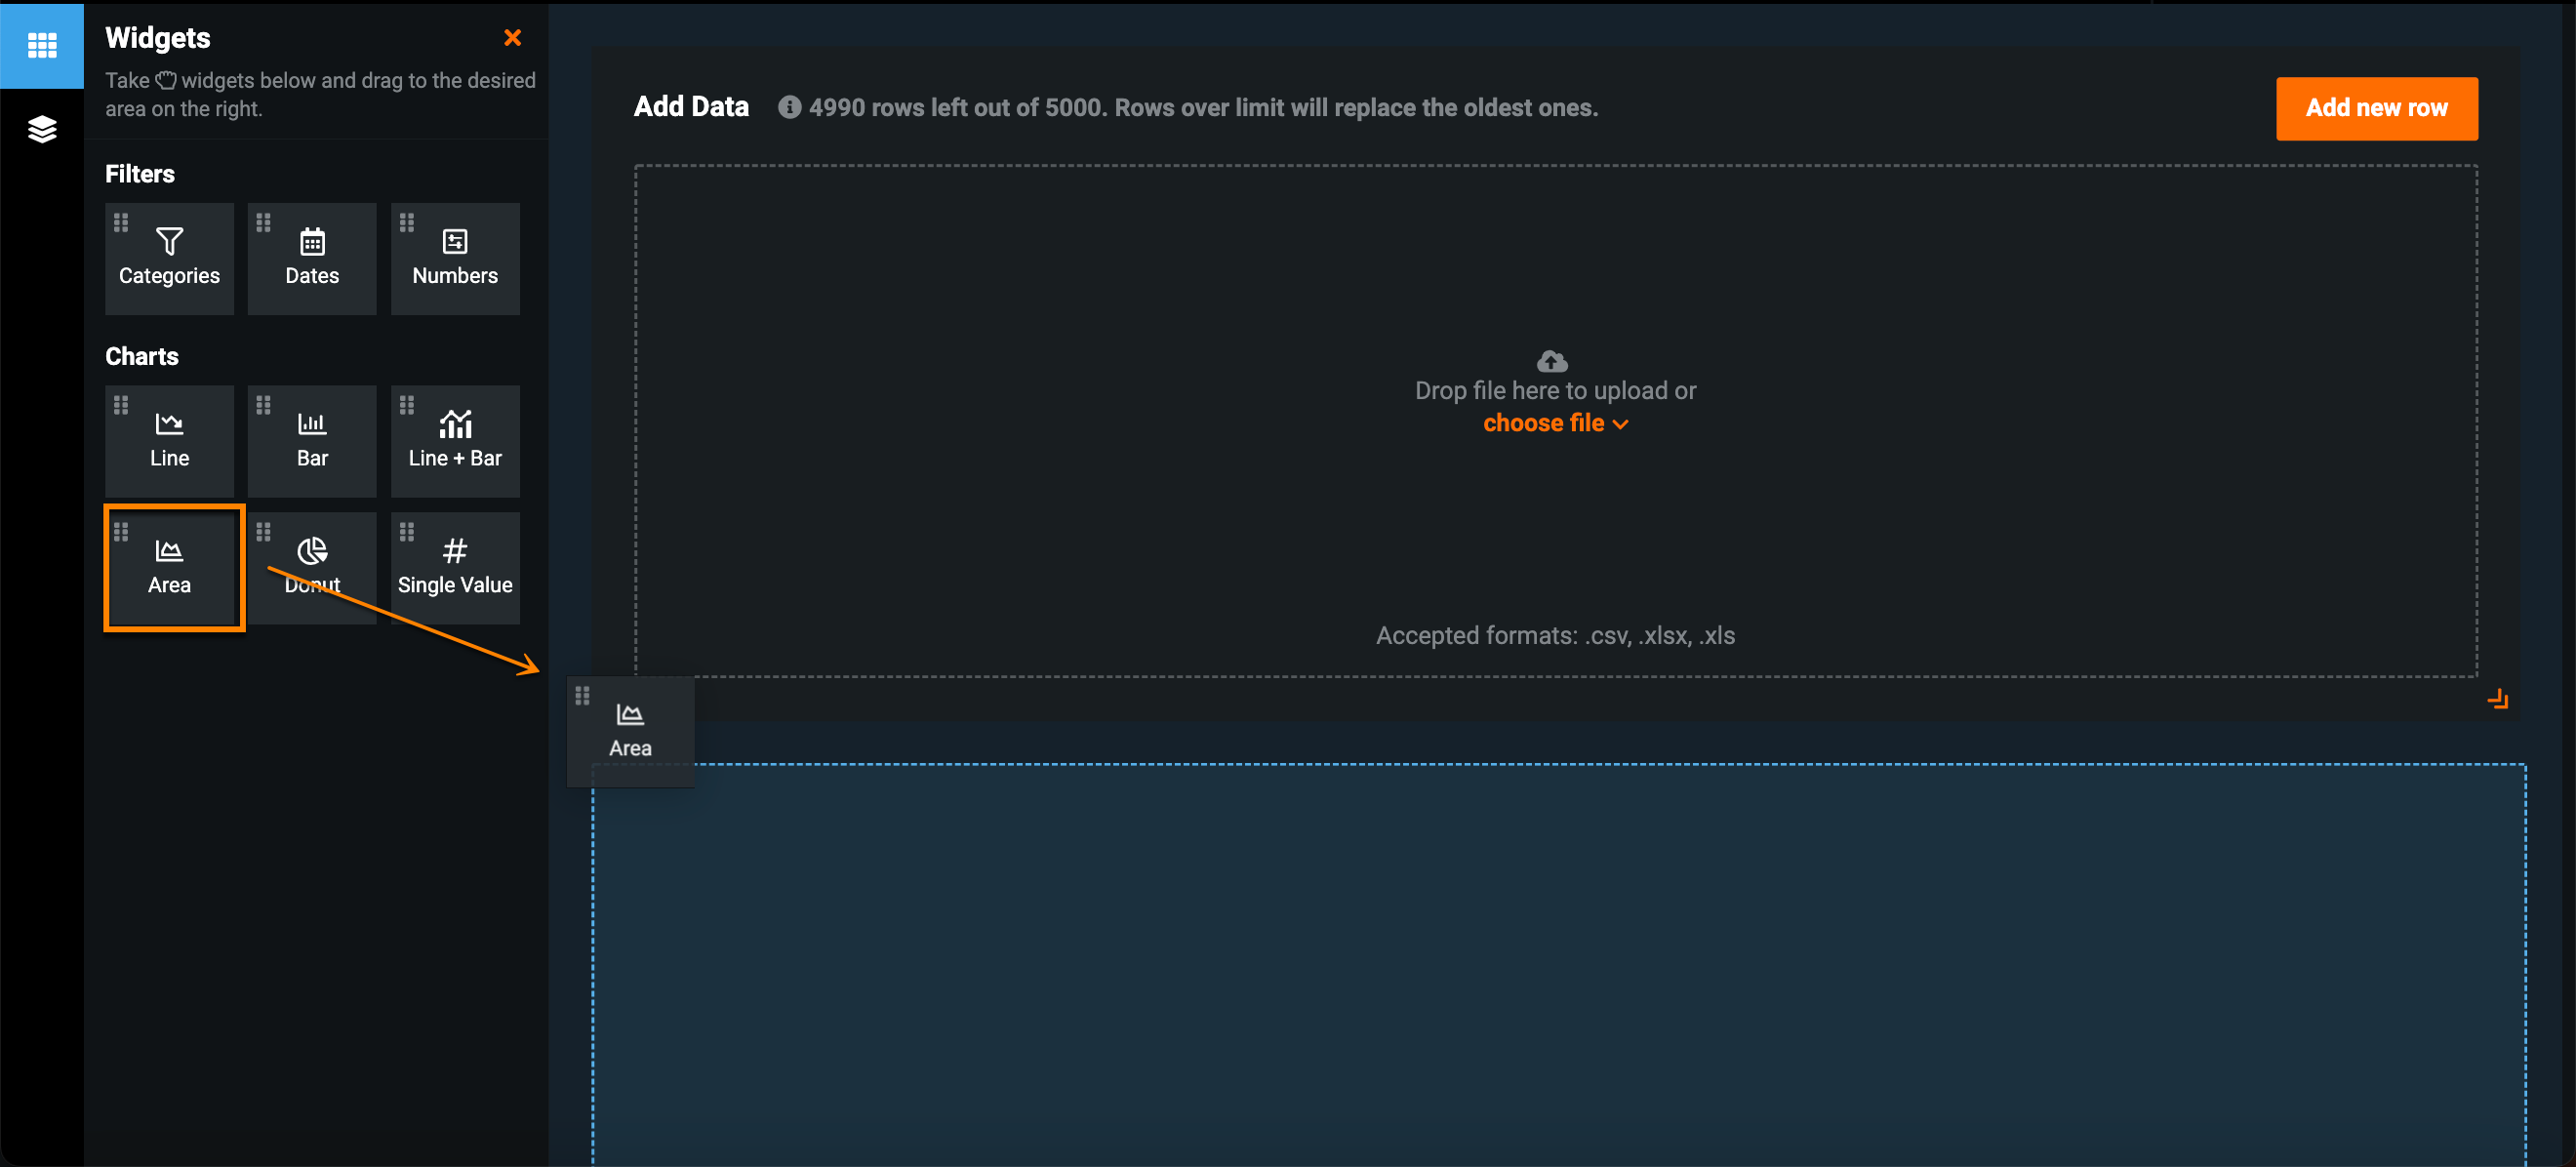
| Area | Displays an Area chart for the selected features—useful for visualizing the composition of data. |
| Donut | Displays a pie chart based on one dimension and one measure—useful for visualizing the composition of data, especially how individual parts compare to the whole. |
| Single Value | Displays the average value of the selected feature. |
The What-if and Optimizer widget can be a scenario comparison tool, a scenario optimizer tool, or both by providing two tools for interacting with prediction results.
The initial configuration of this widget is based on the template selected during app creation.
Add widgets
To add a widget to your application, open the Widget panel ![]() in the upper-left corner, then drag-and-drop a widget from the left pane onto the canvas.
in the upper-left corner, then drag-and-drop a widget from the left pane onto the canvas.
Configure widgets
To configure a widget, either click to select it or hover over the widget and click the pencil icon. Once selected, a panel opens on the left with the tabs described below:
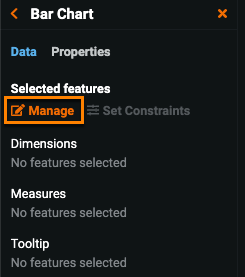
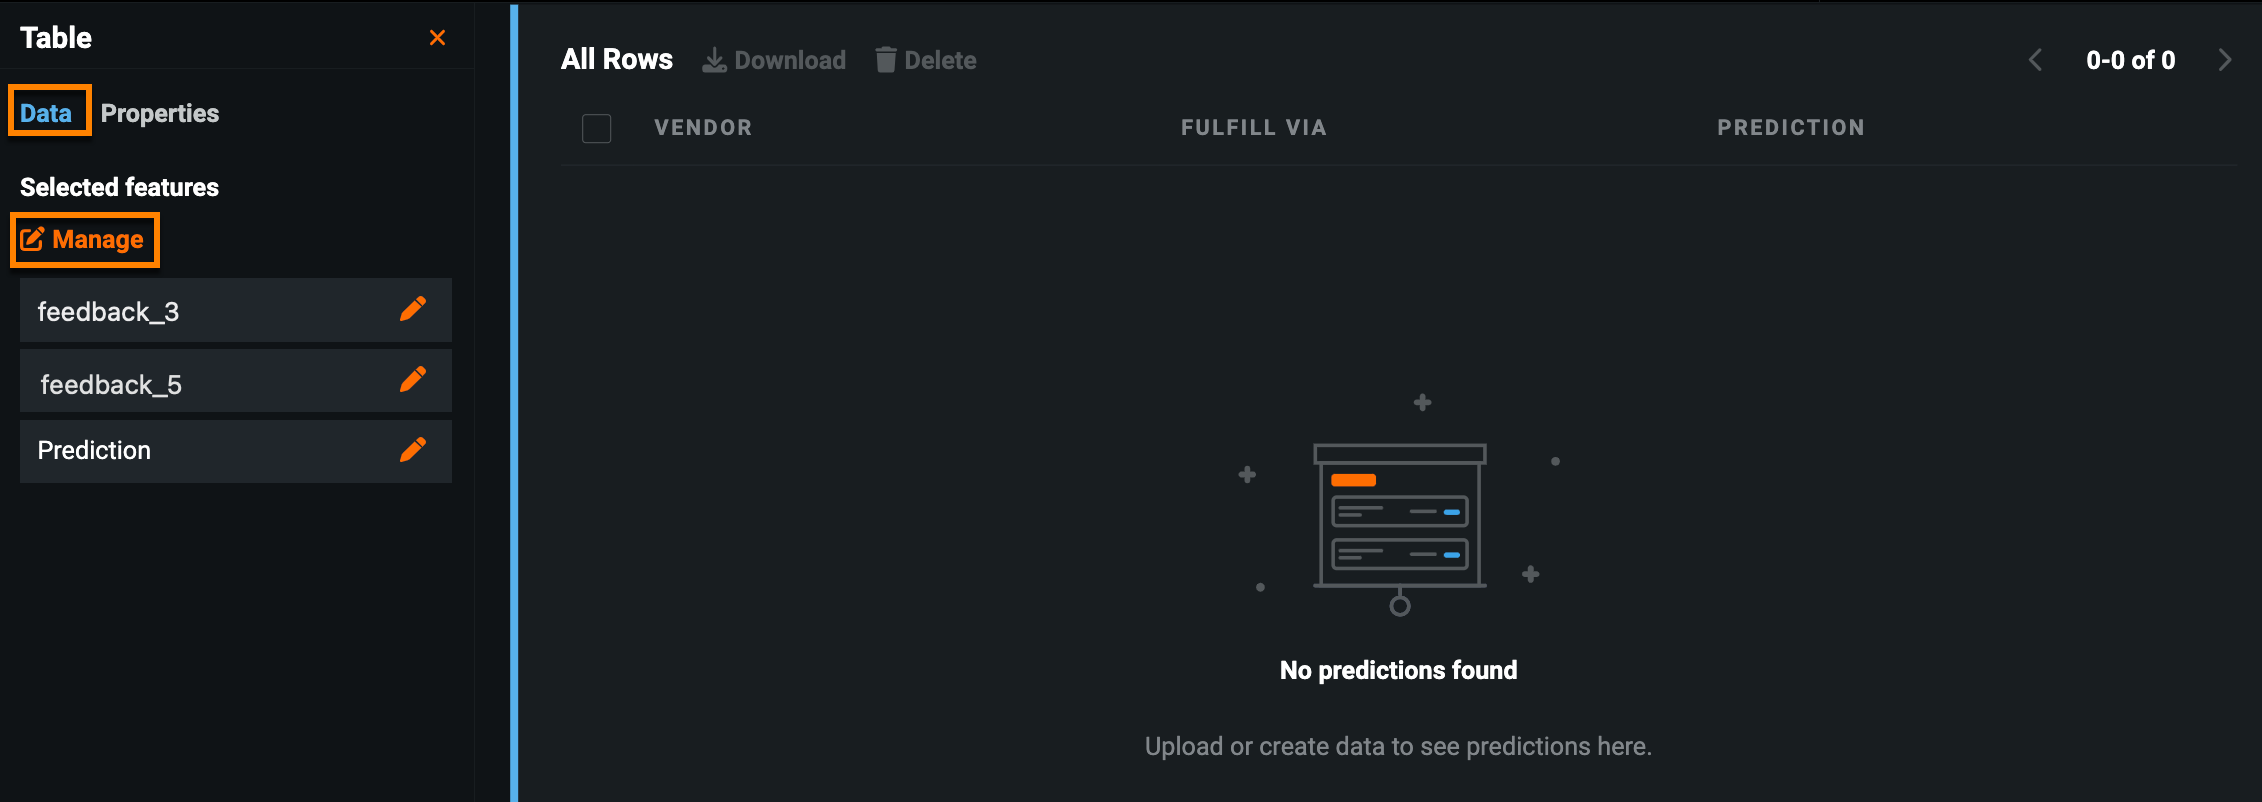
The Data tab allows you to manage widget features, including adding and removing features, changing the feature display name, and setting constraints.
| Name | Element | Description |
|---|---|---|
| 1 | Manage | Adds or removes features from the widget, and add tooltips. |
| 2 | Set Constraints | Adds feature constraints that instruct the app to only include values falling in the range determined by numeric constraints or specific values for a categorical feature. |
| 3 | Dimensions / Measures | Displays the current feature selections for dimensions and measures. Click the pencil icon to change the display name of the feature in the widget. |
| 4 | Tooltips | Displays current feature names and any tooltips manually added in the Manage Feature window. |
Note
Configuration options are based on widget and project type, for example, multiclass projects include additional parameters for the What-if and Optimizer widget.
See also Default widgets or Optional widgets for a complete list of customization options.
Manage widget features
Configuring widget features is an important, and often necessary step when setting up an application. This controls, for example, chart widget visualizations and the features available when making single record predictions.
For many widgets, you must select both a dimension and a feature:
- Dimensions: Features that contain qualitative values used to categorize and reveal details in data.
- Measures: Features with numeric, quantitative values that can be measured.
To manage widget features:
- Select the widget and click the Data tab in the left-hand panel.
-
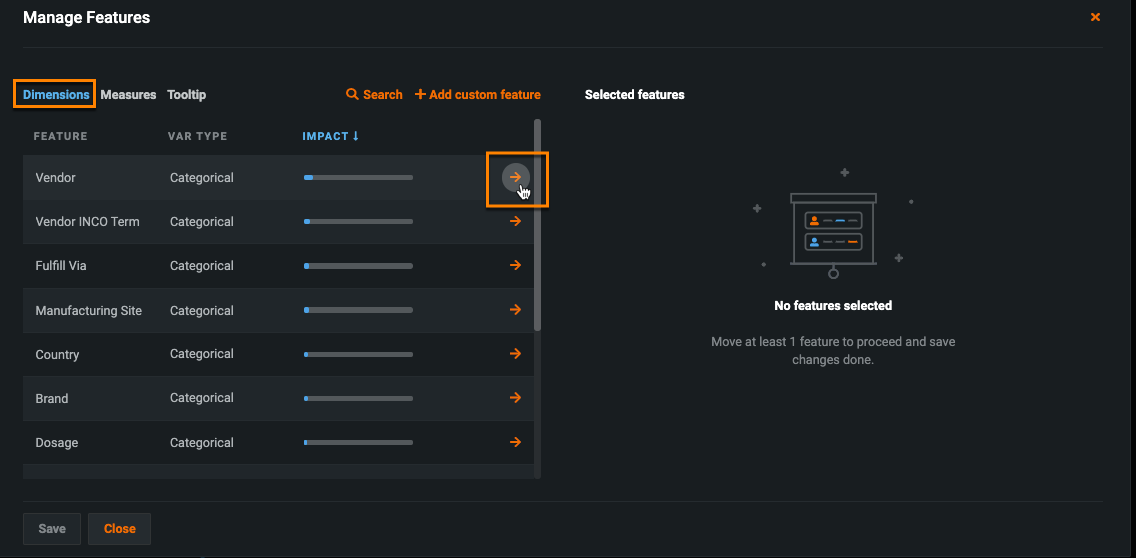
Click Manage. The Manage Feature window opens.
-
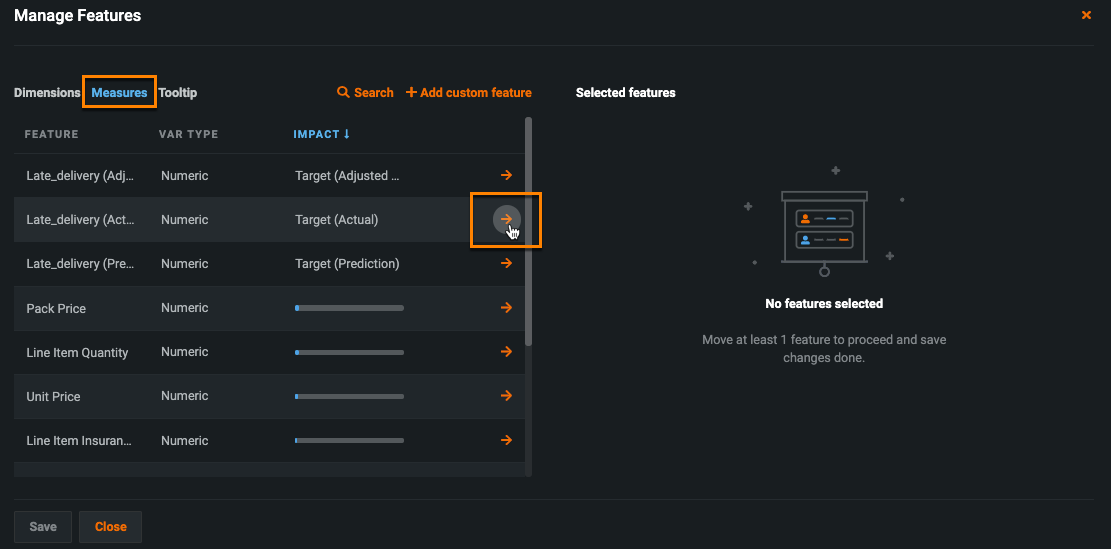
In the Dimensions tab, click the orange arrows next to one or more features you’d like to visualize on the x-axis. You can select categorical, date, and boolean features.
-
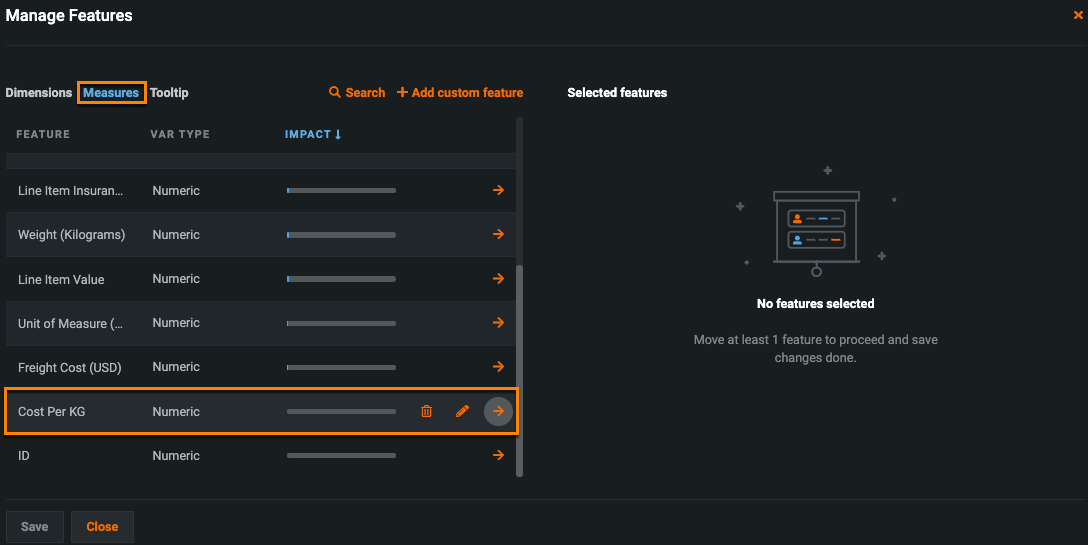
Click Measures and click the arrow next to the feature you'd like to measure on the y-axis. The Measures tab only displays numeric and custom features.
-
Click Save to apply the configuration.
Note
You must select at least one dimension and one measure to configure a widget (with the exception of the Single Value widget).
If the widget displays a yellow error message stating there is no valid data, the application does not have access to the training data. You must create a project from the dataset in the AI Catalog.
Custom features
Similar to feature transformations in the main DataRobot platform, you can create custom features for chart widgets in your application.
-
In the Manage Feature window, click Add custom feature.
-
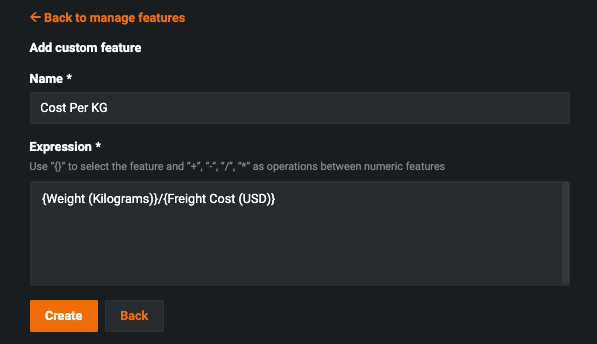
Name the custom feature, then type the function and features using the supported syntax. The example below measures the cost of shipments per kilogram.
-
Click Create. The custom feature appears in the Measures tab of the Manage Features window.
Note
You can only use numeric features to create custom feature expressions.
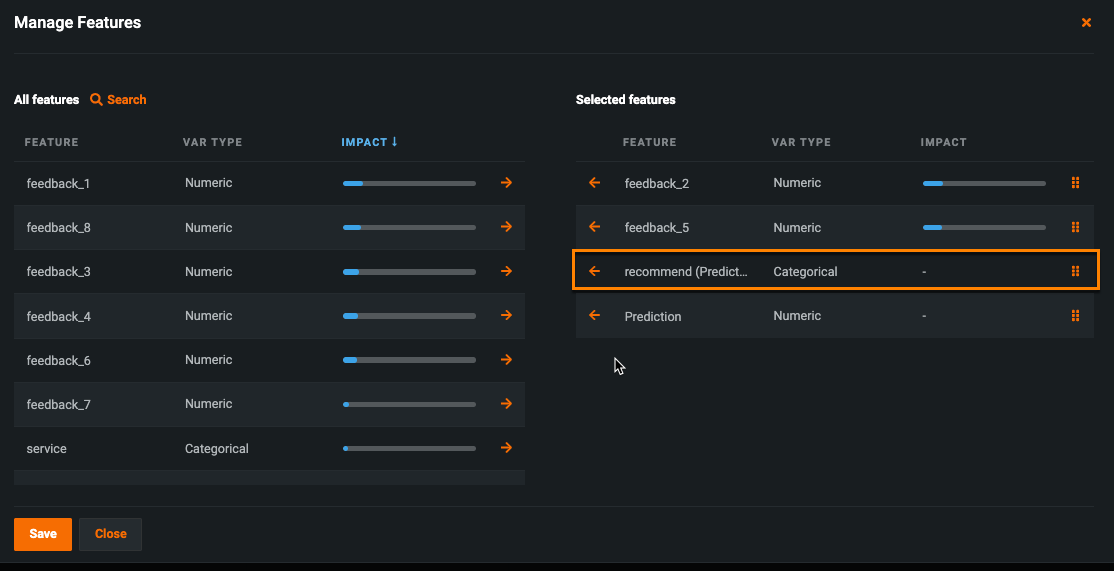
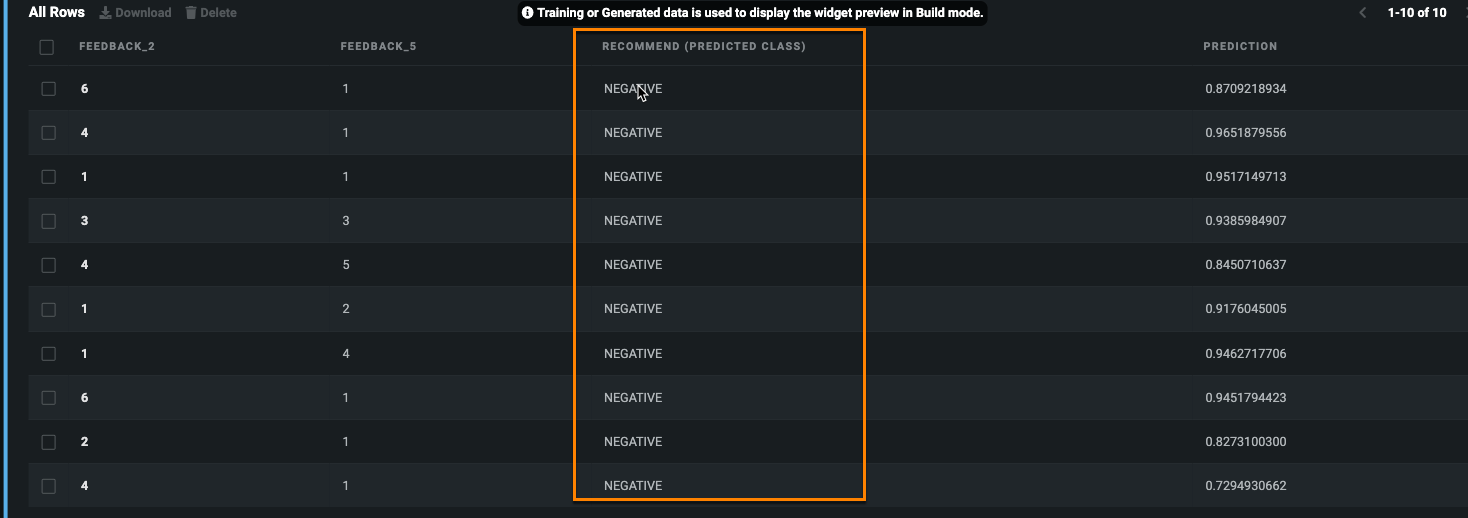
Add a predicted class for multiclass projects
For multiclass projects, you can add the predicted class field to the All Rows widget.
