Select data and display threshold
To use ROC Curve tab visualizations, you select a data source and a display threshold. These values drive the ROC Curve visualizations:
- Confusion matrix
- Prediction Distribution graph
- ROC curve
- Profit curve
- Cumulative charts
- Custom charts
- Metrics
Select data for visualizations
To select the data source reflected in ROC Curve visualizations:
-
Select a model on the Leaderboard and navigate to Evaluate > ROC Curve.
-
Click the Data Selection dropdown menu above the Prediction Distribution graph and select a data source to view in the visualizations.
Note
The Data Selection list includes only the partitions that have been enabled and run. The list includes all test datasets that have been added to the project; test dataset selections are inactive until they are run. Time-aware modeling allows backtest-based selections.
Selection Description Holdout Visualizations use the holdout partition. Holdout does not appear in the selection list if holdout has not been unlocked for the model and run. Cross Validation Visualizations use the cross-validation partition. DataRobot "stacks" the cross-validation folds (5 by default) and computes the visualizations on the combined data. Validation Visualizations use the validation partition. External test data Visualizations use the data for an external test you have run. If you've added a test dataset but have not yet run it, that test dataset selection is inactive. Add external test data If you select Add external data, the Predict > Make Predictions tab displays. Use the tab to add test data and run an external test. Then return to the ROC Curve tab, click Data Selection, and select the test data you ran. -
View the ROC Curve tab visualizations. Update the display threshold (see below) as necessary to meet your modeling goals.
Set the display threshold
The display threshold is the basis for several visualizations on the ROC Curve tab. The threshold you set updates the Prediction Distribution graph, as well as the Chart, Matrix, and Metrics panes described in the following sections. Experiment with the threshold to meet your modeling goals.
Deep dive: Threshold
A threshold for a classification model is the point that sets the class boundary for a predicted value. The model classifies an observation below the threshold as "false," and an observation above the threshold as "true." In other words, DataRobot automatically assigns the positive class label to any prediction exceeding the threshold.
There are two thresholds you can modify:
- The display threshold: Updates the visualizations on the ROC Curve tab.
- The prediction threshold: Changes the threshold (and thus, the label) for all predictions made using this model.
You have a choice of two bases for the display threshold—a prediction value (0-1) or a prediction percentage. The prediction value represents the numeric value used to determine the class boundary. The percentage option allows you to set the top or bottom n% of records that are categorized as one class or another. You may want to do this, for example, to filter top predictions and compute recall using that boundary. Then, you can use the value as a comparison metric or to simply inspect the top percentage of records.
To set the display threshold:
-
On the ROC Curve tab, click the Display Threshold dropdown menu.
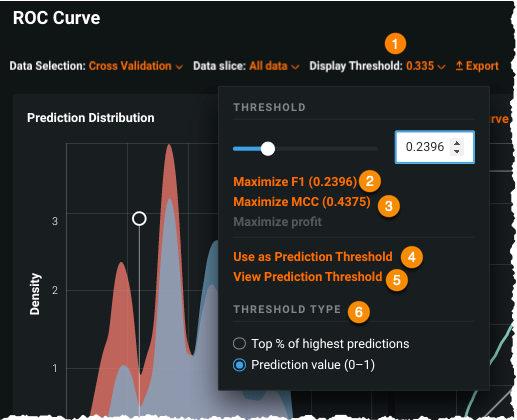
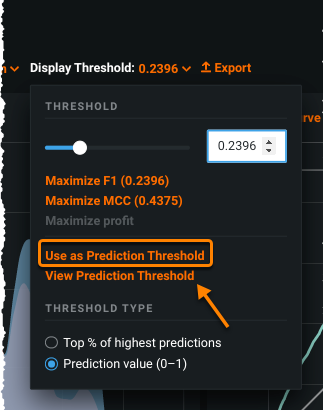
Element Description 1 Display Threshold Displays the threshold value you set. Click to select the threshold settings. Note that you can also update the display threshold by clicking in the Prediction Distribution graph. The Display Threshold defaults to maximize F1.
If you switch to a different model, the Display Threshold updates to maximize F1 for the new model. This allows you to easily compare classification results between models. If you select a different data source (by selecting Holdout, Cross Validation, or Validation in the Data Selection list), the Display Threshold updates to maximize F1 for the new data.2 Threshold Drag the slider or enter a display threshold value; the visualization tools update accordingly. 3 Maximize option Select a threshold that maximizes metrics such as the F1 score, MCC (Matthews Correlation Coefficient), or profit. To maximize for profit, first set a payoff by clicking +Add payoff on the Matrix pane.
The metrics values on the ROC curve display might not always match those shown on the Leaderboard. For ROC curve metrics, DataRobot keeps up to 120 of the calculated thresholds that best represent the distribution. Because of this, minute details might be lost. For example, if you select Maximize MCC as the display threshold, DataRobot preserves the top 120 thresholds and calculates the maximum among them. This value is usually very close but may not exactly match the metric value.4 Use as Prediction Threshold Click to set the Prediction Threshold to the current value of the Display Threshold. By doing so, at prediction time, the threshold value serves as the boundary between positive and negative classifications—observations above the threshold receive the positive class's label and those below the threshold receive the negative class's label. The Prediction Threshold is used when you generate profit curves and when you make predictions. 5 View Prediction Threshold Click to reset the visualization components (graphs and charts) to the model's prediction threshold. 6 Threshold Type Select Top % of highest predictions or a Prediction value (0 - 1). See Threshold Type for details. In this example, the Display Threshold is set to 0.2396, which maximizes the F1 score.
-
View the updated visualizations. Valid input for the Display Threshold changes the following page elements:
- Updated values are displayed in the Metrics pane and the confusion matrix (in the Matrix pane).
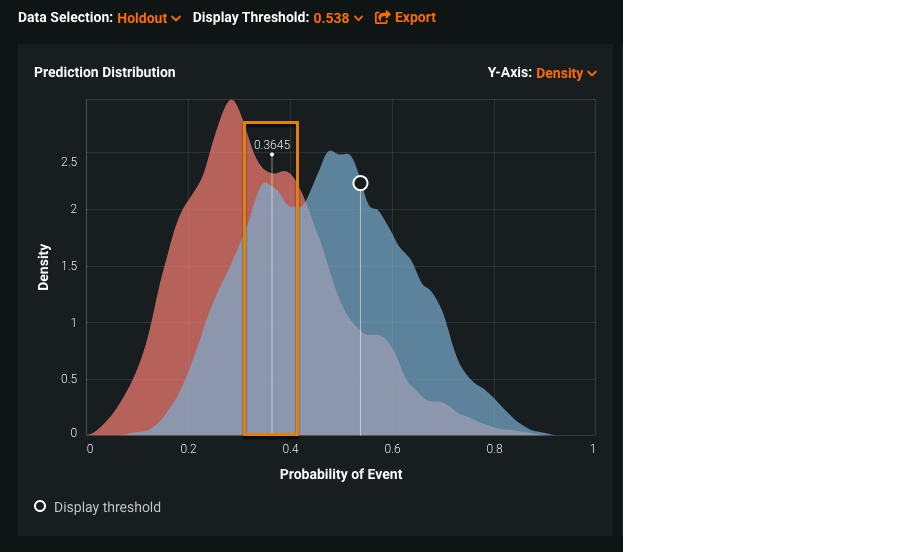
- The dividing line on the Prediction Distribution graph moves to the selected value and is marked with a circle.
- On the current curve displayed in the Charts pane—for example, a ROC curve or a profit curve—the new point is selected (indicated by a circle). Some curves also have line intercepts corresponding to the point.
Note
The displays for the visualizations represents the closest data point to the specified threshold (i.e., if you entered 20%, the display might actually be something like 20.7%). The box reports the exact value after you enter return.
Methods of setting the display threshold
Click a tab to view alternative methods of setting the display threshold:
-
On the ROC Curve tab, click the Display Threshold dropdown menu.
-
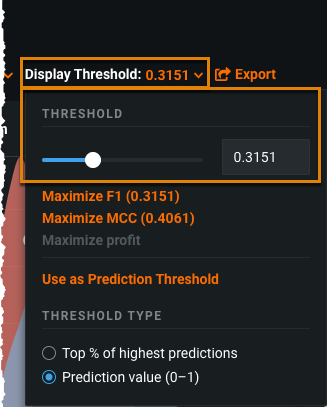
Use the slider or enter a value to set the display threshold.
If the Threshold Type is Top %, enter a value between 0 and 100 (which will update to the exact point after entry). If the Threshold Type is Prediction value, enter a number between 0.0 and 1.0. If the input is not valid, a warning appears to the right.
-
Click outside of the dropdown to view the effects of the display threshold on the visualization tools.
-
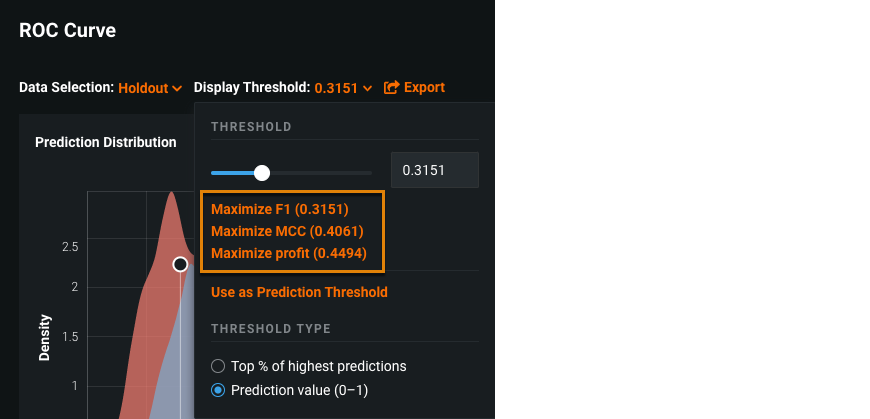
Select a metric maximum to use for the display threshold. Choose from F1, MCC, or profit. The metrics' maximum values display:
Note
You must set the Matrix pane to a Payoff Matrix to be able to maximize profit. Otherwise, the Maximize profit option is grayed out.
-
Click outside of the dropdown to view the effects of the display threshold on the visualization tools.
Set the prediction threshold
Prediction requests for binary classification models return both a probability of the positive class and a label. Although DataRobot automatically calculates a threshold (the display threshold), when applying the label at prediction time, the threshold value defaults to 0.5. In the resulting predictions, records with values above the threshold will have the positive class's label (in addition to the probability) based on this threshold. If this value causes a need for post-processing predictions to apply the actual threshold label, you can bypass that step by changing the prediction threshold.
To set the prediction threshold:
-
On the ROC Curve tab, click the Display Threshold dropdown menu.
-
Update the display threshold if necessary.
-
Select Use as Prediction Threshold.
Once deployed, all predictions made with this model that fall above the new threshold will return the positive class label.
The Prediction Threshold value set here is also saved to the following tabs:
Changing the value in any of these tabs writes the new value back to all the tabs. Once a model is deployed, the threshold cannot be changed within that deployment.
To return the setting to the default threshold value of 0.5, click View Prediction Threshold.
