Service Health tab
The Service Health tab tracks metrics about a deployment's ability to respond to prediction requests quickly and reliably. This helps identify bottlenecks and assess capacity, which is critical to proper provisioning.
For example, if a model seems to have generally slowed in its response times, the Service Health tab for the model's deployment can help. You might notice in the tab that median latency goes up with an increase in prediction requests. If latency increases when a new model is switched in, you can consult with your team to determine whether the new model can instead be replaced with one offering better performance.
To access Service Health, select an individual deployment from the deployment inventory page and, from the resulting Overview page, choose the Service Health tab. The tab provides informational tiles and a chart to help assess the activity level and health of the deployment.
Time of Prediction
The Time of Prediction value differs between the Data drift and Accuracy tabs and the Service health tab:
-
On the Service health tab, the "time of prediction request" is always the time the prediction server received the prediction request. This method of prediction request tracking accurately represents the prediction service's health for diagnostic purposes.
-
On the Data drift and Accuracy tabs, the "time of prediction request" is, by default, the time you submitted the prediction request, which you can override with the prediction timestamp in the Prediction History and Service Health settings.
Use the time range and resolution dropdowns
The controls—model version and data time range selectors—work the same as those available on the Data Drift tab. The Service Health tab also supports segmented analysis, allowing you to view service health statistics for individual segment attributes and values.
Understand the metric tiles
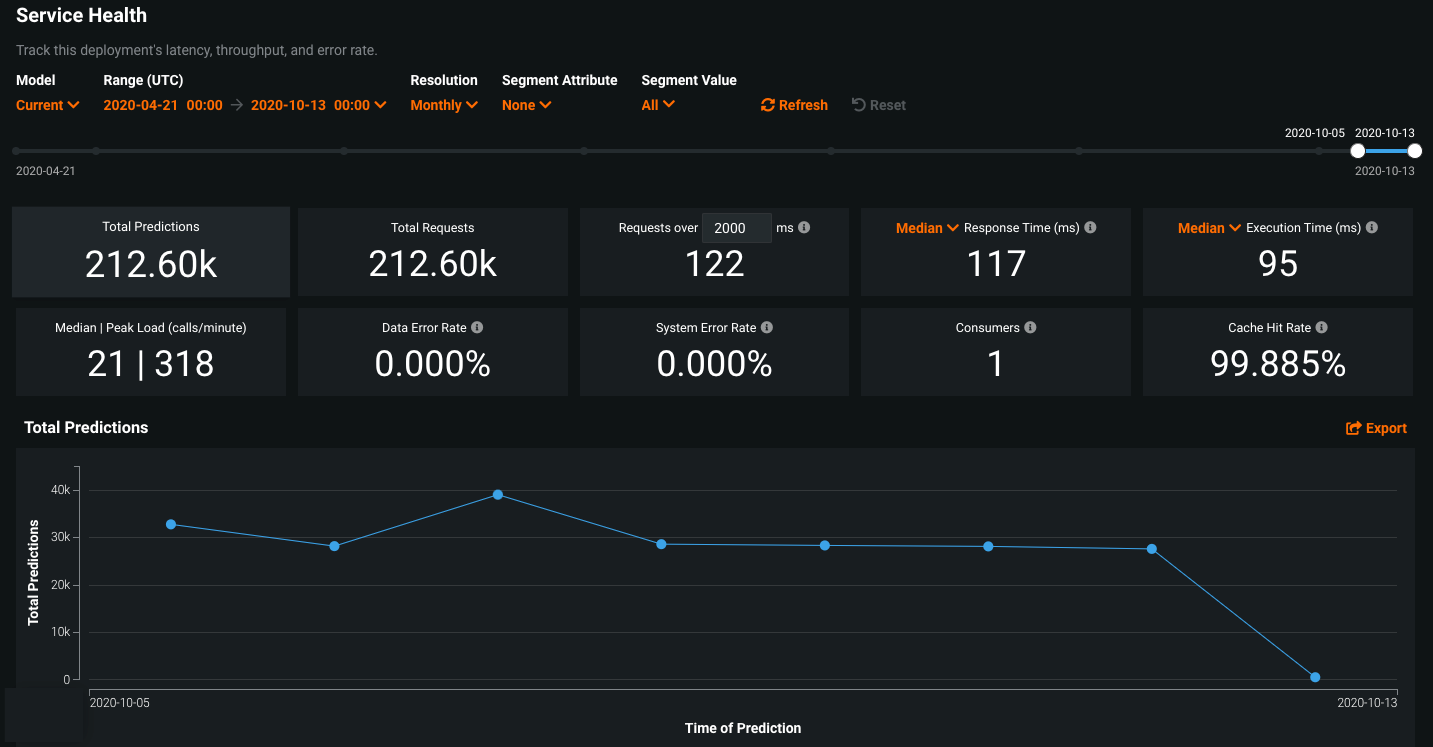
DataRobot displays informational statistics based on your current settings for model and time frame. That is, tile values correspond to the same units as those selected on the slider. If the slider interval values are weekly, the displayed tile metrics show values corresponding to weeks. Clicking a metric tile updates the chart below.
The Service health tab reports the following metrics on the dashboard:
Service health information for external models and monitoring jobs
Service health information is unavailable for external agent-monitored deployments and deployments with predictions uploaded through a prediction monitoring job.
| Statistic | Reports for selected time period... |
|---|---|
| Total Predictions | The number of predictions the deployment has made (per prediction node). |
| Total Requests | The number of prediction requests the deployment has received (a single request can contain multiple prediction requests). |
| Requests over... | The number of requests where the response time was longer than the specified number of milliseconds. The default is 2000 ms; click in the box to enter a time between 10 and 100,000 ms or adjust with the controls. |
| Response Time | The time (in milliseconds) DataRobot spent receiving a prediction request, calculating the request, and returning a response to the user. The report does not include time due to network latency. Select the median prediction request time or 90th, 95th, or 99th percentile. The display reports a dash if you have made no requests against it or if it's an external deployment. |
| Execution Time | The time (in milliseconds) DataRobot spent calculating a prediction request. Select the median prediction request time or 90th, 95th, or 99th percentile. |
| Median/Peak Load | The median and maximum number of requests per minute. |
| Data Error Rate | The percentage of requests that result in a 4xx error (problems with the prediction request submission). This is a component of the value reported as the Service Health Summary in the Deployments page top banner. |
| System Error Rate | The percentage of well-formed requests that result in a 5xx error (problem with the DataRobot prediction server). This is a component of the value reported as the Service Health Summary in the Deployments page top banner. |
| Consumers | The number of distinct users (identified by API key) who have made prediction requests against this deployment. |
| Cache Hit Rate | The percentage of requests that used a cached model (the model was recently used by other predictions). If not cached, DataRobot has to look the model up, which can cause delays. The prediction server cache holds 16 models by default, dropping the least-used dropped when the limit is reached. |
Understand the Service Health chart
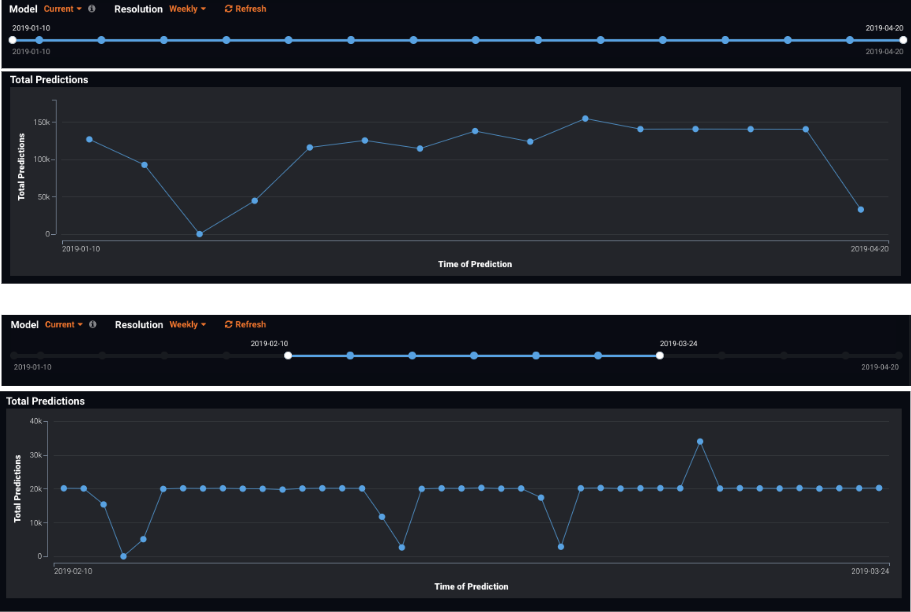
The chart below the tiled metrics displays individual metrics over time, helping to identify patterns in the quality of service. Clicking on a metric tile updates the chart to represent that information; you can also export it. Adjust the data range slider to narrow in on a specific period:
Some charts will display multiple metrics:
View MLOps Logs
On the MLOps Logs tab, you can view important deployment events. These events can help diagnose issues with a deployment or provide a record of the actions leading to the current state of the deployment. Each event has a type and a status. You can filter the event log by event type, event status, or time of occurrence, and you can view more details for an event on the Event Details panel.
-
On a deployment's Service Health page, scroll to the Recent Activity section at the bottom of the page.
-
In the Recent Activity section, click MLOps Logs.
-
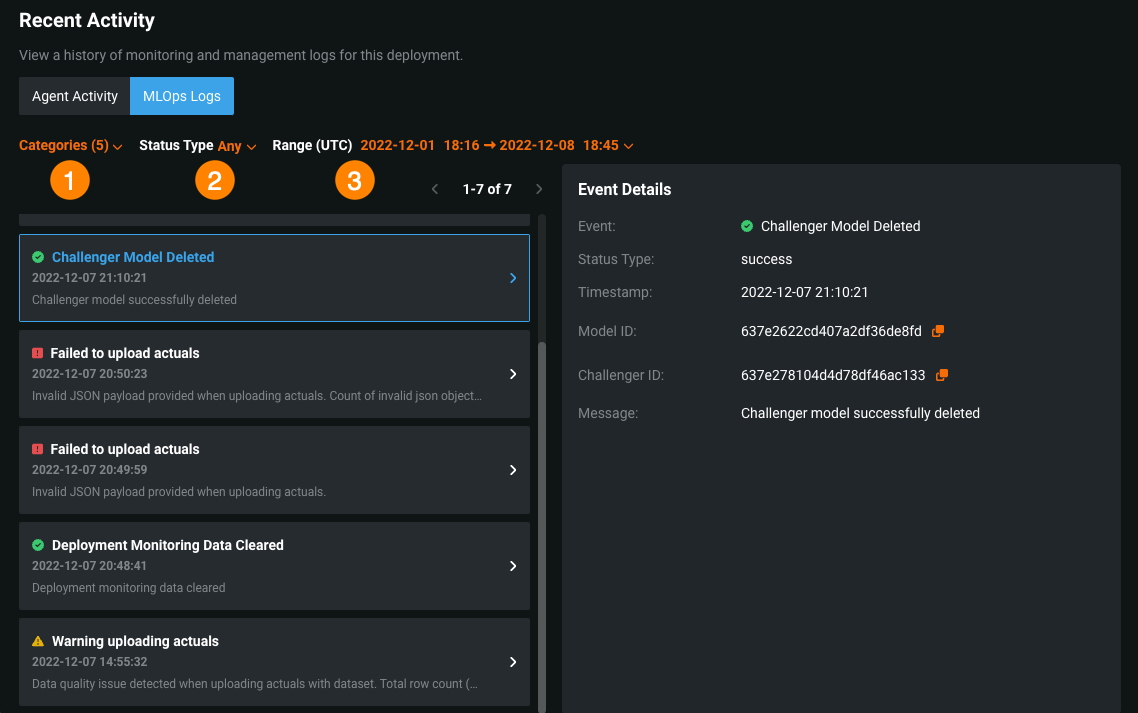
Under MLOps Logs, configure any of the following filters:
Element Description 1 Set the Categories filter to display log events by deployment feature: - Accuracy: events related to actuals processing.
- Challengers: events related to challengers functionality.
- Monitoring: events related to general deployment actions; for example, model replacements or clearing deployment stats.
- Predictions: events related to predictions processing.
- Retraining: events related to deployment retraining functionality.
2 Set the Status Type filter to display events by status: - Success
- Warning
- Failure
- Info
3 Set the Range (UTC) filter to display events logged within the specified range (UTC). The default filter displays the last seven days up to the current date and time. What errors are surfaced in the MLOps Logs?
- Actuals with missing values
- Actuals with duplicate association ID
- Actuals with invalid payload
- Challenger created
- Challenger deleted
- Challenger replay error
- Challenger model validation error
- Custom model deployment creation started
- Custom model deployment creation completed
- Custom model deployment creation failed
- Deployment historical stats reset
- Failed to establish training data baseline
- Model replacement validation warning
- Prediction processing limit reached
- Predictions missing required association ID
- Reason codes (prediction explanations) preview failed
- Reason codes (prediction explanations) preview started
- Retraining policy success
- Retraining policy error
- Training data baseline calculation started
-
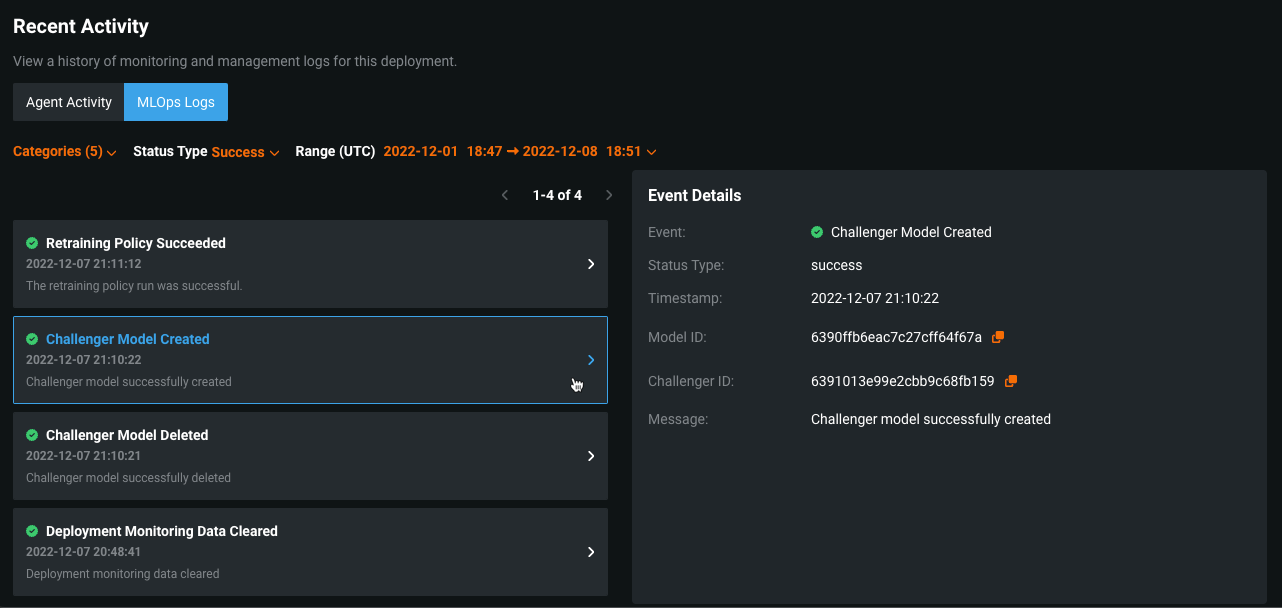
On the left panel, the MLOps Logs list displays deployment events with any selected filters applied. For each event, you can view a summary that includes the event name and status icon, the timestamp, and an event message preview.
-
Click the event you want to examine and review the Event Details panel on the right.
This panel includes the following details:
- Title
- Status Type (with a success, warning, failure, or info label)
- Timestamp
- Message (with text describing the event)
You can also view the following details if applicable to the current event:
- Model ID
- Model Package ID / Registered Model Version ID (with a link to the package in the Model Registry if MLOps is enabled)
- Catalog ID (with a link to the dataset in the AI Catalog)
- Challenger ID
- Prediction Job ID (for the related batch prediction job)
- Affected Indexes (with a list of indexes related to the error event)
- Start/End Date (for events covering a specified period; for example, resetting deployment stats)


