Insights
The Insights tab lets you view and analyze visualizations for your project, switching between models to make comparisons.
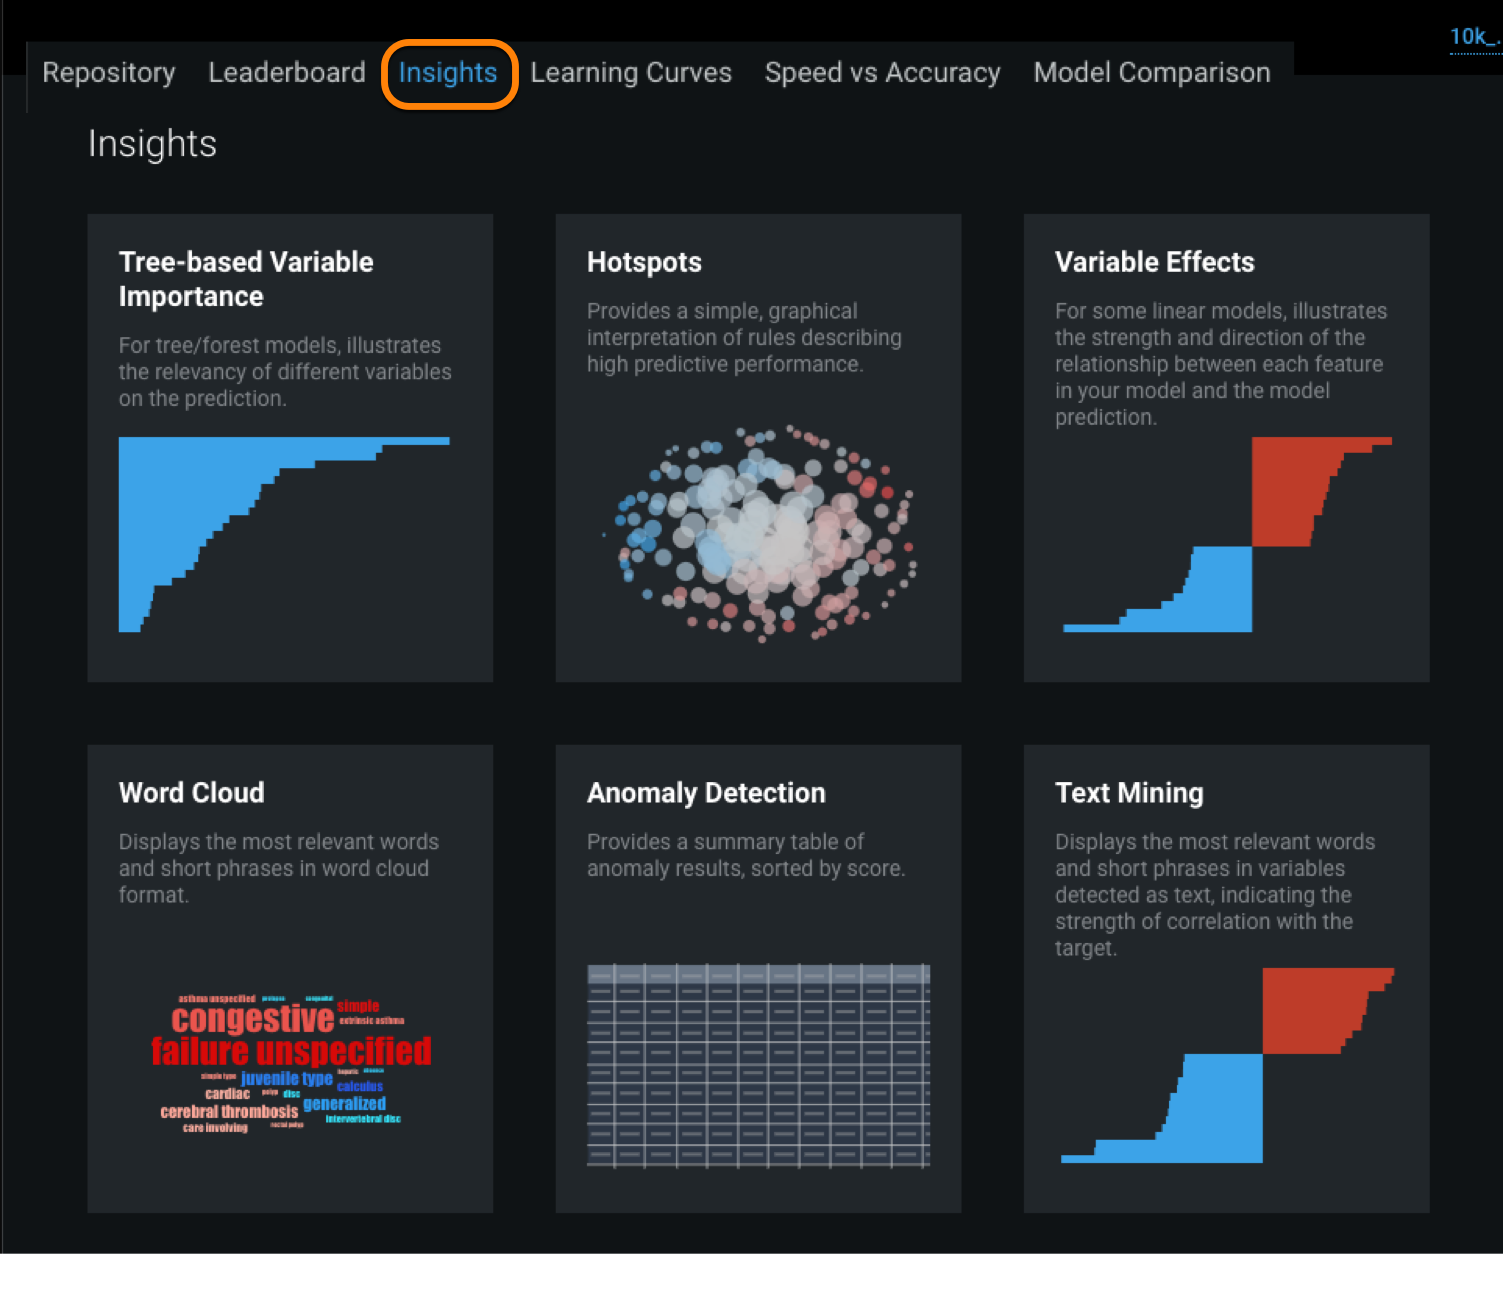
The following table lists the insight visualizations, descriptions, and data sources used. Click the links for details on analyzing the visualizations. Note that availability of visualization tools is based on project type.
| Insight tiles | Description | Source |
|---|---|---|
| Activation Maps | Visualizes areas of images that a model is using when making predictions. | Training data |
| Anomaly Detection | Provides a summary table of anomalous results sorted by score. | From training data, the most anomalous rows (those with the highest scores) |
| Category Cloud | Visualizes relevancy of a collection of categories from summarized categorical features. | Training data |
| Hotspots | Indicates predictive performance. | Training data |
| Image Embeddings | Displays a projection of images onto a two-dimensional space defined by similarity. | Training data |
| Text Mining | Visualizes relevancy of words and short phrases. | Training data |
| Tree-based Variable Importance | Ranks the most important variables in a model. | Training data |
| Variable Effects | Illustrates the magnitude and direction of a feature's effect on a model's predictions. | Validation data |
| Word Cloud | Visualizes variable keyword relevancy. | Training data |
Work with Insights
-
Navigate to Models > Insights and click an insight tile (see Insight visualizations for a complete list).
Note
The particular insights that display are dependent on the model type, which is in turn dependent on the project type. In other words, not every insight is available for every project.
-
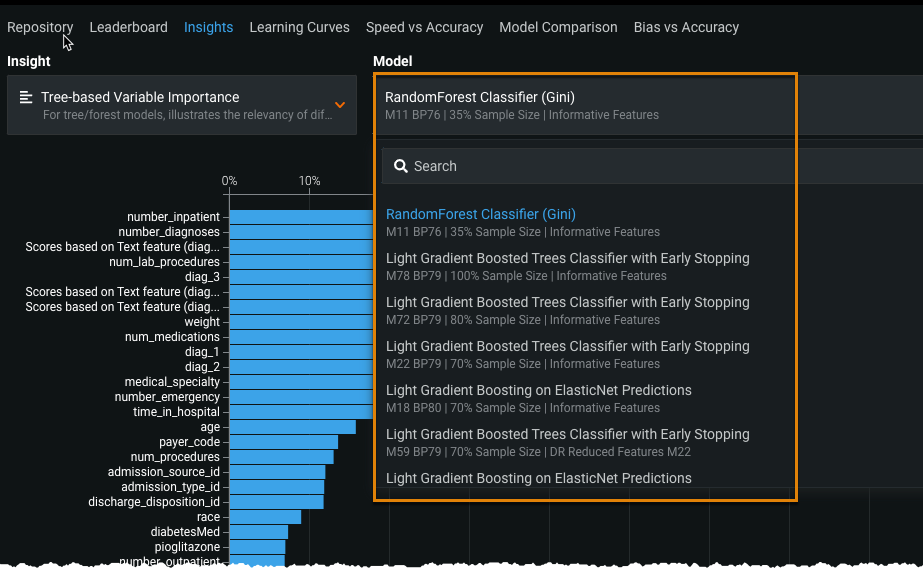
From the Model dropdown menu on the right, select from the list of models.
Note
The models listed depend on the insight selected. In the example shown, the Tree-based Variable Importance insight is selected, so the Model list contains tree and forest models.
-
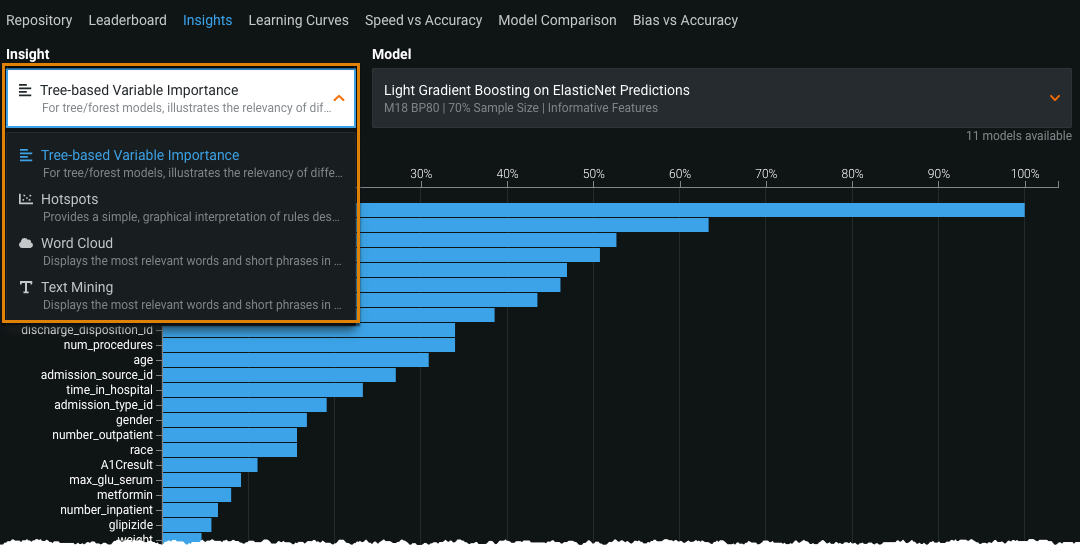
Select from other applicable insights using the Insight dropdown menu.
-
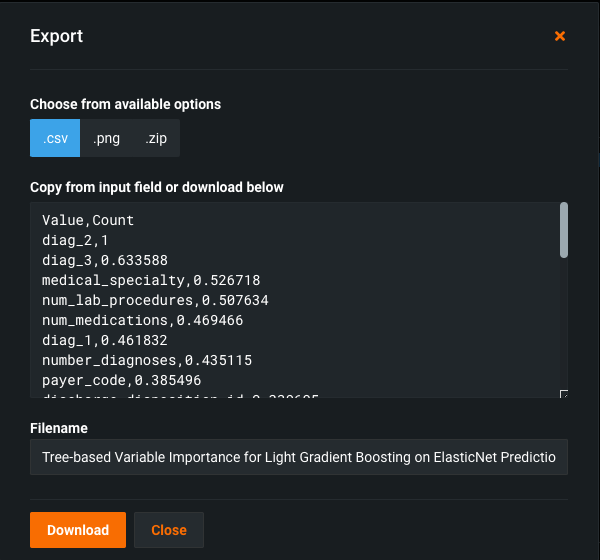
Click Export on the bottom right to download visualizations, then select the type of download (CSV, PNG, or ZIP).
See Export charts and data for more details.
Activation maps
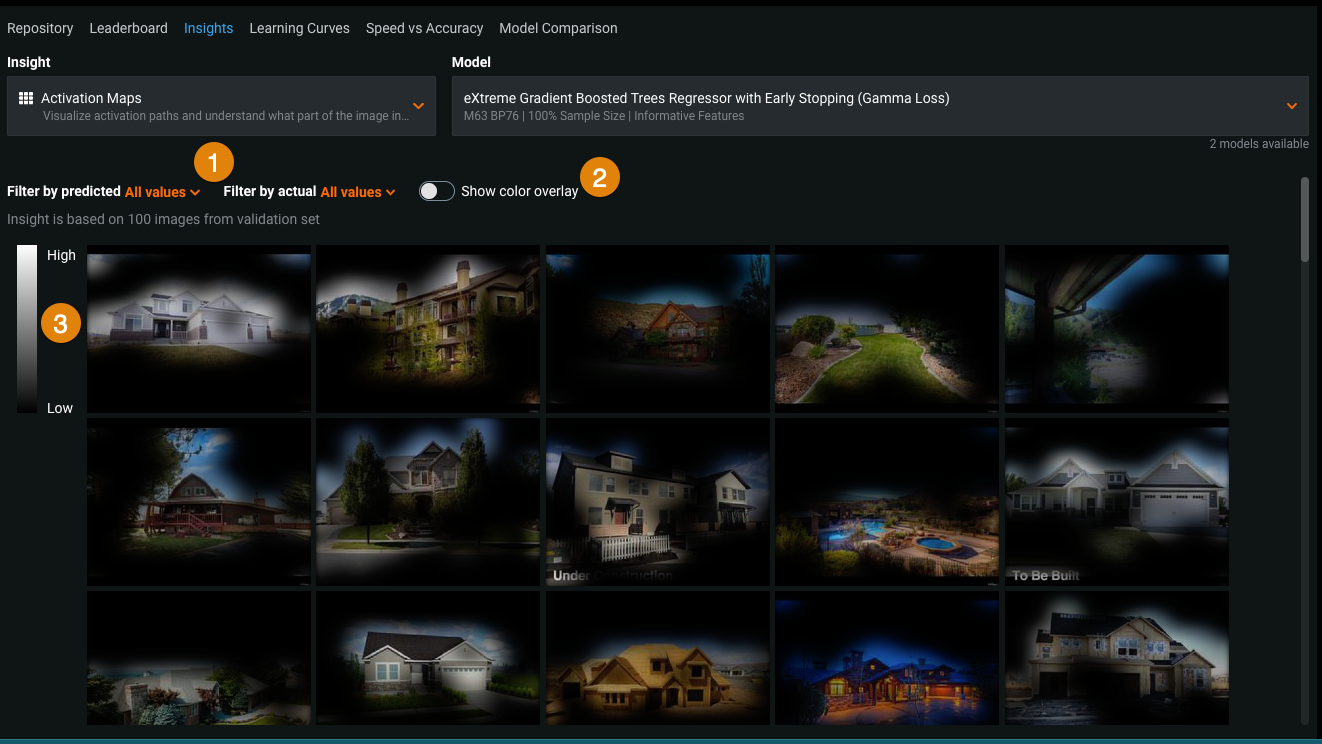
Click the Activation Maps tile on the Insights tab to see which image areas the model is using when making predictions—which parts of the images are driving the algorithm prediction decision.
An activation map can indicate whether your model is looking at the foreground or background of an image or whether it is focusing on the right areas. For example, is it looking only at “healthy” areas of a plant when there is disease and because it does not use the whole leaf, classifying it as "no disease"? Is there a problem with overfitting or target leakage? These maps help to determine whether the model would be more effective if it were tuned.
| Element | Description | |
|---|---|---|
| 1 | Filter by predicted or actual | Narrows the display based on the predicted and actual class values. See Filters for details. |
| 2 | Show color overlay | Sets whether to display the attention map in either black and white or full color. See Color overlay for details. |
| 3 | Attention scale | Shows the extent to which a region is influencing the prediction. See Attention scale for details. |
See the reference material for detailed information about Visual AI.
Filters
Filters allow you to narrow the display based on the predicted and the actual class values. The initial display shows the full sample (i.e., both filters are set to all). You can instead set the display to filter by specific classes, limiting the display. Some examples:
| "Predicted" filter | "Actual" filter | Display results |
|---|---|---|
| All | All | All (up to 100) samples from the validation set |
| Tomato Leaf Mold | All | All samples in which the predicted class was Tomato Leaf Mold |
| Tomato Leaf Mold | Tomato Leaf Mold | All samples in which both the predicted and actual class were Tomato Leaf Mold |
| Tomato Leaf Mold | Potato Blight | Any sample in which DataRobot predicted Tomato Leaf Mold but the actual class was potato blight |
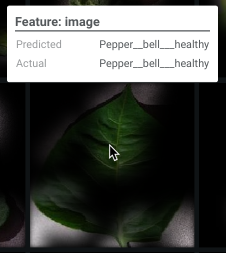
Hover over an image to see the reported predicted and actual classes for the image:
Color overlay
DataRobot provides two different views of the attention maps—black and white (which shows some transparency of original image colors) and full color. Select the option that provides the clearest contrast. For example, for black and white datasets, the alternative color overlay may make areas more obvious (instead of using a black-to-transparent scale). Toggle Show color overlay to compare.
Attention scale
The high-to-low attention scale indicates how much of a region in an image is influencing the prediction. Areas that are higher on the scale have a higher predictive influence—the model used something that was there (or not there, but should have been) to make the prediction. Some examples might include the presence or absence of yellow discoloration on a leaf, a shadow under a leaf, or an edge of a leaf that curls in a certain way.
Another way to think of scale is that it reflects how much the model "is excited by" a particular region of the image. It’s a kind of prediction explanation—why did the model predict what it did? The map shows that the reason is because the algorithm saw x in this region, which activated the filters sensitive to visual information like x.
Anomaly detection
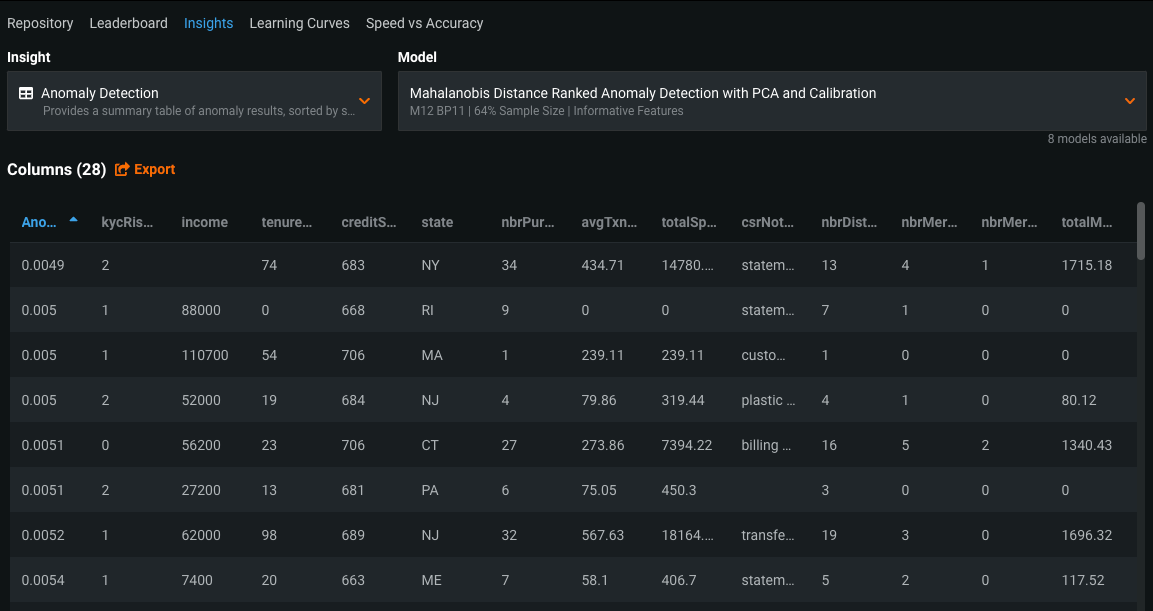
Click the Anomaly Detection tile on the Insights tab to see an anomaly score for each row, helping to identify unusual patterns that do not conform to expected behavior. The Anomaly Detection insight provides a summary table of these results sorted by score.
The display lists up to the top 100 rows from your training dataset with the highest anomaly scores, with a maximum of 1000 columns and 200 characters per column. Click the Anomaly Score column header on the top left to sort the scores from low to high. The Export button lets you download the complete listing of anomaly scores.
See also anomaly score insights and time series anomaly visualizations.
Category Cloud
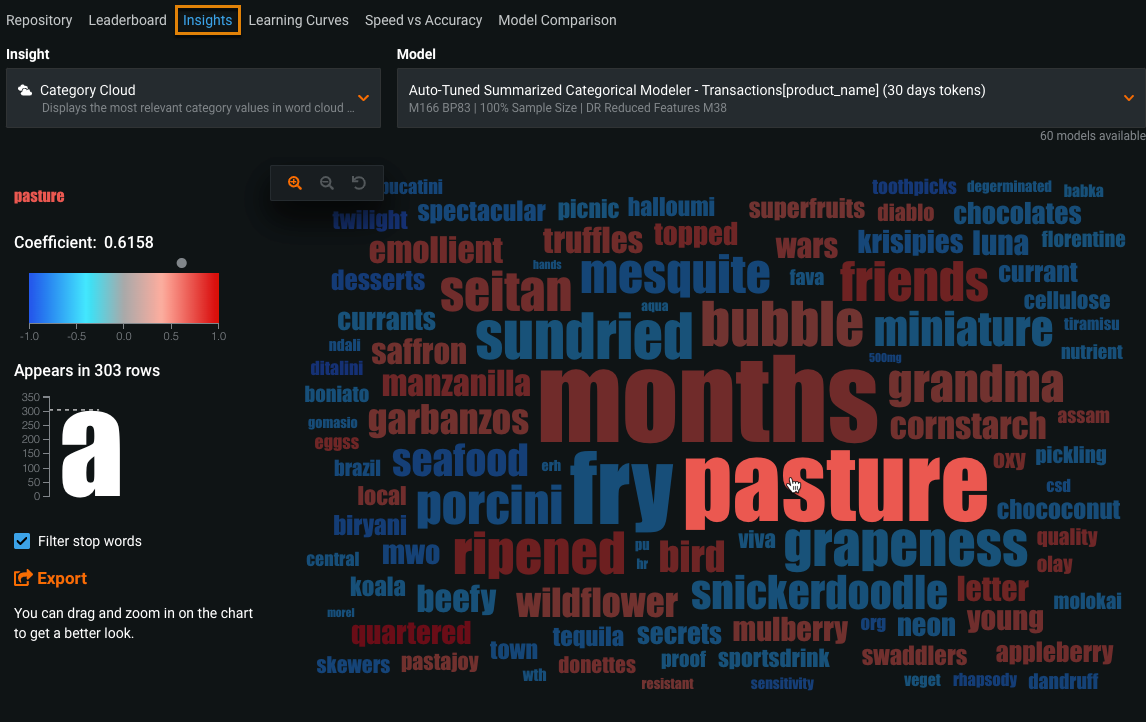
Click the Category Cloud tile on the Insights tab to investigate summarized categorical features. The Category Cloud displays as a word cloud and shows the keys most relevant to their corresponding feature.
Category Cloud availability
The Category Cloud insight is available on the Models > Insights tab and on the Data tab. On the Insights page, you can compare word clouds for a project's categorically-based models. From the Data page you can more easily compare clouds across features. Note that the Category Cloud is not created when using a multiclass target.
Keys are displayed in a color spectrum from blue to red, with blue indicating a negative effect and red indicating a positive effect. Keys that appear more frequently are displayed in a larger font size, and those that appear less frequently are displayed in smaller font sizes.
Check the Filter stop words box to remove stopwords (commonly used terms that can be excluded from searches) from the display. Removing these words can improve interpretability if the words are not informative to the Auto-Tuned Summarized Categorical Model.
Mouse over a key to display the coefficient value specific to that key and to read its full name (displayed with the information to the left of the cloud). Note that the names of keys are truncated to 20 characters when displayed in the cloud and limited to 100 characters otherwise.
Hotspots
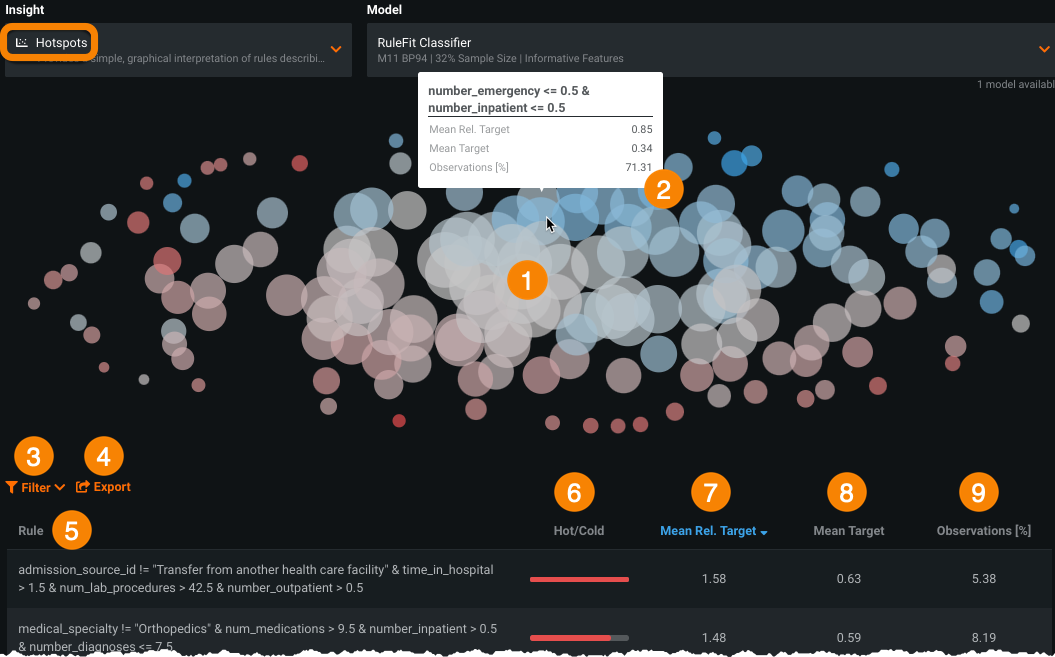
Click the Hotspots tile on the Insights tab to investigate "hot" and "cold" spots that represent simple rules with high predictive performance. These rules are good predictors for data and can easily be translated and implemented as business rules. Hotspot insights are available only when you have:
- A project with a trained RuleFit Classifier or RuleFit Regressor blueprint.
- At least one numeric or categorical column.
- Fewer than 100K rows.
The following describes elements of the insight.
| Element | Description | |
|---|---|---|
| 1 | Hotspots | DataRobot uses the rules created by the RuleFit model to produce the hotspots plot.
|
| 2 | Hotspot rule tooltip | Displays the rule corresponding to the spot. Hover over a spot to display the rule. The rule is also shown in the table below the plot. |
| 3 | Filter | Controls the display, showing only hotspots or coldspots if Hot or Cold check boxes are selected. |
| 4 | Export | Exports the hotspot table as a CSV. |
| 5 | Rule | Lists the rules created by the RuleFit model. Each rule corresponds to a hotspot. Click the header to sort the rules alphabetically. |
| 6 | Hot/Cold bar | Indicates the strength of the effect (red for a negative effect and blue for a positive effect) of the rule. Click the header to sort the rules based on the magnitude of hot/cold effects. |
| 7 | Mean Relative to Target (MRT) | Indicates the ratio of the average target value for the subgroup defined by the rule to the average target value of the overall population. High values of MRT—i.e., red dots or “hotspots”—indicate groups with higher target values, whereas low values of MRT (blue dots or “coldspots”) indicate groups with lower target values. Click the header to sort the rules based on mean relative target. |
| 8 | Mean Target | Displays the mean target value for the subgroup defined by the rule. Click the header to sort the rules based on mean target. |
| 9 | Observations[%] | Shows the percentage of observations that satisfy the rule, calculated using data from the validation partition. Click the header to sort the rules based on observation percentages. |
Example of a hotspot rule
This example describes the average of a subgroup divided by the overall average: if the average readmission rate across your dataset is 40%, but it is 80% for people with 10+ inpatient procedures, then MRT is 2.00. That does not mean that people with 10+ inpatient procedures are twice as likely to be readmitted. Instead it tells you that this rule is 2x better at capturing positive instances than just guessing at random using the overall sample mean.
Rules also exist for categorical features. They will include x <= 0.5 or x > 0.5, which represent x=0 or “No” for a given category, or x=1 or Yes, respectively.
For example, consider a dataset that looks at admitted hospital patients. The categorical feature Medical Specialty identifies the specialty of a physician that attends to a patient (cardiology, surgeon, etc.). The feature is included in the rule MEDICAL_SPECIALTY-Surgery-General <= 0.5, where the rule captures all rows in the dataset where the medical specialty of the attending physician is not “Surgery General”.
Image Embeddings
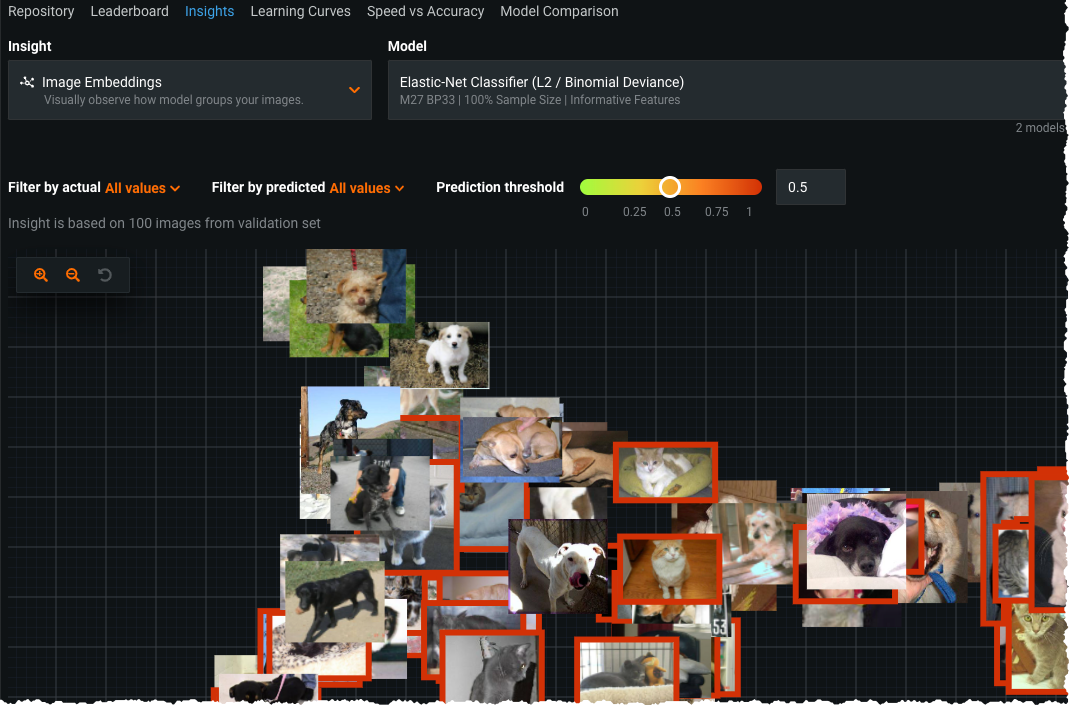
Click the Image Embeddings tile on the Insights tab to view up to 100 images from the validation set projected onto a two-dimensional plane (using a technique that preserves similarity among images). This visualization answers the questions: What does the featurizer consider to be similar? Does this match human intuition? Is the featurizer missing something obvious?
See the full description of the Image Embeddings insight in the section on Visual AI model insights.
Text-based insights
Text variables often contain words that are highly indicative of the response. To help assess variable keyword relevancy, DataRobot provides the following text-based insights:
Text-based insight availability
If you expect to see one of these text insights and do not, view the Log tab for error messages to help understand why the models may be missing.
One common reason that text models are not built is because DataRobot removes single-character "words" when model building. It does this because the words are typically uninformative (e.g., "a" or "I"). A side-effect of this removal is that single-digit numbers are also removed. In other words, DataRobot removes "1" or "2" or "a" or "I". This common practice in text mining (for example, the Sklearn Tfidf Vectorizer selects tokens of 2 or more alphanumeric characters).
This can be an issue if you have encoded words as numbers (which some organizations do to anonymize data). For example, if you use "1 2 3" instead of "john jacob schmidt" and "1 4 3" instead of "john jingleheimer schmidt," DataRobot removes the single digits; the texts become "" and "". DataRobot returns an error if it cannot find any words for features of type text (because they are all single digits).
If you need a workaround to avoid the error, here are two solutions:
- Start numbering at 10 (e.g., "11 12 13" and "11 14 13")
- Add a single letter to each ID (e.g., "x1 x2 x3" and "x1 x4 x3").
Text Mining
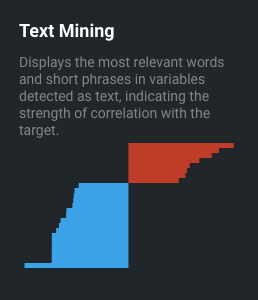
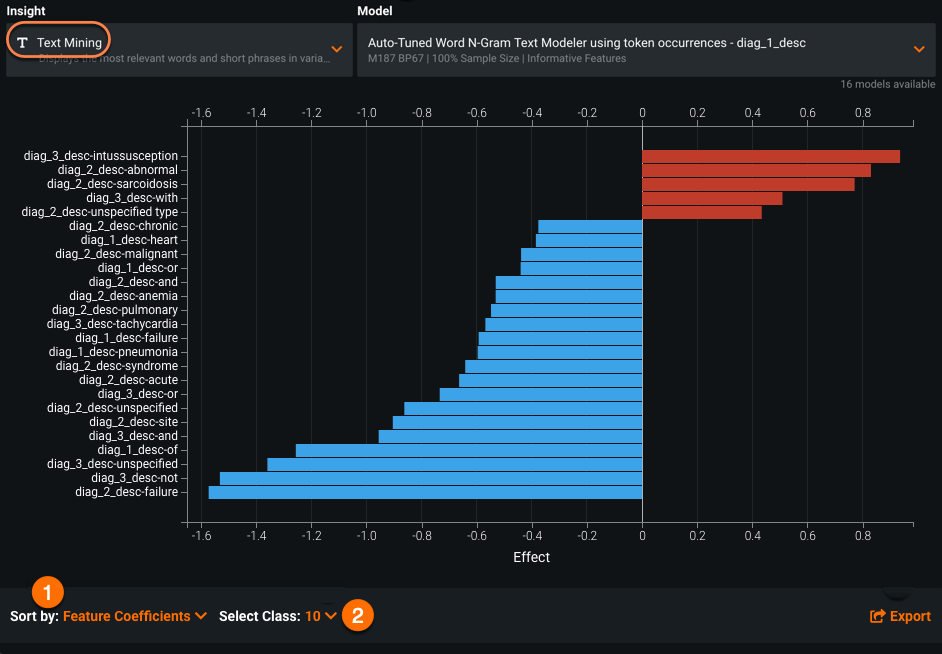
The Text Mining chart displays the most relevant words and short phrases in any variables detected as text. Text strings with a positive effect display in red and those with a negative effect display in blue.
| Element | Description | |
|---|---|---|
| 1 | Sort by | Lets you sort values by impact (Feature Coefficients) or alphabetically (Feature Name). |
| 2 | Select Class | For multiclass projects, use the Select Class dropdown to choose a specific class for the text mining insights. |
The most important words and phrases are shown in the text mining chart, ranked by their coefficient value (which indicates how strongly the word or phrase is correlated with the target). This ranking enables you to compare the strength of the presence of these words and phrases. The side-by-side comparison allows you to see how individual words can be used in numerous —and sometimes counterintuitive—ways, with many different implications for the response.
Word Cloud
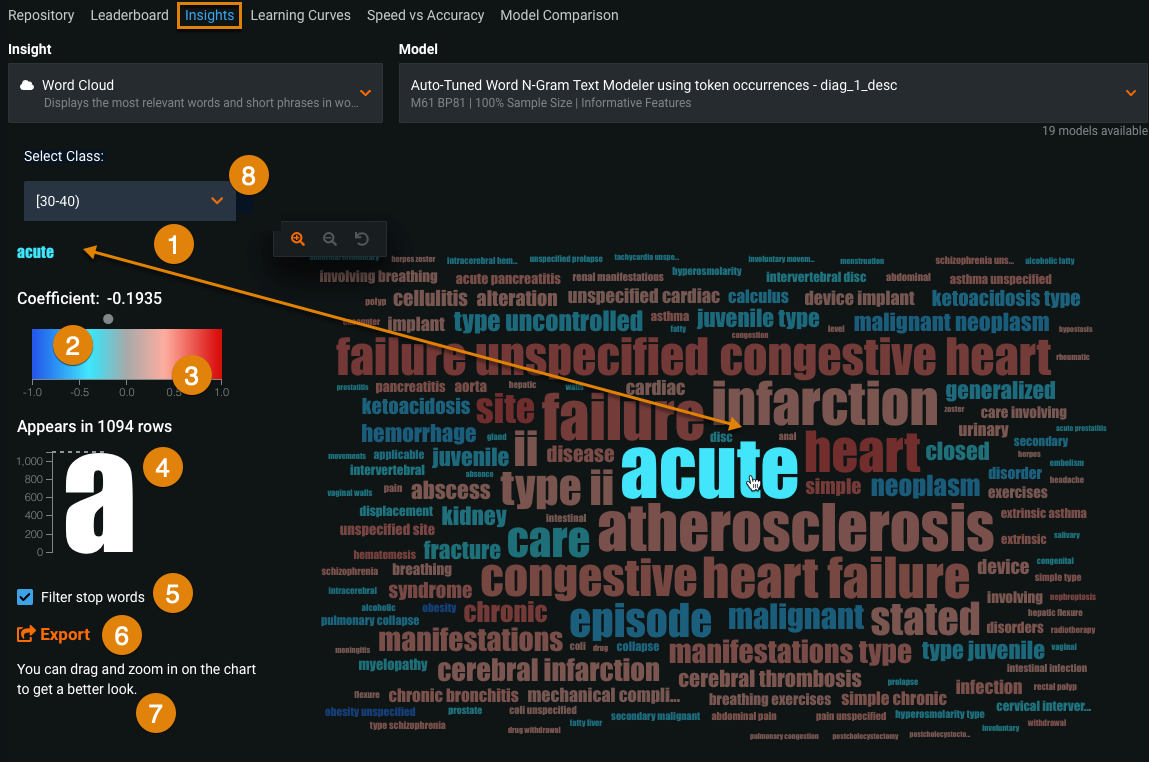
The Word Cloud insight displays up to the 200 most impactful words and short phrases in word cloud format.
| Element | Description | |
|---|---|---|
| 1 | Selected word | Displays details about the selected word. (The term word here equates to an n-gram, which can be a sequence of words.) Mouse over a word to select it. Words that appear more frequently display in a larger font size in the Word Cloud, and those that appear less frequently display in smaller font sizes. |
| 2 | Coefficient | Displays the coefficient value specific to the word. |
| 3 | Color spectrum | Displays a legend for the color spectrum and values for words, from blue to red, with blue indicating a negative effect and red indicating a positive effect. |
| 4 | Appears in # rows | Specifies the number of rows the word appears in. |
| 5 | Filter stop words | Removes stop words (commonly used terms that can be excluded from searches) from the display. |
| 6 | Export | Allows you to export the Word Cloud. |
| 7 | Zoom controls | Enlarges or reduces the image displayed on the canvas. Alternatively, double-click on the image. To move areas of the display into focus, click and drag. |
| 8 | Select class | For multiclass projects, selects the class to investigate using the Word Cloud. |
Word Cloud availability
You can access Word Cloud from either the Insights page or the Leaderboard. Operationally, each version of the model behaves the same—use the Leaderboard tab to view a Word Cloud while investigating an individual model and the Insights page to access, and compare, each Word Cloud for a project. Additionally, they are available for multimodal datasets (i.e., datasets that mix images, text, categorical, etc.)—a Word Cloud is displayed for all text from the data.
The Word Cloud visualization is supported in the following model types and blueprints:
-
Binary classification:
- All variants of ElasticNet Classifier (linear family models) with the exception of TinyBERT ElasticNet classifier and FastText ElasticNet classifier
- LightGBM on ElasticNet Predictions
- Text fit on Residuals
- Extended support for multimodal datasets (with single Auto-Tuned N-gram)
-
Multiclass:
- Stochastic Gradient Descent with at least 1 text column with the exception of TinyBERT SGD classifier and FastText SGD classifier
-
Regression:
- Ridge Regressor
- ElasticNet Regressor
- Lasso Regressor
- Single Auto-Tuned Multi-Modal
- LightGBM on ElasticNet Predictions
- Text fit on Residuals
Note
The Word Cloud for a model is based on the data used to train that model, not on the entire dataset. For example, a model trained on a 32% sample size will result in a Word Cloud that reflects those same 32% of rows.
See Text-based insights for a description of how DataRobot handles single-character words.
Tree-based Variable Importance
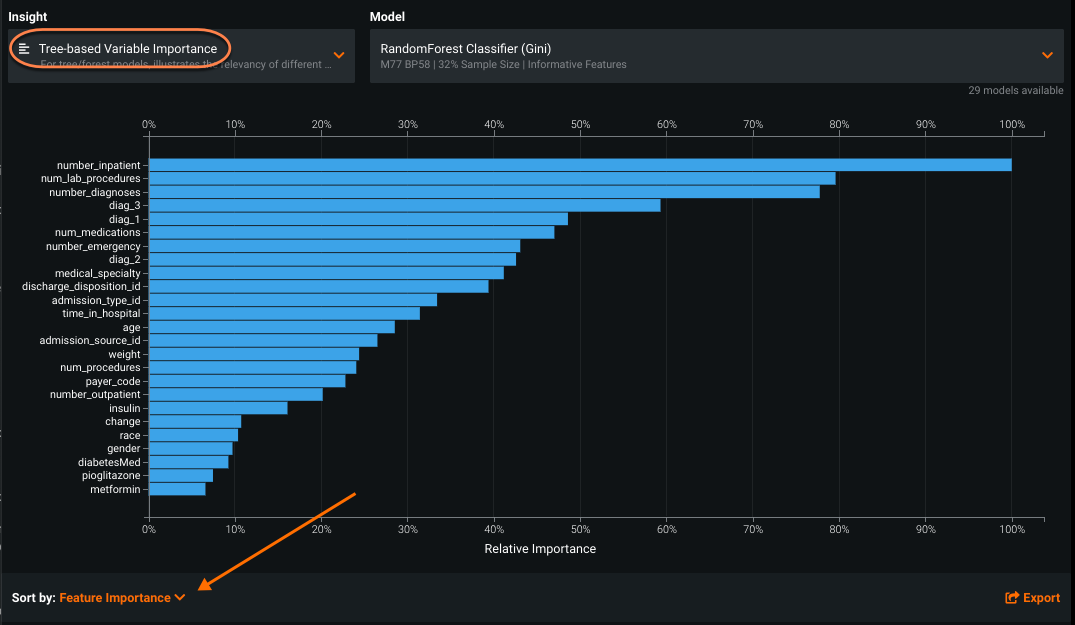
The Tree-Based Variable Importance insight shows the sorted relative importance of all key variables driving a specific model.
This view accumulates all the Importance charts for models in the project to make it easier to compare these charts across models. Change the Sort by dropdown to list features by ranked importance or alphabetically (2).
Tree-based Variable Importance availability
The chart is only available for tree/forest models (for example, Gradient Boosted Trees Classifier or Random Forest).
The chart shows the relative importance of all key features making up the model. The importance of each feature is calculated relative to the most important feature for predicting the target. To calculate, DataRobot sets the relative importance of the most important feature to 100%, and all other features are a percentage relative to the top feature.
Consider the following when interpreting the chart:
-
Sometimes relative importance can be very useful, especially when a particular feature appears to be significantly more important for predictions than all other features. It is usually worth checking if the values of this very important variable do not depend on the response. If it is the case, you may want to exclude this feature in training the model. Not all models have a Coefficients chart, and the Importance graph is the only way to visualize the feature impact to the model.
-
If a feature is included in only one model out of the dozens that DataRobot builds, it may not be that important. Excluding it from the feature set can optimize model building and future predictions.
-
It is useful to compare how feature importance changes for the same model with different feature lists. Sometimes the features recognized as important on a reduced dataset differ substantially from the features recognized on the full feature set.
Variable Effects
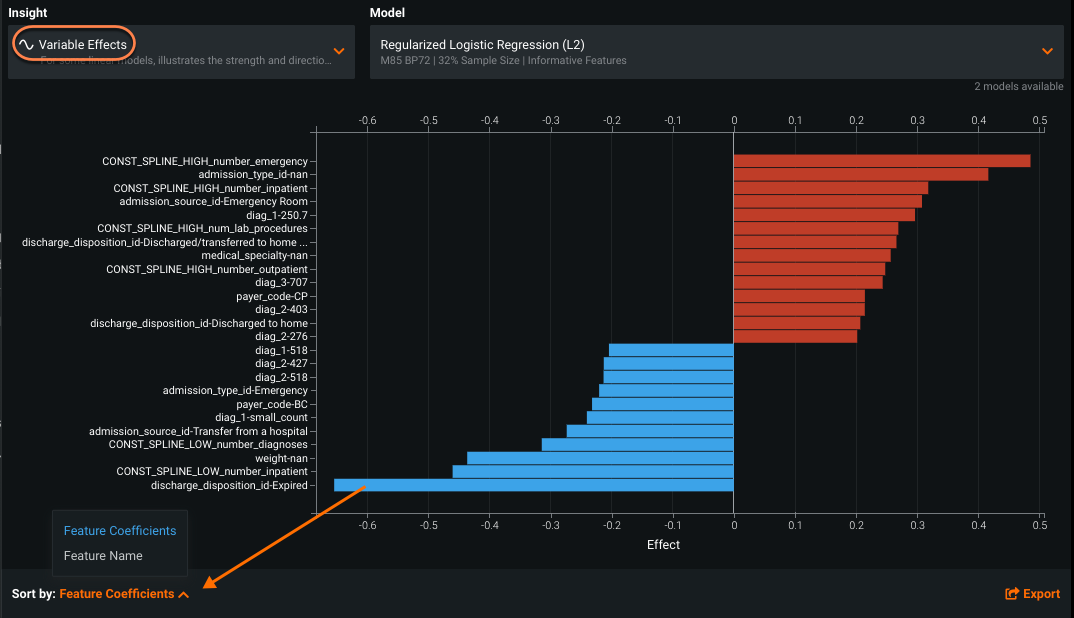
While Tree-Based Variable Importance tells you the relevancy of different variables to the model, the Variable Effects chart shows the impact of each variable in the prediction outcome.
Use this chart to compare the impact of a feature for different Constant Spline models. It is useful to ensure that the relative rank of feature importance across models does not vary wildly. If in one model a feature is regarded to be very important with positive effect and in another with negative, it is worth double-checking both the dataset and the model.
With Variable Effects, you can:
- Click Variable Effects to display the relative rank of features.
- Use the Sort by dropdown to sort values by impact (Feature Coefficients) or alphabetically (Feature Name).
Variable Effects availability
Variable Effects are only available for full Autopilot models built using Constant Splines during preprocessing. To see the impact of each variable in the prediction outcomes for other model types, use the Coefficients tab.
