ROC curve
The ROC curve visualization (on the ROC Curve tab) helps you explore classification, performance, and statistics for a selected model. ROC curves plot the true positive rate against the false positive rate for a given data source.
Evaluate a model using the ROC curve
-
Select a model on the Leaderboard and navigate to Evaluate > ROC Curve.
-
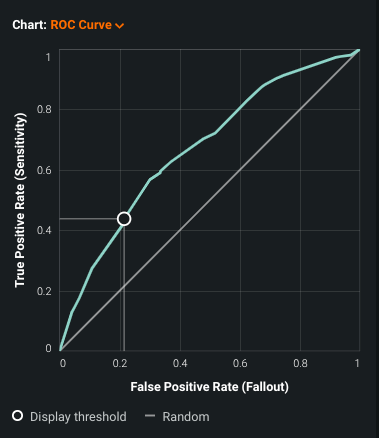
Select a data source and set the display threshold. The ROC curve displays in the center of the ROC Curve tab.
The curve is highlighted with the following elements:
- Circle—Indicates the new threshold value. Each time you set a new display threshold, the position of the circle on the curve changes.
- Gray intercepts—Provides a visual reference for the selected threshold.
- 45 degree diagonal—Represents the "random" prediction model.
Analyze the ROC curve
View the ROC curve and consider the following:
ROC curve shape
Use the ROC curve to assess model quality. The curve, drawn based on each value in the dataset, plots the true positive rate against the false positive rate. Some takeaways from an ROC curve:
-
An ideal curve grows quickly for small x-values, and slows for values of x closer to 1.
-
The curve illustrates the tradeoff between sensitivity and specificity. An increase in sensitivity results in a decrease in specificity.
-
A "perfect" ROC curve yields a point in the top left corner of the chart (coordinate (0,1)), indicating no false negatives and no false positives (a high true positive rate and a low false positive rate).
-
The closer the curve comes to the 45-degree diagonal of the ROC space, the less accurate the model and closer it is to a random assignment model.
-
The shape of the curve is determined by the overlap of the classification distributions.
Area under the ROC curve
The AUC (area under the curve) is literally the lower-right area under the ROC Curve.
Note
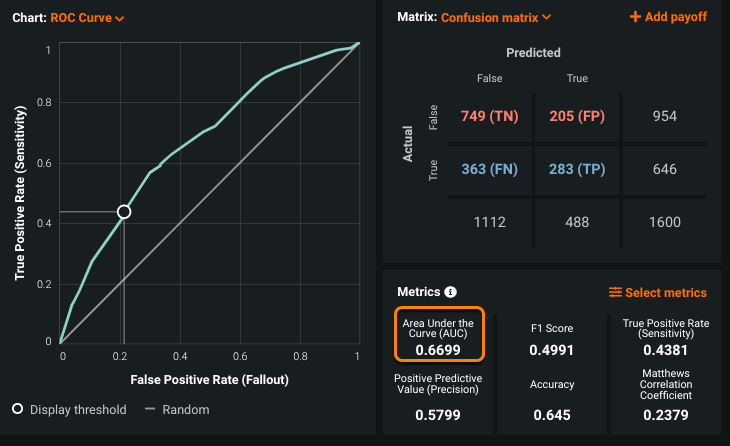
AUC does not display automatically in the Metrics pane. Click Select metrics and select Area Under the Curve (AUC) to display it.
AUC is a metric for binary classification that considers all possible thresholds and summarizes performance in a single value, reported in the bottom right of the graph. The larger the area under the curve, the more accurate the model, however:
-
An AUC of 0.5 suggests that predictions based on this model are no better than a random guess.
-
An AUC of 1.0 suggests that predictions based on this model are perfect, and because a perfect model is highly uncommon, it is likely flawed (target leakage is a common cause of this result).
StackExchange provides an excellent explanation of AUC.
Kolmogorov-Smirnov (KS) metric
For binary classification projects, the KS optimization metric measures the maximum distance between two non-parametric distributions.
The KS metric evaluates and ranks models based on the degree of separation between true positive and false positive distributions.
Note
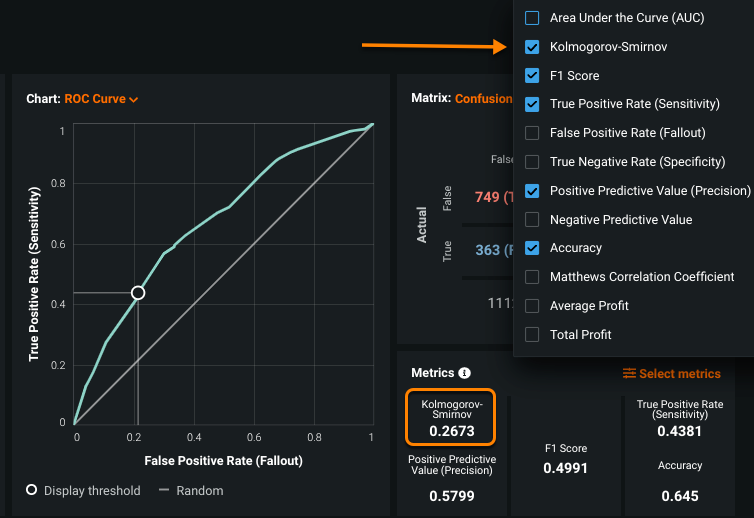
The KS metric does not display automatically in the Metrics pane. Click Select metrics and select Kolmogorov-Smirnov Score to display it.
For a complete description of the Kolmogorov–Smirnov test (K–S test or KS test), see the Wikipedia article on the topic.


