Forecast vs Actual
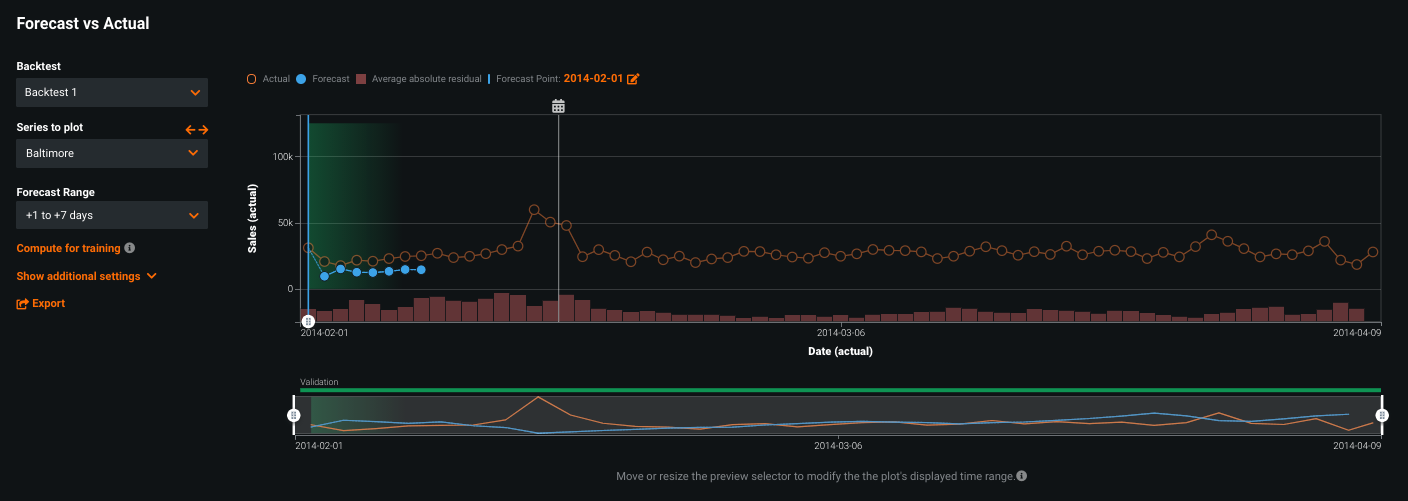
Time series forecasting predicts multiple values for each point in time (forecast distances). While the Accuracy Over Time chart displays a single forecast at a time, you can use the Forecast vs Actual chart to show multiple forecast distances in one view. For example, imagine forecasting the weather. Your forecast point might be today, and you can forecast out a day, or maybe a week. Predicting tomorrow’s weather from today will have a very different accuracy than predicting the weather a week from today. Those spans are called forecast “distances”.
Forecast vs Actual allows you to compare how different predictions behave from different forecast points to different times in the future. Use the chart to help answer what, for your needs, is the best distance to predict. Forecasting out only one day may provide the best results, but it may not be the most actionable for your business. Forecasting the next three days out, however, may provide relatively good accuracy and give your business time to react to the information provided. If your project included calendar data, those events are displayed on this chart, helping you to gain insight into the effects of those events.
The Forecast vs Actual chart is not available for OTV or unsupervised projects.
Chart display options
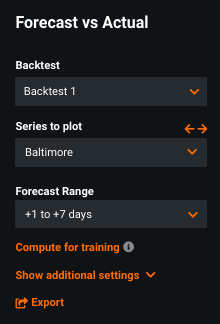
The Forecast vs Actual chart has many similarities to the Accuracy Over Time chart in its display controls. Other than the Forecast Range control (Forecast Distance in Accuracy Over Time) the following work the same.
See the Accuracy Over Time documentation for descriptions of:
- Backtest
- Series to plot (multiseries only), including use of the bulk calculation feature.
- Compute for training
Under additional settings:
Note
Because multiseries projects can have up to 1 million series and up to 1000 forecast distances, calculating accuracy charts for all series data can be extremely compute-intensive and often unnecessary. To avoid this, DataRobot provides alternative calculation options.
As with other time series visualizations, drag the handles on the preview panel to bring specific areas into focus on the main chart.
Forecast range
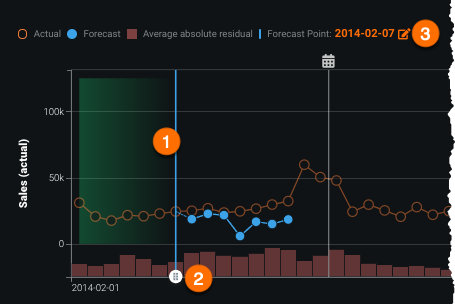
Where Accuracy Over Time allows you to set a single forecast distance—one day from now, four days from now—use Forecast vs Actual to plot a range of distances (for example, one to seven days from now). There are three ways to set the start point for the range.
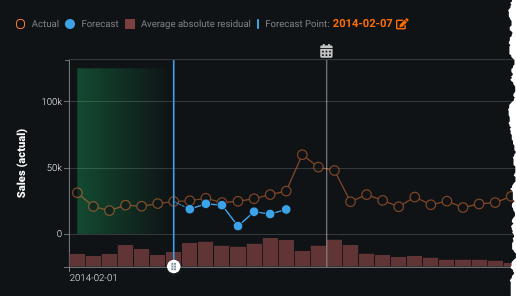
The start point is marked by a blue bar in the chart. If the Forecast Range is set to +1 to +7 days, for example, the chart will display forecasts for days 1, 2, 3...7 from the blue bar. When you change the date using one of the mechanisms, the change is reflected in the others.
- Click anywhere in the chart to set that date as the start point (1).
- Drag the handle to the start point (2).
- Use the calendar picker to set a date (3).
Note
If you change the Forecast range to represent a single value, and that step is equivalent to the Forecast distance in Accuracy Over Time, the chart is available without further calculations.
Interpret the insight
Forecast vs Actual helps to visualize how predictions change over time in the context of a forecast range. The open orange circle represents actual values from your data. Solid blue circles represent predicted values on dates contained within the forecast range. If you used a calendar file when you created the project, the display also includes markers to indicate calendar events.
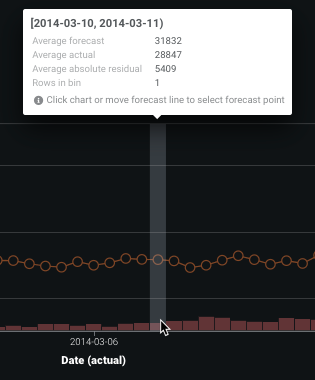
Hover on any point in the chart for a tooltip listing information of the values for that bin. Information is available for all calculated points, regardless of whether or not they are included in the currently selected forecast distance:
The tooltip reports the average absolute residual value. This value is also represented in bar chart form at the bottom of the main chart:
Residuals measure the difference between actual and predicted values. They help to visualize whether there is an unexplained trend in your data that the model did not account for and how the model errors change over time.
How are absolute residual values calculated?
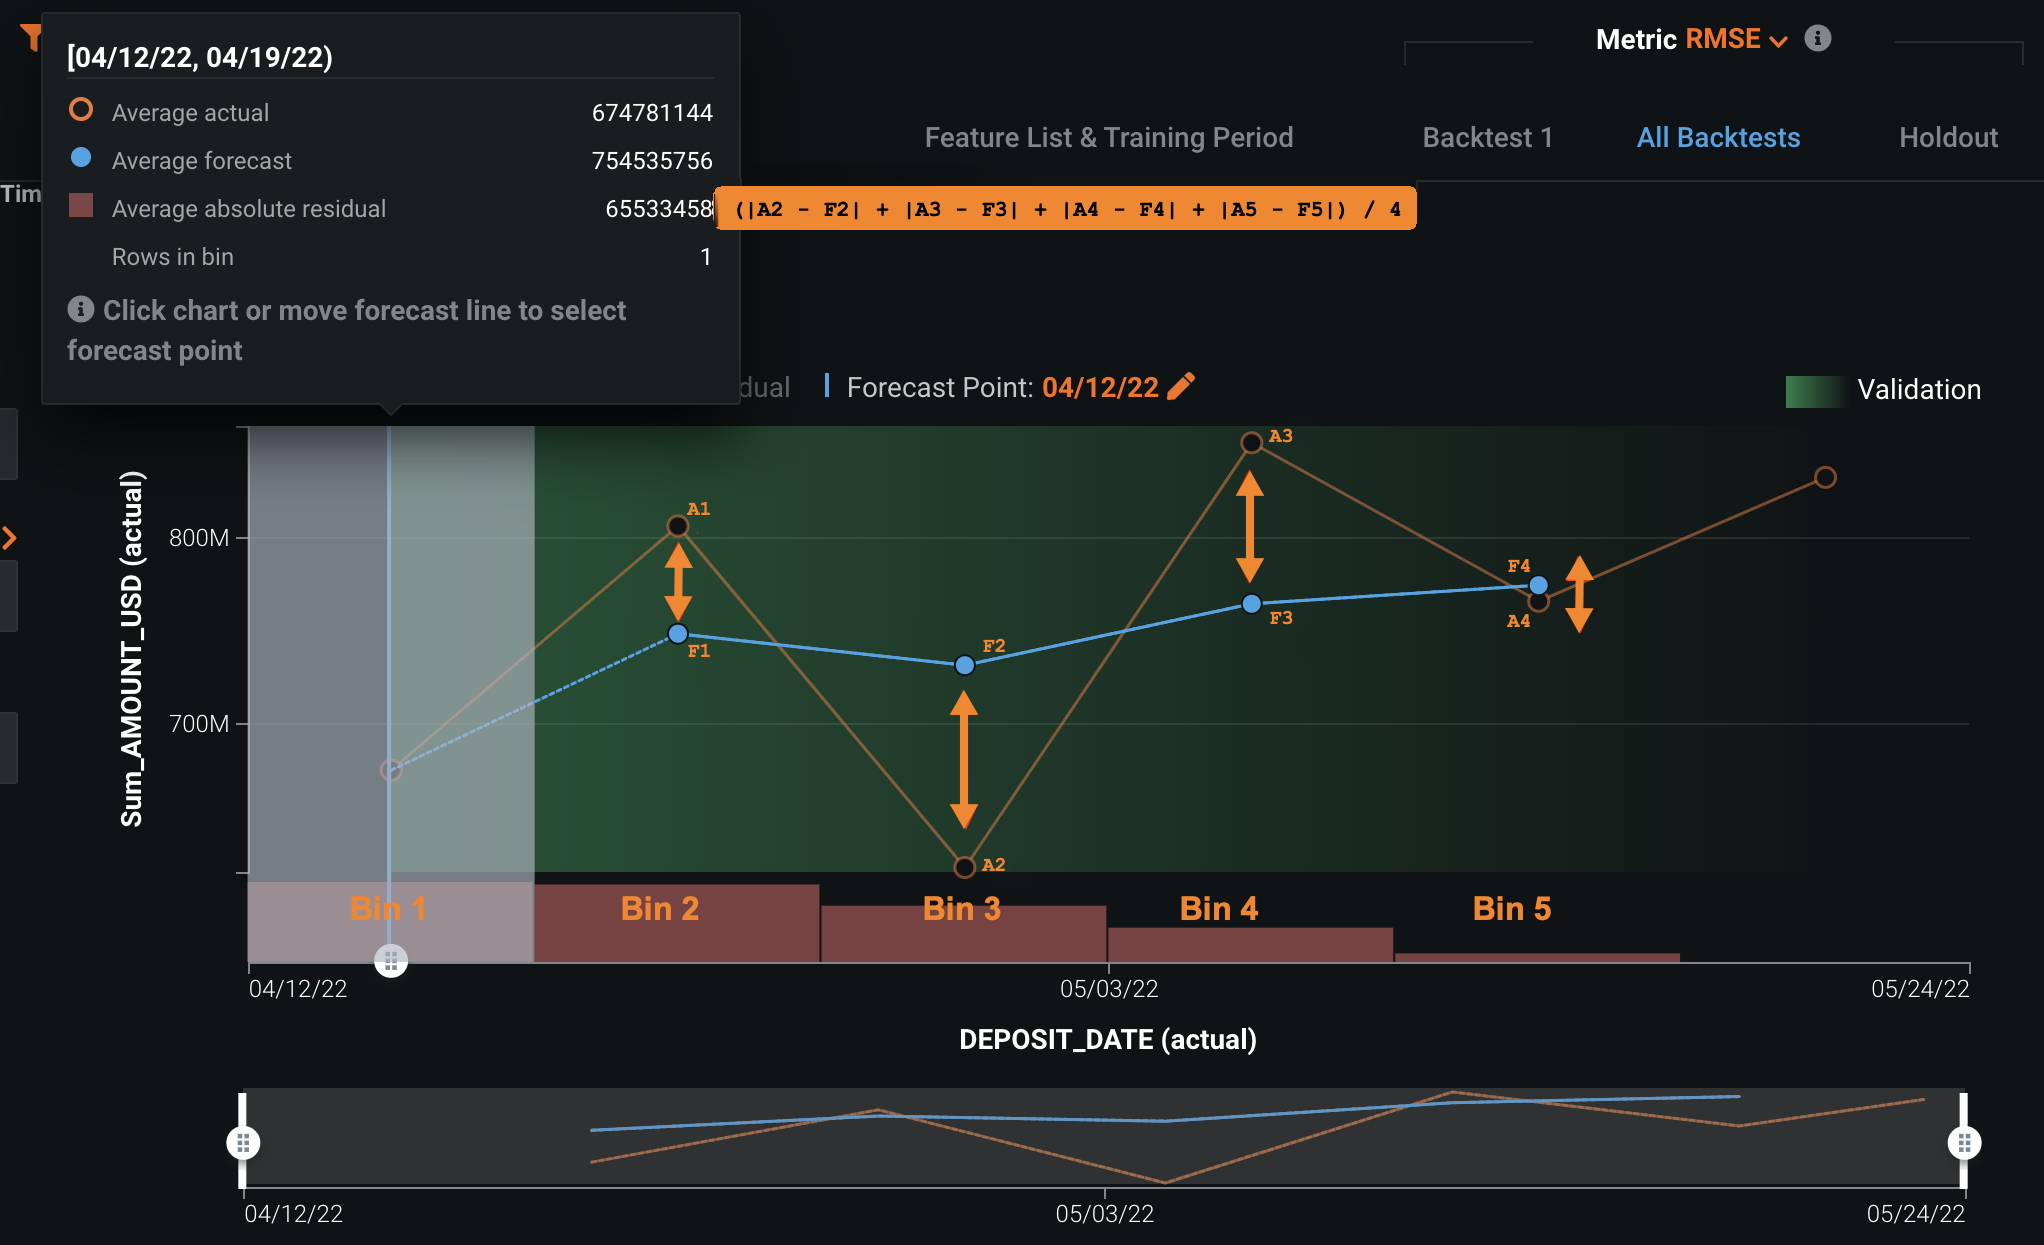
The average absolute residual value represents the "error" between the actual and forecasted results. To calculate, DataRobot takes the average value of the absolute difference between actuals and forecast shown in the subsequent bins:
For example, in the image above, values are calculated as:
- First bin error:
(|A2 - F2| + |A3 - F3| + |A4 - F4| + |A5 - F5|) / 4 - Second bin error :
(|A3 - F3|| + |A4 - F4| + |A5 - F5|) / 3 - Third bin error:
(|A4 - F4| + |A5 - F5|) / 2 - The fourth bin error:
|A5 - F5|
The last bin does not have an error because there are no subsequent bins.
