Custom charts
The Chart pane in the ROC Curve tab allows you to create your own charts to explore classification, performance, and statistics related to a selected model.
Create a custom chart
Create a custom chart by selecting values for the X- and Y- axes:
-
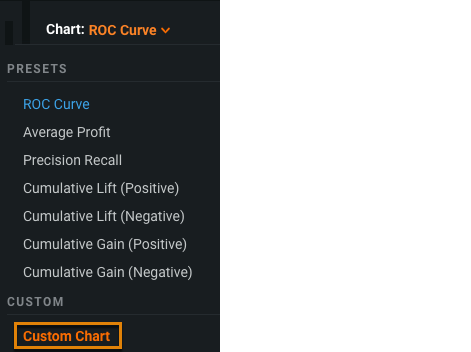
In the Chart pane, select Custom Chart.
-
In the X-Axis dropdown list, select the value to display on the X-Axis. Do the same for the Y-Axis and click Apply.
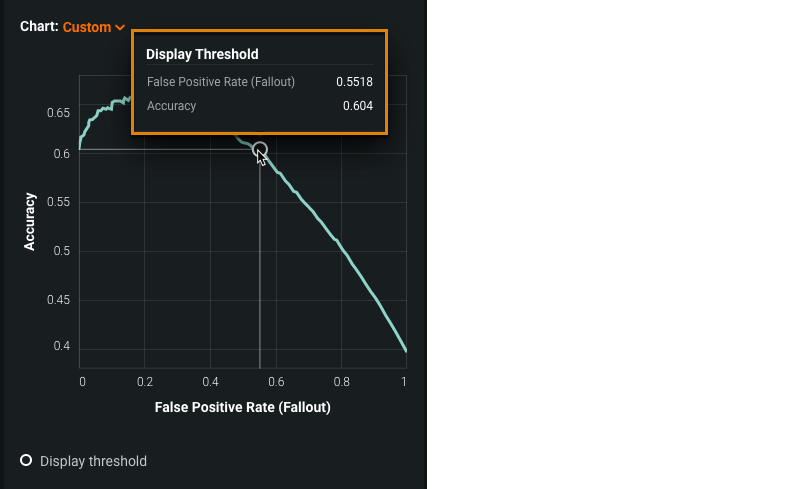
The custom chart displays in the Chart pane.
Hover over the circle on the graph to see the values at the display threshold.
Data available for custom charts
Click below to view the data available for custom charts.
- False Positive Rate (Fallout)
- True Positive Rate (Sensitivity)
- True Negative Rate (Specificity)
- Fraction Predicted as Positive
- Fraction Predicted as Negative
- Threshold (Probability)
- False Positive Rate (Fallout)
- True Positive Rate (Sensitivity)
- True Negative Rate (Specificity)
- Cumulative List (Positive)
- Cumulative List (Negative)
- Fraction Predicted as Positive
- Fraction Predicted as Negative
- Profit (Overall)
- Profit (Average)
- Threshold (Probability)
- F1 Score
- Negative Predictive Value
- Positive Predictive Value
Accuracy - Matthews Correlation Coefficient


