Humility tab
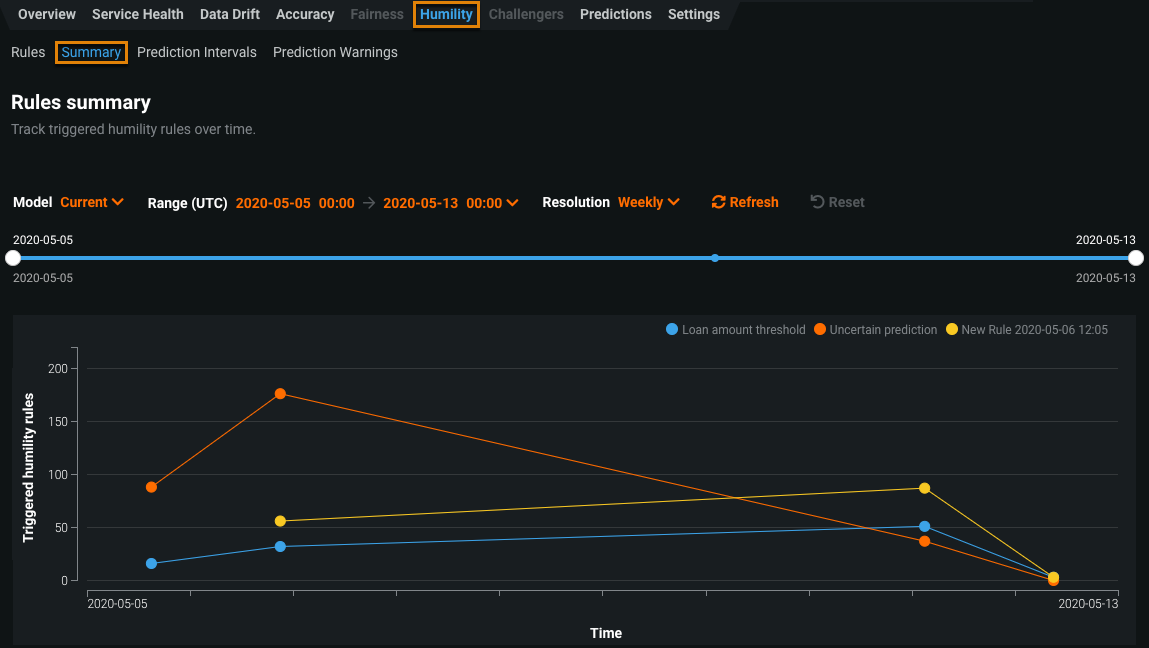
After configuring humility rules and making predictions with humility monitoring enabled, you can view the humility data collected over time for a deployment from the Humility > Summary tab.
The X-axis measures the range of time that predictions have been made for the deployment. The Y-axis measures the number of times humility rules have triggered for the given period of time.
The controls—model version and data time range selectors—work the same as those available on the Data Drift tab.
