Profit curve
Like the other visualization tools on the ROC Curve tab, profit curves are available for binary classification problems.
Profit curves help you estimate the business impact of a selected model. For many classification problems, there is asymmetry between the benefit of correct predictions and/or the penalty (or cost) of incorrect predictions. The average profit chart helps you assess a model based on your supplied costs or benefits so that you can see how those profits change with different inputs.
Generate a profit curve
To generate a profit curve, first create a payoff matrix using:
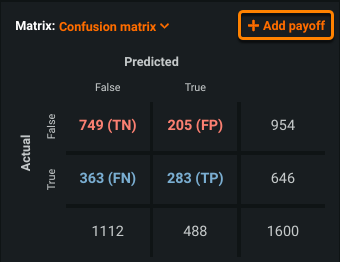
- A confusion matrix that reports how actual versus predicted values were classified.
- Payoff values—a set of values that represent business impact (free of currency). For example, "if I identify who will default on a loan, what will the cost or benefit be for each observation for both correct and incorrect predictions?"
Deep dive: Profit curve
The metrics that DataRobot reports are good for understanding both the absolute and relative performance of models in a machine learning context, and are generalizable for many different contexts. For example, it is not immediately apparent how much money you may gain or lose from deploying a model by looking only at the ROC curve (see a further comparison below). With the profit curve, even using average payoff values, you can make a quick evaluation of a model's direct application in your business setting. Specifically, the curve can help you understand where to set your classification threshold and how much you stand to gain based on average costs/benefits associated with correct classification or misclassification.
There are two main interactive components needed to set up a profit curve:
- A payoff matrix configuration that determines the profit calculation used to update the profit curve
- The profit curve visualization
Together, the matrix and payoff values create the average profit chart. Creating matrices with different matrix values allows you to compare different cost scenarios, for example, an optimistic and pessimistic cost.
To generate a profit curve:
-
Select a model on the Leaderboard and navigate to Evaluate > ROC Curve.
-
Select a data source and set the display threshold.
-
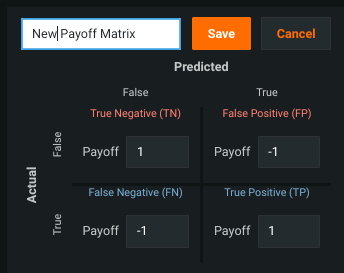
In the Matrix pane on the right, create a payoff matrix by clicking + Add payoff.
-
Enter the name of the payoff matrix.
Before you create the payoff matrix, the displayed payoff values are
1for correct classifications and-1for incorrect classifications—this is not really a matrix, but instead a "placeholder" set of values to provide an initial curve visualization. -
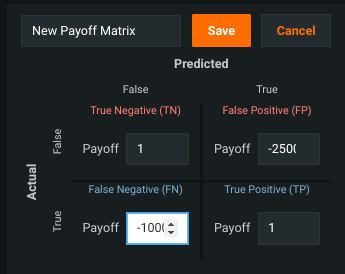
Enter payoff values for each category (TN, FP, FN, and TP).
The payoff values determine the profit calculation that generates the profit curve.
-
Click Save.
Tip
The new payoff matrix becomes available to all models in the project. You can edit or delete the matrix as needed; these changes are also reflected across the project. You can create up to six matrices.
-
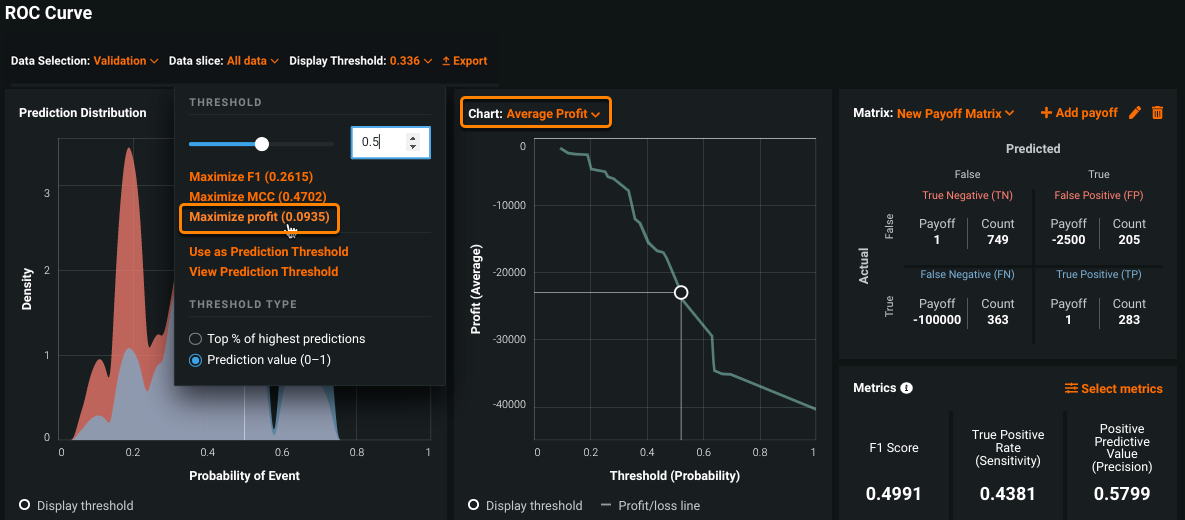
Set the Chart pane to Average Profit and for Display Threshold, select Maximize profit.
This is the maximum profit that can be achieved using the selected payoff matrix.
-
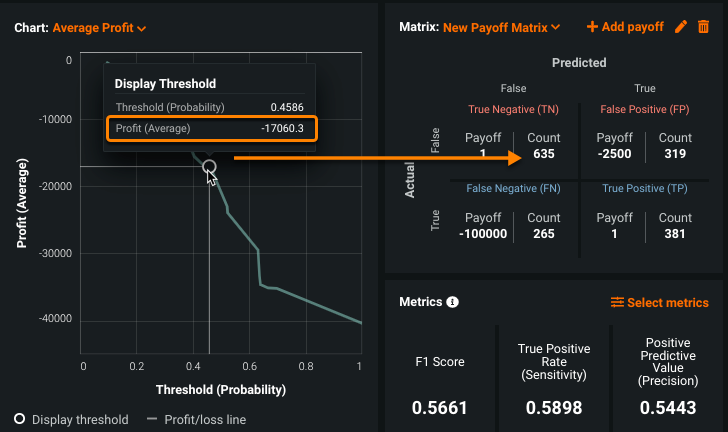
Click the circle on the profit curve to see the average profit at that threshold. Click other areas along the curve to see how the average profit changes. Take a look at the payoff matrix to see how the TN, FP, FN, and TP counts change based on the display threshold.
The total profit (or loss) is calculated based on the matrix settings and reflected in the curve. In other words, the total profit/loss is the sum of the correct and incorrect classifications multiplied by the benefit or loss from each.
View the average profit metric
To view the average profit metric:
-
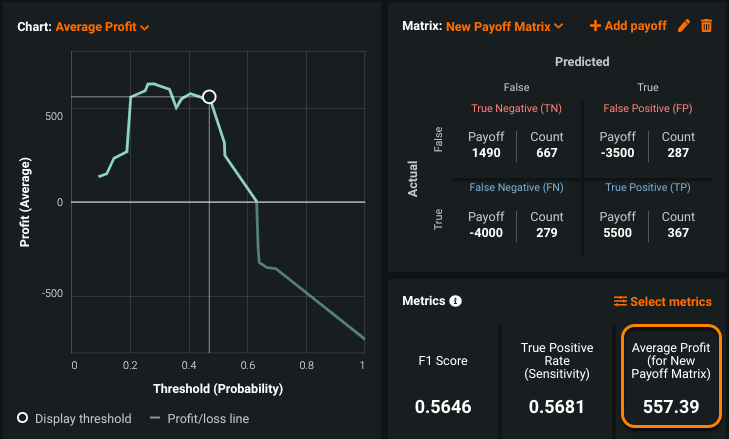
Click Select metrics and choose Average Profit (for Payoff Matrix).
-
View the average profit in the Metrics pane:
Profit curve explained
The average profit curve plots the average profit against the classification threshold. The average profit curve visualization is based on two inputs:
-
The confusion matrix, which categorizes correct and incorrect predictions, and the display threshold.
-
The payoff matrix, which assigns costs and benefits to the different types of correct and incorrect predictions (true positives/true negatives and false positives/false negatives).
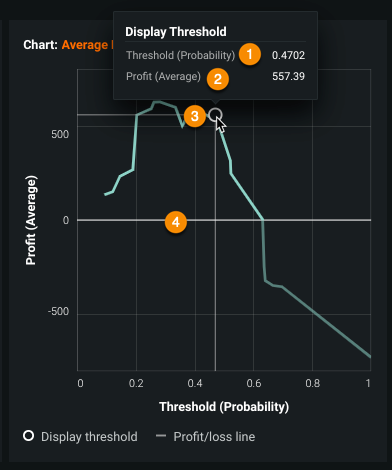
Consider the following average profit curve:
The following table describes elements of the display:
| Element | Description | |
|---|---|---|
| 1 | Threshold (Probability) | The focus of the display, which plots profit against the classification point of positive versus negative. This is the point used as the basis for counts in the payoff matrix. You can set the prediction threshold to this display value. |
| 2 | Profit (Average) | Determined at each threshold from the sum of the product of each pair of confusion matrix and payoff matrix elements (with formulas described below). DataRobot generates the profit/loss based off the "right and wrong" numbers combined with configured payoff values. |
| 3 | Display threshold | Circle that denotes the threshold on the profit curve. You can set the display threshold to the maximum profit by selecting Maximize profit in the Display Threshold pulldown above the Prediction Distribution graph. |
| 4 | Profit/loss line | A line that always orients to 0 to help visualize the break even point. It indicates where values are positive versus negative based on the selected data partition. |
Compare models based on a payoff matrix
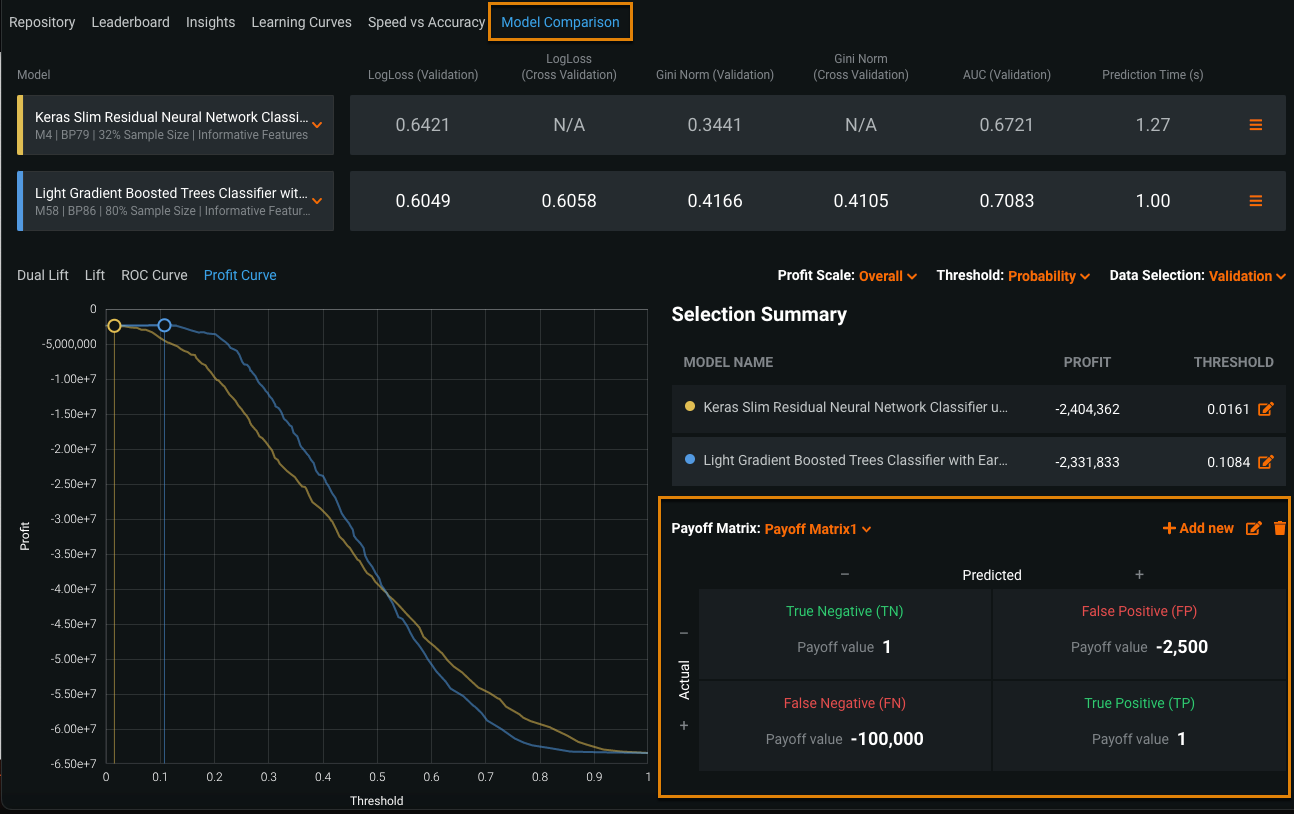
Use the Model Comparison tab to compare how two different models handle the data. Results are based on the payoff matrix, so you must have created at least one matrix before using the comparison. Some information to evaluate in the comparison include:
- How different is the shape between the two models?
- Is there a large difference in the max profit?
- Where do the thresholds occur?
The comparison uses the same controls (data selection, graph scale, and matrix) as the individual model visualizations.
Matrix formulas for profit curves
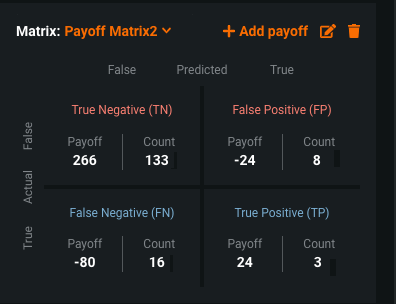
The profit curve plots the profit against the classification threshold. Profit is determined at each threshold from the sum of the product of each pair of confusion matrix and payoff matrix elements. Using this matrix as an example, with a total profit/loss 186:
Total profit/loss:
- True Negative (TN) = 133
- False Negative (FN) = 16
- False Positive (FP) = 8
- True Positive (TP) = 3
And corresponding payoff (P) matrix:
- PTN = 2
- PFN = –5
- PFP = –3
- PTP = 8
the net profit is the sum of the products of corresponding elements of the two matrices, calculated as follows:
Profit = (TN * PTN) + (FP * PFP) + (FN * PFN) + (TP * PTP)
In this example:
(133 * 2) + (8 * (-3)) + (16 * (-5)) + (3 * 8)
or
266 – 24 – 80 + 24 = 186
Relationship of profit curves to ROC curves
A profit curve is most useful for determining an optimal classification probability threshold, supplemental to the metrics of a ROC curve. That is, while the ROC curve can help you find the “best” threshold based on the various statistics or your domain expertise, a profit curve helps you pick a threshold based on the costs of true and false positive and negative predictions. It provides a sense of model sensitivity in the context of your business problem—a gentle sloping curve suggests more flexibility, while a sharp pitch tells you what threshold area to avoid. The shape depends on the selected model and the payoff values assigned.
By adding payoff values in the profit matrix, you create a multiplicative effect that can give you total profit/loss estimates, with varying inputs to allow comparison. The profit curve uses the same data as the ROC curve, meaning that when the threshold is the same, the confusion matrix counts in each visualization are the same. The threshold set for prediction output is shared between the profit curve and ROC Curve.
Profit Curve considerations
-
Because you cannot change the Prediction Threshold value after a model has been downloaded or deployed, there is slight delay in displaying the threshold while DataRobot checks the model status.
-
Using the profit curve is not recommended for baseline (majority class classifier) models.
-
The payoff matrix shows weighted counts (and those weighted counts are used to calculate profit).
