Custom metrics
On a deployment's Monitoring > Custom metrics tab, you can use the data you collect from the Data exploration tab (or data calculated through other custom metrics) to compute and monitor custom business or performance metrics. When you configure evaluation and moderation guardrails (including NeMo Evaluator metrics) for a text generation or agentic workflow deployment, the guards also report metrics to this tab—for example, guard latency, average score for prompt or response, and blocked count per guard—so you can monitor and debug guard behavior over time. These metrics are recorded on the configurable Custom metrics summary dashboard, where you monitor, visualize, and export each metric's change over time. This feature allows you to implement your organization's specialized metrics, expanding on the insights provided by DataRobot's built-in service health, data drift, and accuracy metrics.
Custom metrics limits
You can have up to 50 custom metrics per deployment, and of those 50, 5 can be hosted custom metrics.
To view and add custom metrics, in the Console, open the deployment for which you want to create custom metrics and click the Monitoring > Custom metrics tab:
What types of custom metrics are supported?
Three types of custom metrics are available for use:
| Custom metric type | Description |
|---|---|
| External custom metrics |
|
| Hosted custom metrics |
|
| Hosted custom metric templates |
|
Add custom metrics
To add a metric, in a predictive or generative modeling deployment, click the Monitoring > Custom metrics tab. Then, on the Custom metrics tab, click + Add custom metric, select one of the following custom metric types, and proceed to the configuration steps linked in the table:

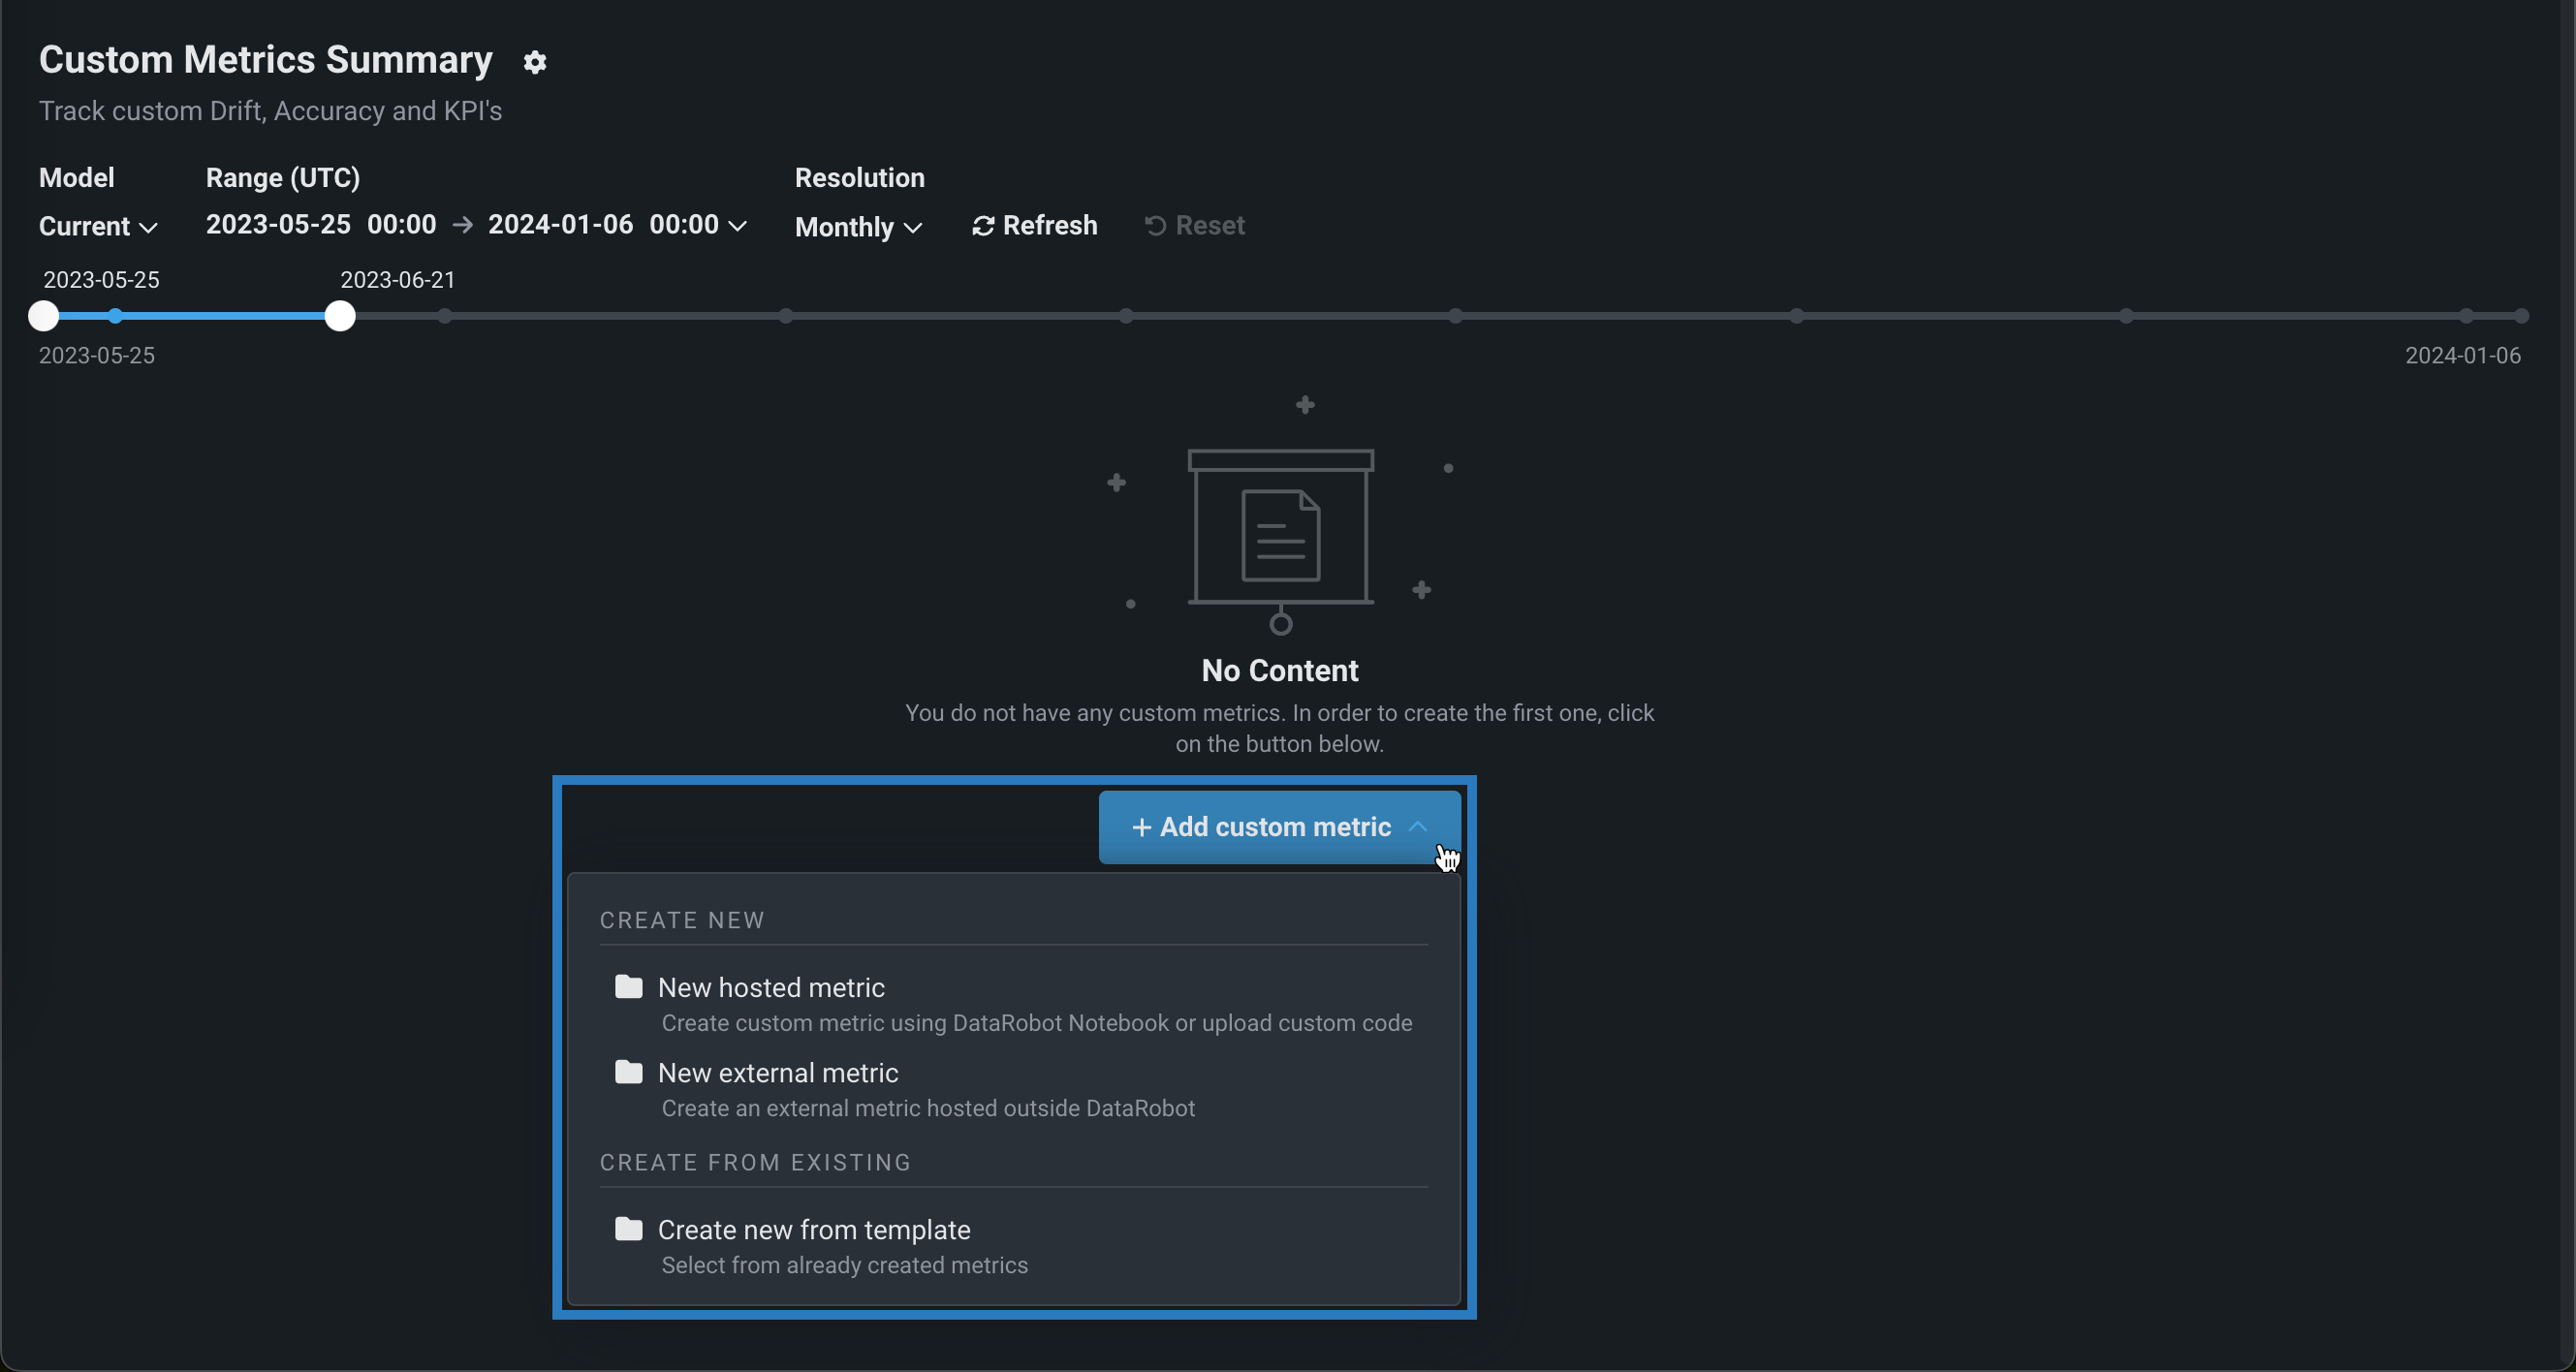
| Custom metric type | Description |
|---|---|
| New external metric | Add a custom metric where the calculations of the metric are not directly hosted by DataRobot. An external metric is a simple API used to submit a metric value for DataRobot to save and visualize. The metric calculation is handled externally, by the user. External metrics can be combined with other tools in DataRobot like notebooks, jobs, or custom models, or external tools like Airflow or cloud providers to provide the hosting and calculation needed for a particular metric. External custom metrics provide a simple option to save a value from your AI solution for tracking and visualization in DataRobot. For example, you could track the change in LLM cost, calculated by your LLM provider, over time. |
| New hosted metric | Add a custom metric where the metric calculations are hosted in a custom job within DataRobot. For hosted metrics, DataRobot orchestrates pulling the data, computing the metric values, saving the values to storage, and visualizing the data. No outside tools or infrastructure are required. Hosted custom metrics provide a complete end-to-end workflow for building business-specific metrics and dashboards in DataRobot. |
| Create new from template | Add a custom metric from a template, or ready-to-use example of a hosted custom metric, where DataRobot provides the code and automates the creation process. With metric templates, the result is a hosted metric, without starting from scratch. Templates are provided by DataRobot and can be used as-is or modified to calculate new metrics. Hosted custom metric templates provide the simplest way to get started with custom metrics, where DataRobot provides an example implementation and a complete end-to-end workflow. They are ready to use in just a few clicks. |
Add external custom metrics
External custom metrics allow you to create metrics with calculations occurring outside of DataRobot. With an external metric, you can submit a metric value for DataRobot to save and visualize. External metrics can be combined with other tools in DataRobot like notebooks, jobs, or custom models, or external tools like Airflow or cloud providers to provide the hosting and calculation needed for a particular metric.
To add an external custom metric, in the Add custom metric dialog box, configure the metric settings, and then click + Add custom metric:
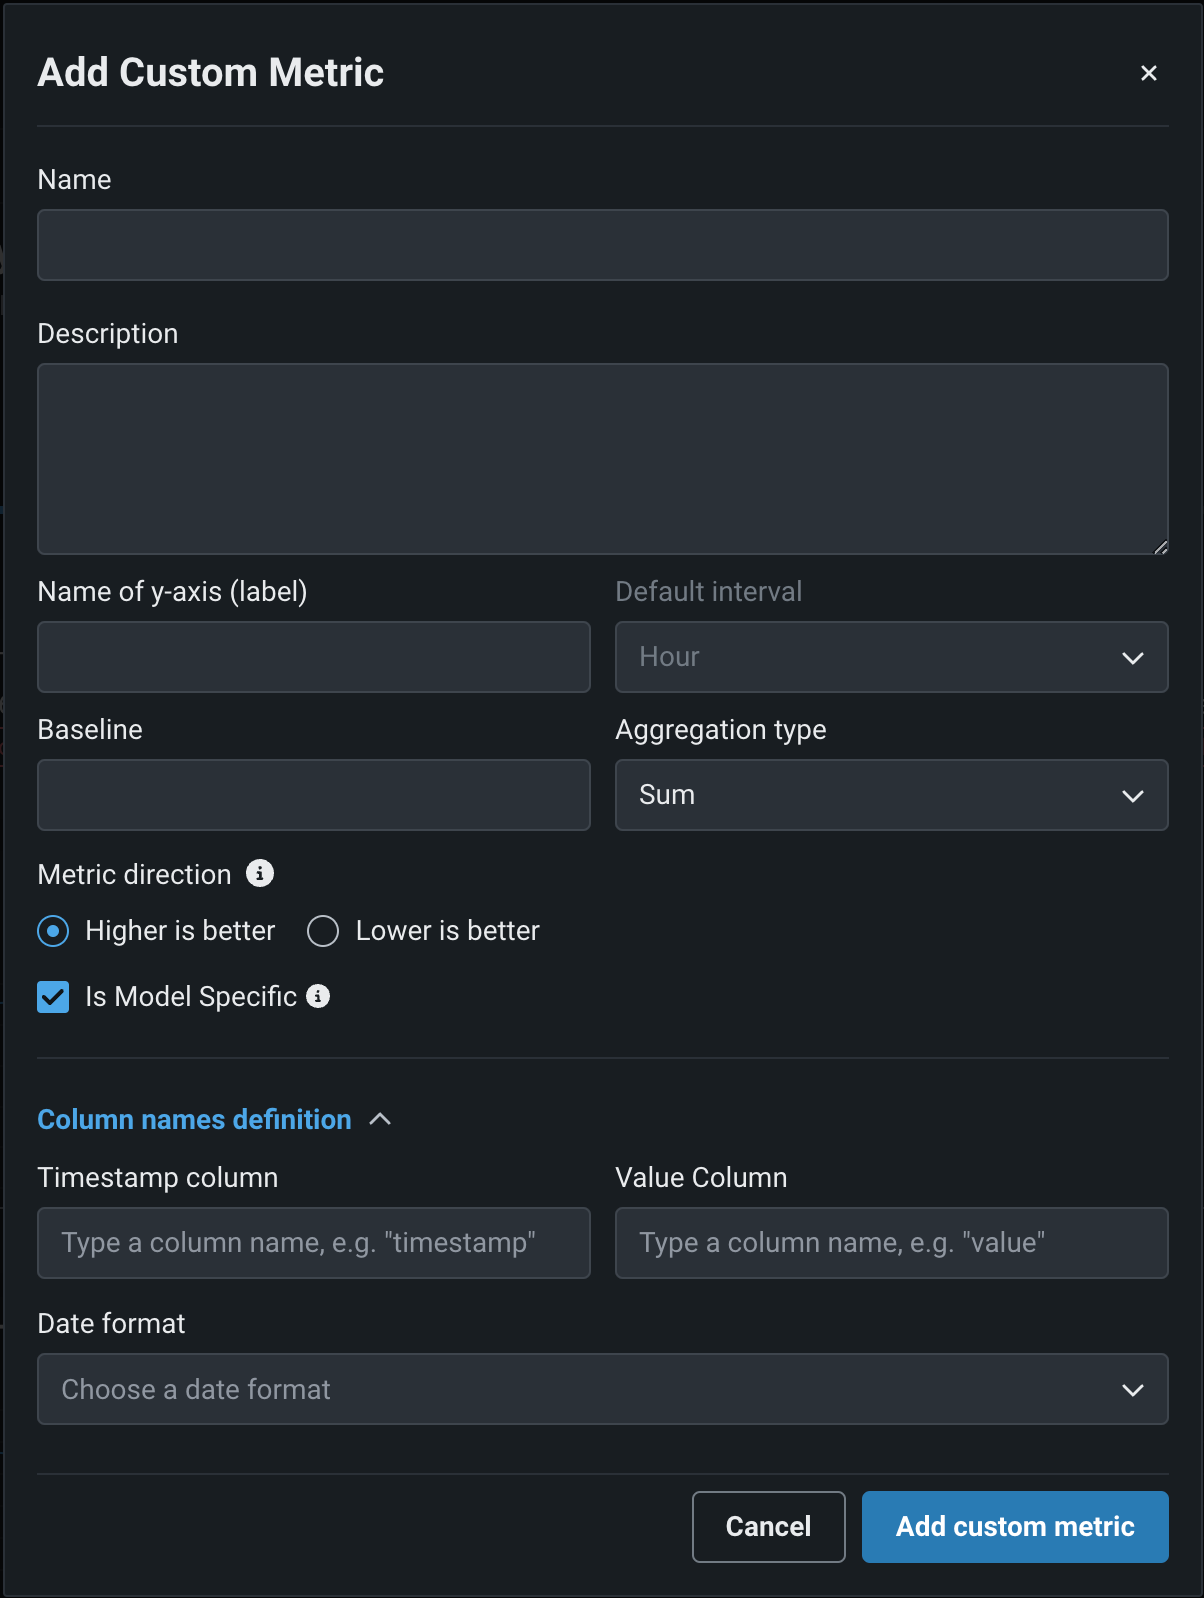
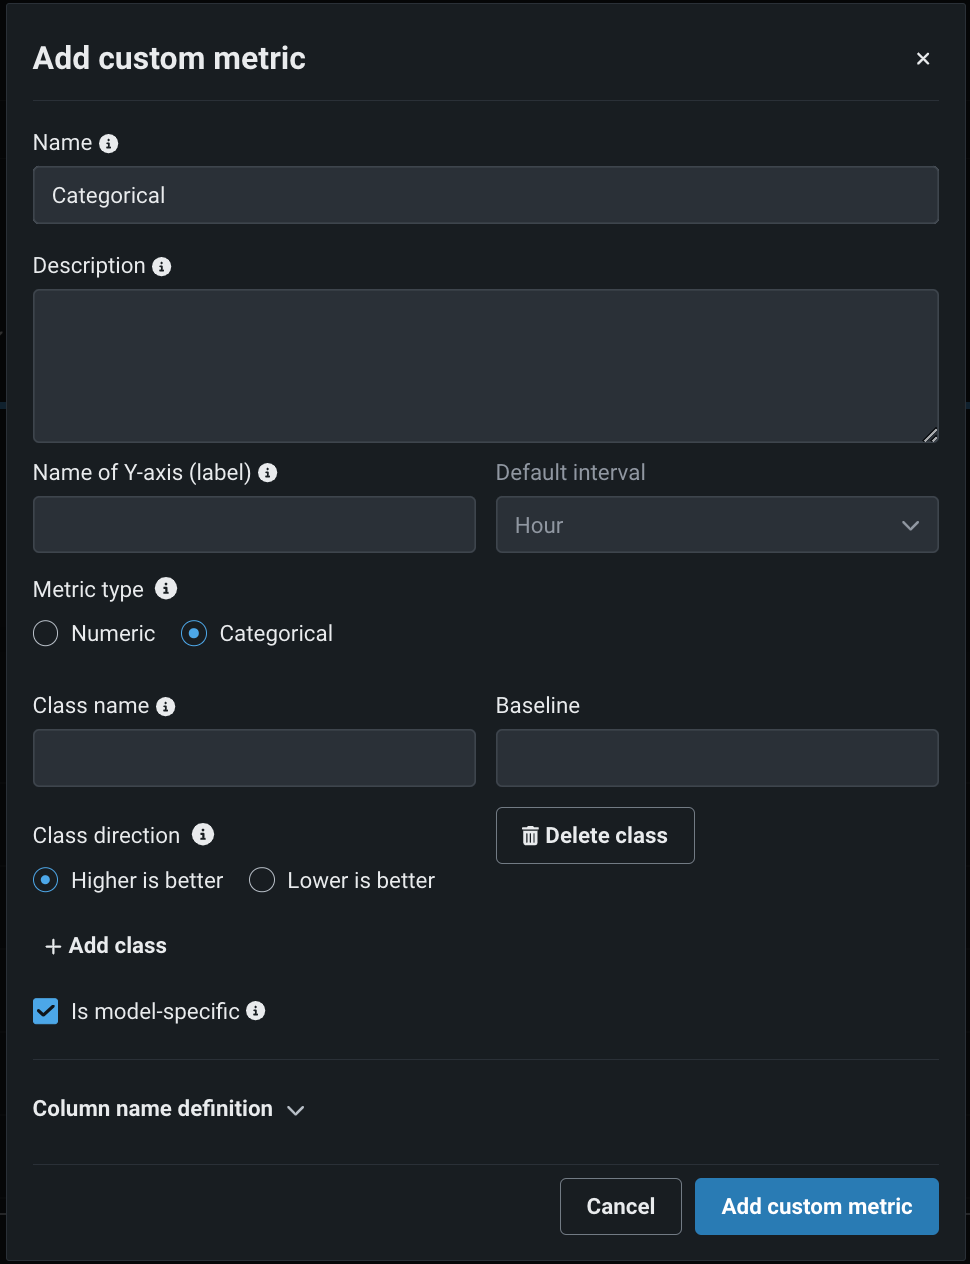
| Field | Description |
|---|---|
| Name | A descriptive name for the metric. This name appears on the Custom metrics summary dashboard. |
| Description | (Optional) A description of the custom metric; for example, you could describe the purpose, calculation method, and more. |
| Name of Y-axis (label) | A descriptive name for the dependent variable. This name appears on the custom metric's chart on the Custom Metric Summary dashboard. |
| Default interval | The default interval used by the selected Aggregation type. Only HOUR is supported. |
| Metric type | The type of metric to create, Numeric or Categorical. The available metric settings change based on this selection. |
| Numeric metric settings | |
| Baseline | (Optional) The value used as a basis for comparison when calculating the x% better or x% worse values. |
| Aggregation type | The type of metric calculation. Select from Sum, Average, or Gauge—a metric with a distinct value measured at single point in time. |
| Metric direction | The directionality of the metric, controlling how changes to the metric are visualized. You can select Higher is better or Lower is better. For example, if you choose Lower is better, a 10% decrease in the calculated value of your custom metric will be considered 10% better, and displayed in green. |
| Categorical metric settings | |
| Class name | For each class added, a descriptive name (maximum of 200 characters). |
| Baseline | (Optional) For each class added, the value used as a basis for comparison when calculating the x% better or x% worse values. |
| Class direction | For each class added, the directionality of the metric, controlling how changes to the metric are visualized. You can select Higher is better or Lower is better. For example, if you choose Lower is better, a 10% decrease in the calculated value of your custom metric will be considered 10% better, and displayed in green. |
| + Add class | To define each class needed for the categorical metric, click + Add class and configure the required class settings listed above. You can add up to ten classes. To remove a class, click Delete class. |
| Model specific aggregation setting | |
| Is model-specific | When enabled, links the metric to the model with the Model Package ID (the Registered Model Version ID) provided in the dataset. This setting influences when values are aggregated (or uploaded). For example:
|
| Is geospatial | Determines if the custom metric will use geospatial data. When enabled, select a Geospatial segment attribute. The deployment must have at least one geospatial/location feature. |
| Column name definitions for standard deployments | |
| Timestamp column | The column in the dataset containing a timestamp. |
| Value column | The column in the dataset containing the values used for custom metric calculation. |
| Date format | (Optional) The date format used by the timestamp column. |
| Column name definitions for batch deployments | |
| Batch column | The column in the dataset containing batch IDs for each batch (not the batch name). Max allowed length is 100 characters. |
| Value column | The column in the dataset containing the values used for custom metric calculation. Max allowed length is 100 characters |
Premium
Geospatial monitoring is a premium feature. Contact your DataRobot representative or administrator for information on enabling the feature.
Geospatial feature monitoring support
Geospatial feature monitoring is supported for binary classification, multiclass, regression, and location target types.
Note
You can override the Column names definition settings when you upload data to a custom metric, as described below.
Add hosted custom metrics
Hosted custom metrics allow you to implement up to 5 of your organization's specialized metrics in a deployment, uploading the custom metric code using DataRobot Notebooks and hosting the metric calculation on custom jobs infrastructure. After creation, these custom metrics can be reused for other deployments.
Custom metrics limits
You can have up to 50 custom metrics per deployment, and of those 50, 5 can be hosted custom metrics.
Time series support
The DataRobot Model Metrics (DMM) library does not support time series models, specifically data export for time series models. To export and retrieve data, use the DataRobot API client.
To add a hosted custom metric, in the Add Custom Metric dialog box configure the metric settings, and then click Add custom metric from notebook:
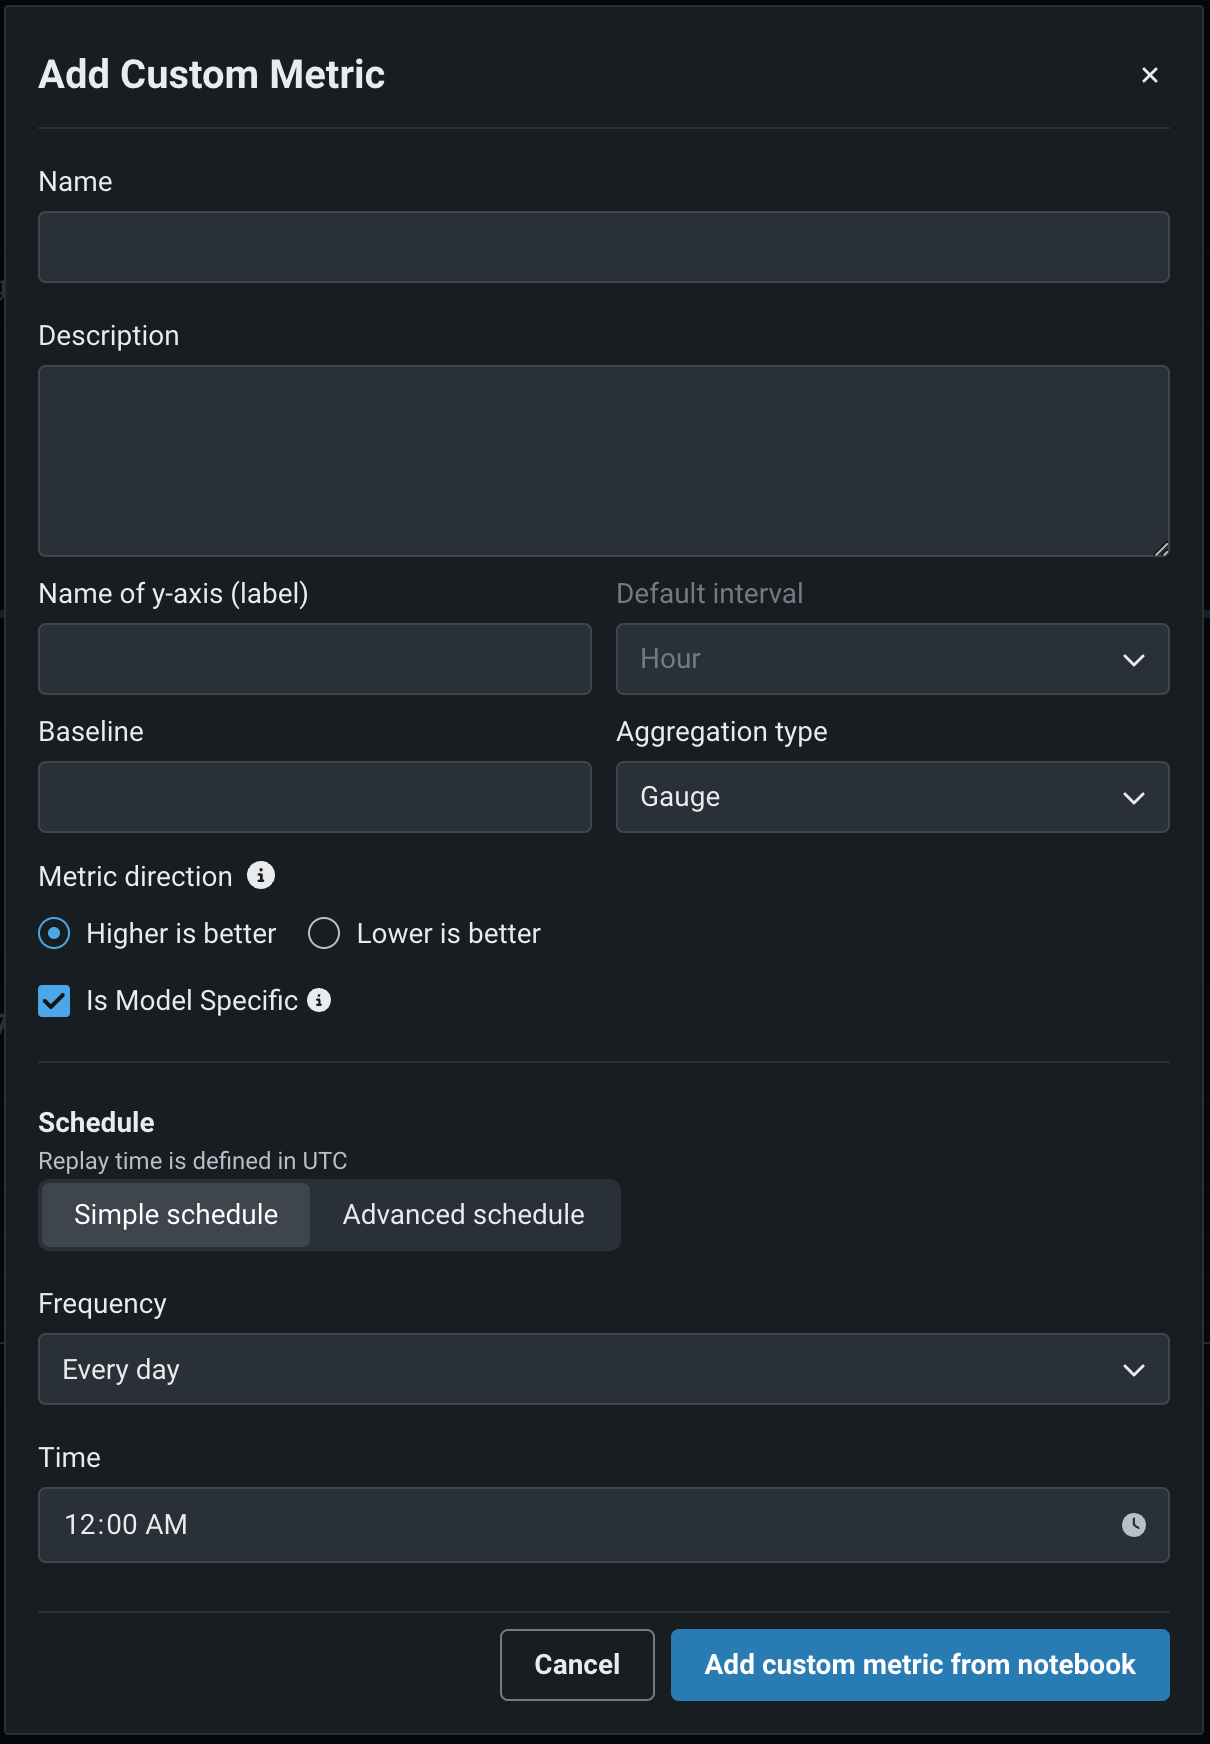
| Field | Description |
|---|---|
| Name | (Required) A descriptive name for the metric. This name appears on the Custom Metric Summary dashboard. |
| Description | A description of the custom metric; for example, you could describe the purpose, calculation method, and more. |
| Name of y-axis (label) | (Required) A descriptive name for the dependent variable. This name appears on the custom metric's chart on the Custom Metric Summary dashboard. |
| Default interval | Determines the default interval used by the selected Aggregation type. Only HOUR is supported. |
| Baseline | Determines the value used as a basis for comparison when calculating the x% better or x% worse values. |
| Aggregation type | Determines if the metric is calculated as a Sum, Average, or Gauge—a metric with a distinct value measured at single point in time. |
| Metric direction | Determines the directionality of the metric, which controls how changes to the metric are visualized. You can select Higher is better or Lower is better. For example, if you choose Lower is better a 10% decrease in the calculated value of your custom metric will be considered 10% better, displayed in green. |
| Is model-specific | When enabled, this setting links the metric to the model with the Model Package ID (Registered Model Version ID) provided in the dataset. This setting influences when values are aggregated (or uploaded). For example:
|
| Is geospatial | Determines if the custom metric will use geospatial data. When enabled, select a Geospatial segment attribute. The deployment must have at least one geospatial/location feature. |
| Schedule | Defines when the custom metrics are populated. Select a frequency (hourly, daily, monthly, etc.) and a time. Select Use advanced scheduler for more precise scheduling options. |
Premium
Geospatial monitoring is a premium feature. Contact your DataRobot representative or administrator for information on enabling the feature.
Geospatial feature monitoring support
Geospatial feature monitoring is supported for binary classification, multiclass, regression, and location target types.
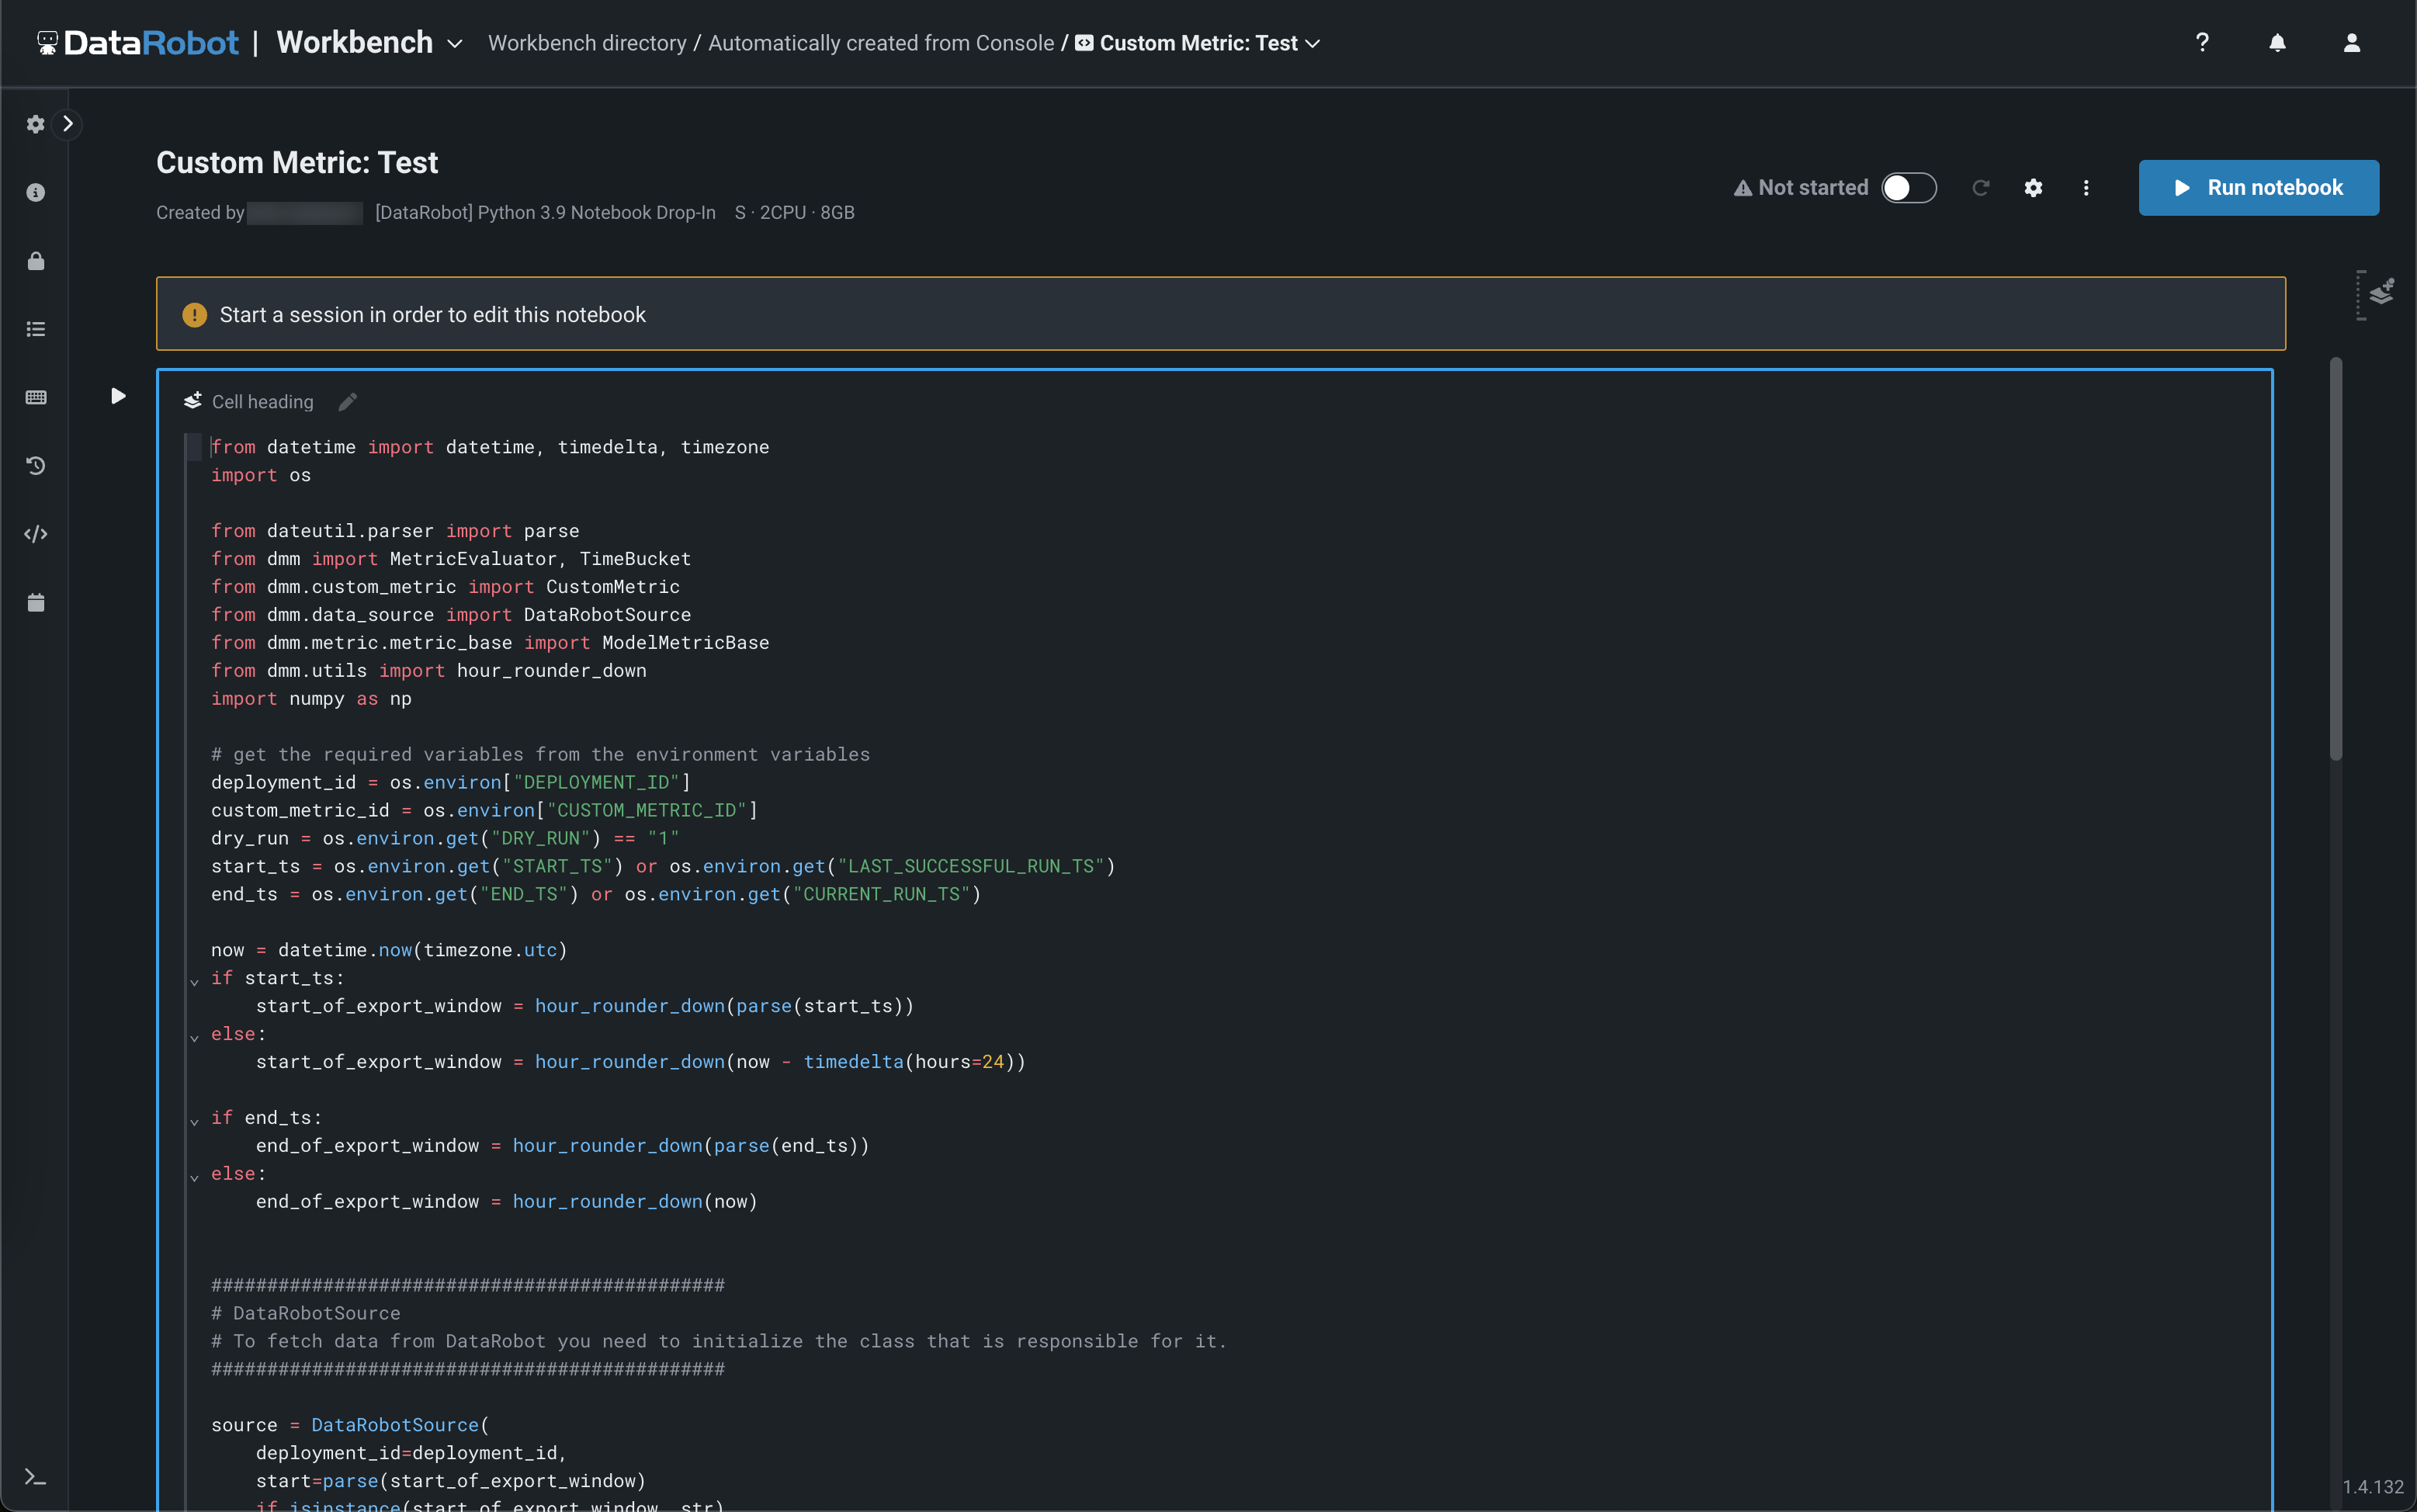
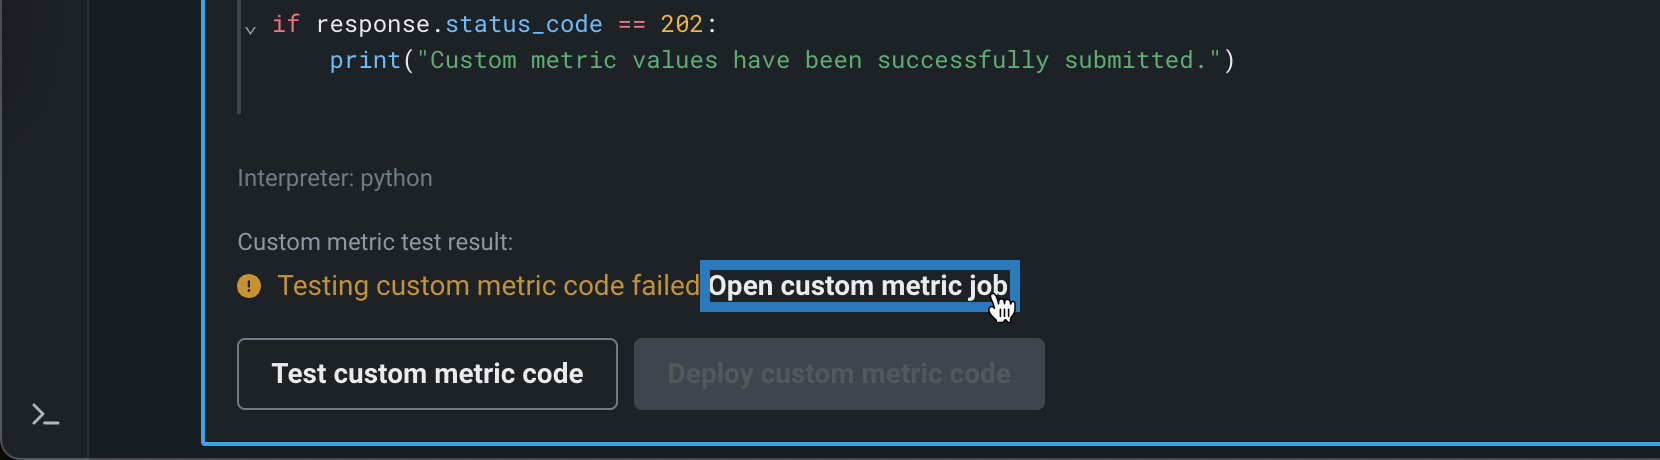
After configuring a custom metric, DataRobot loads the notebook that contains the metric's code. The notebook contains one custom metric cell. A custom metric cell is a unique notebook cell, containing Python code defining how the metric is exported and calculated, code for scoring, and code to populate the metric. Modify the code in the custom metric cell as needed. Then, test the code by clicking Test custom metric code at the bottom of the cell. The test creates a custom job. If the test runs successfully, click Deploy custom metric code to add the custom metric to your deployment.
Availability information
Notebooks for hosted custom metrics are off by default. Contact your DataRobot representative or administrator for information on enabling this feature.
Feature flag: Enable Notebooks Custom Environments
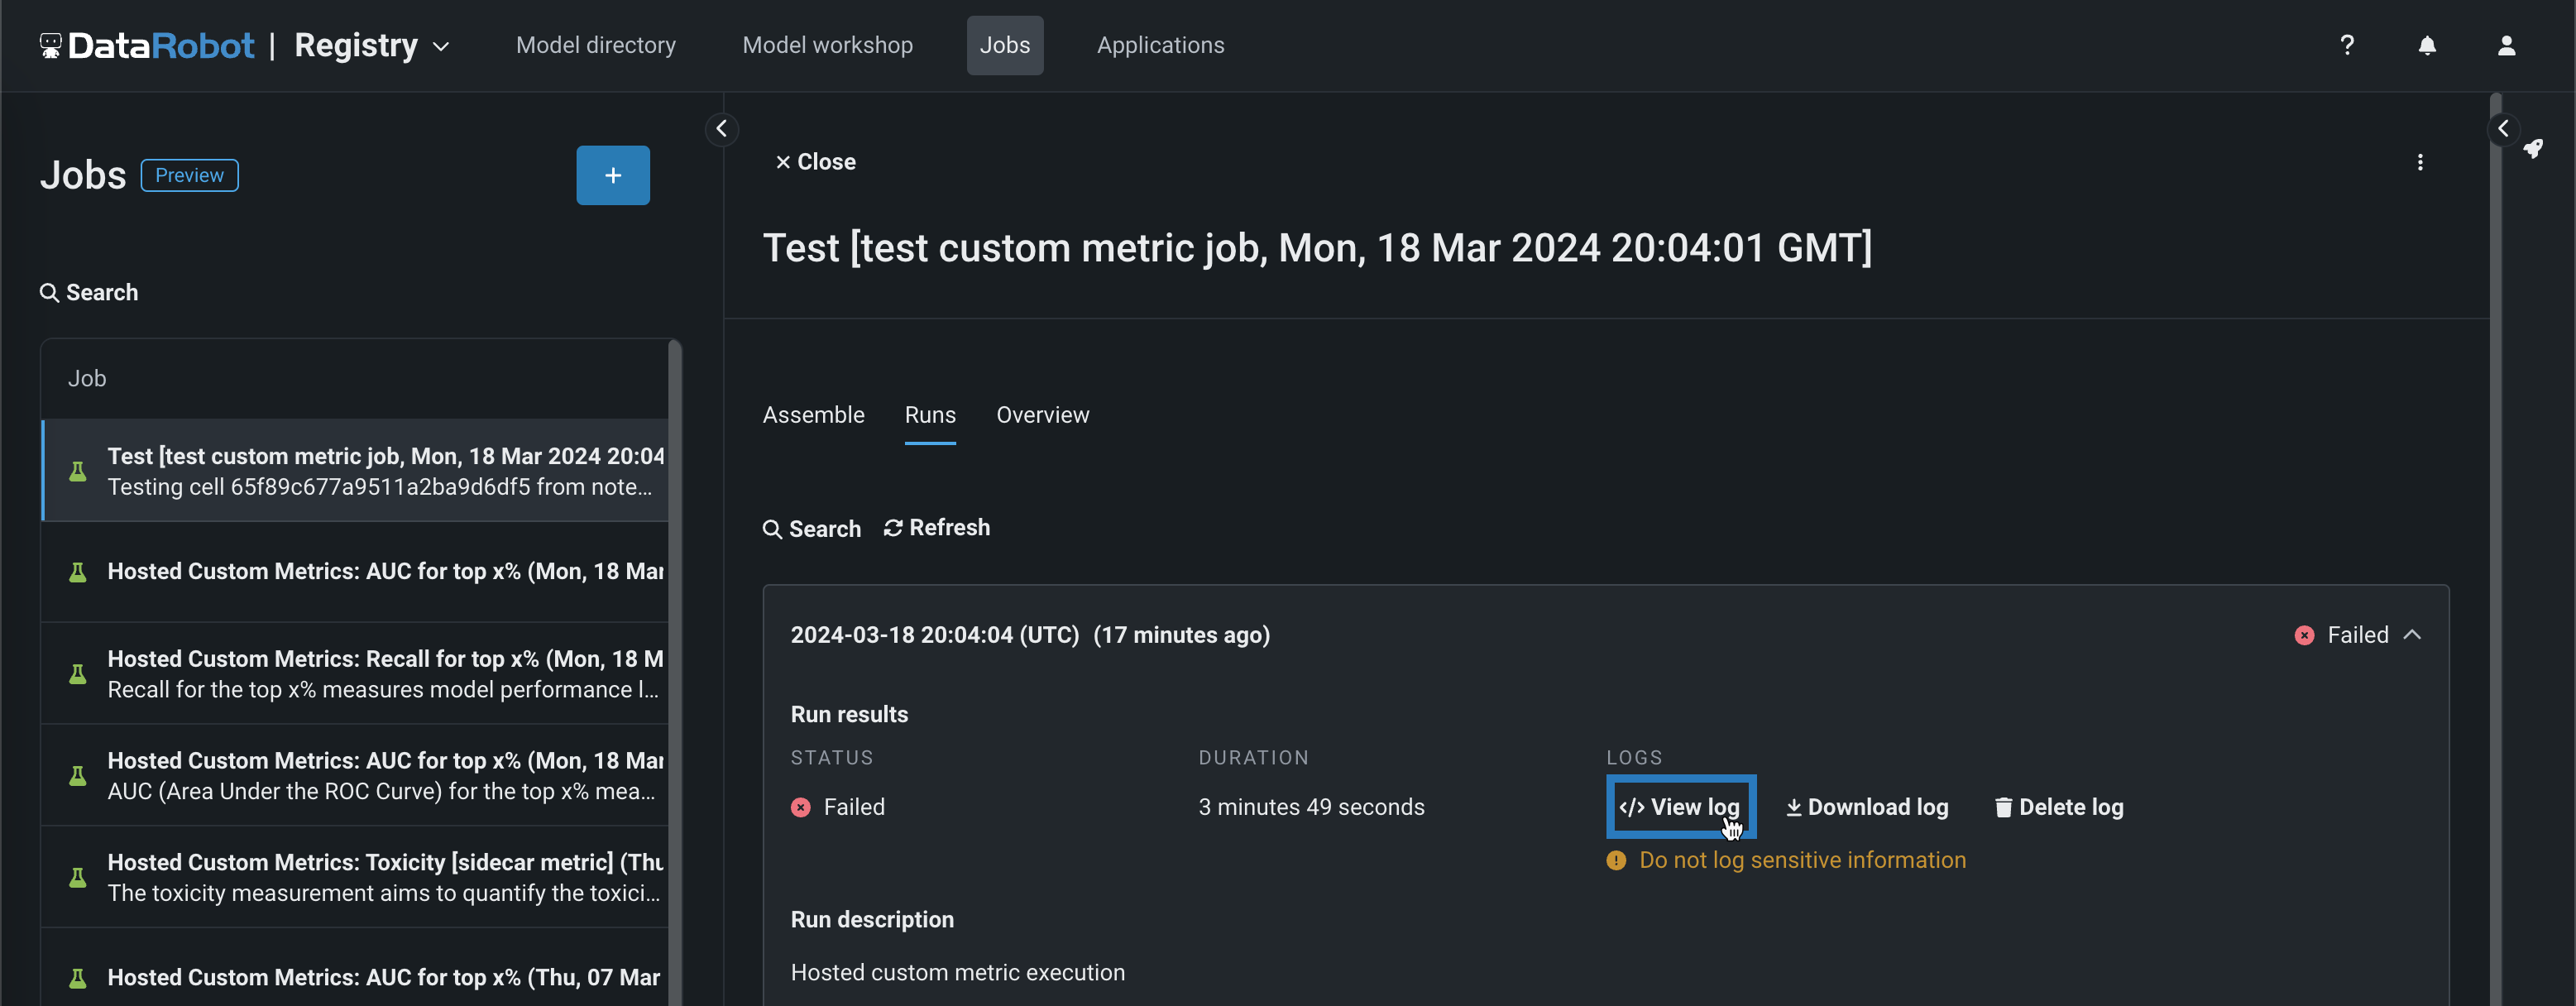
If the code does not run properly, you will receive the Testing custom metric code failed warning after testing completes. Click Open custom metric job to access the job and check the logs to troubleshoot the issue:
To troubleshoot a custom metric's code, navigate to the job's Runs tab, containing a log of the failed test. In the failed run, click View log.
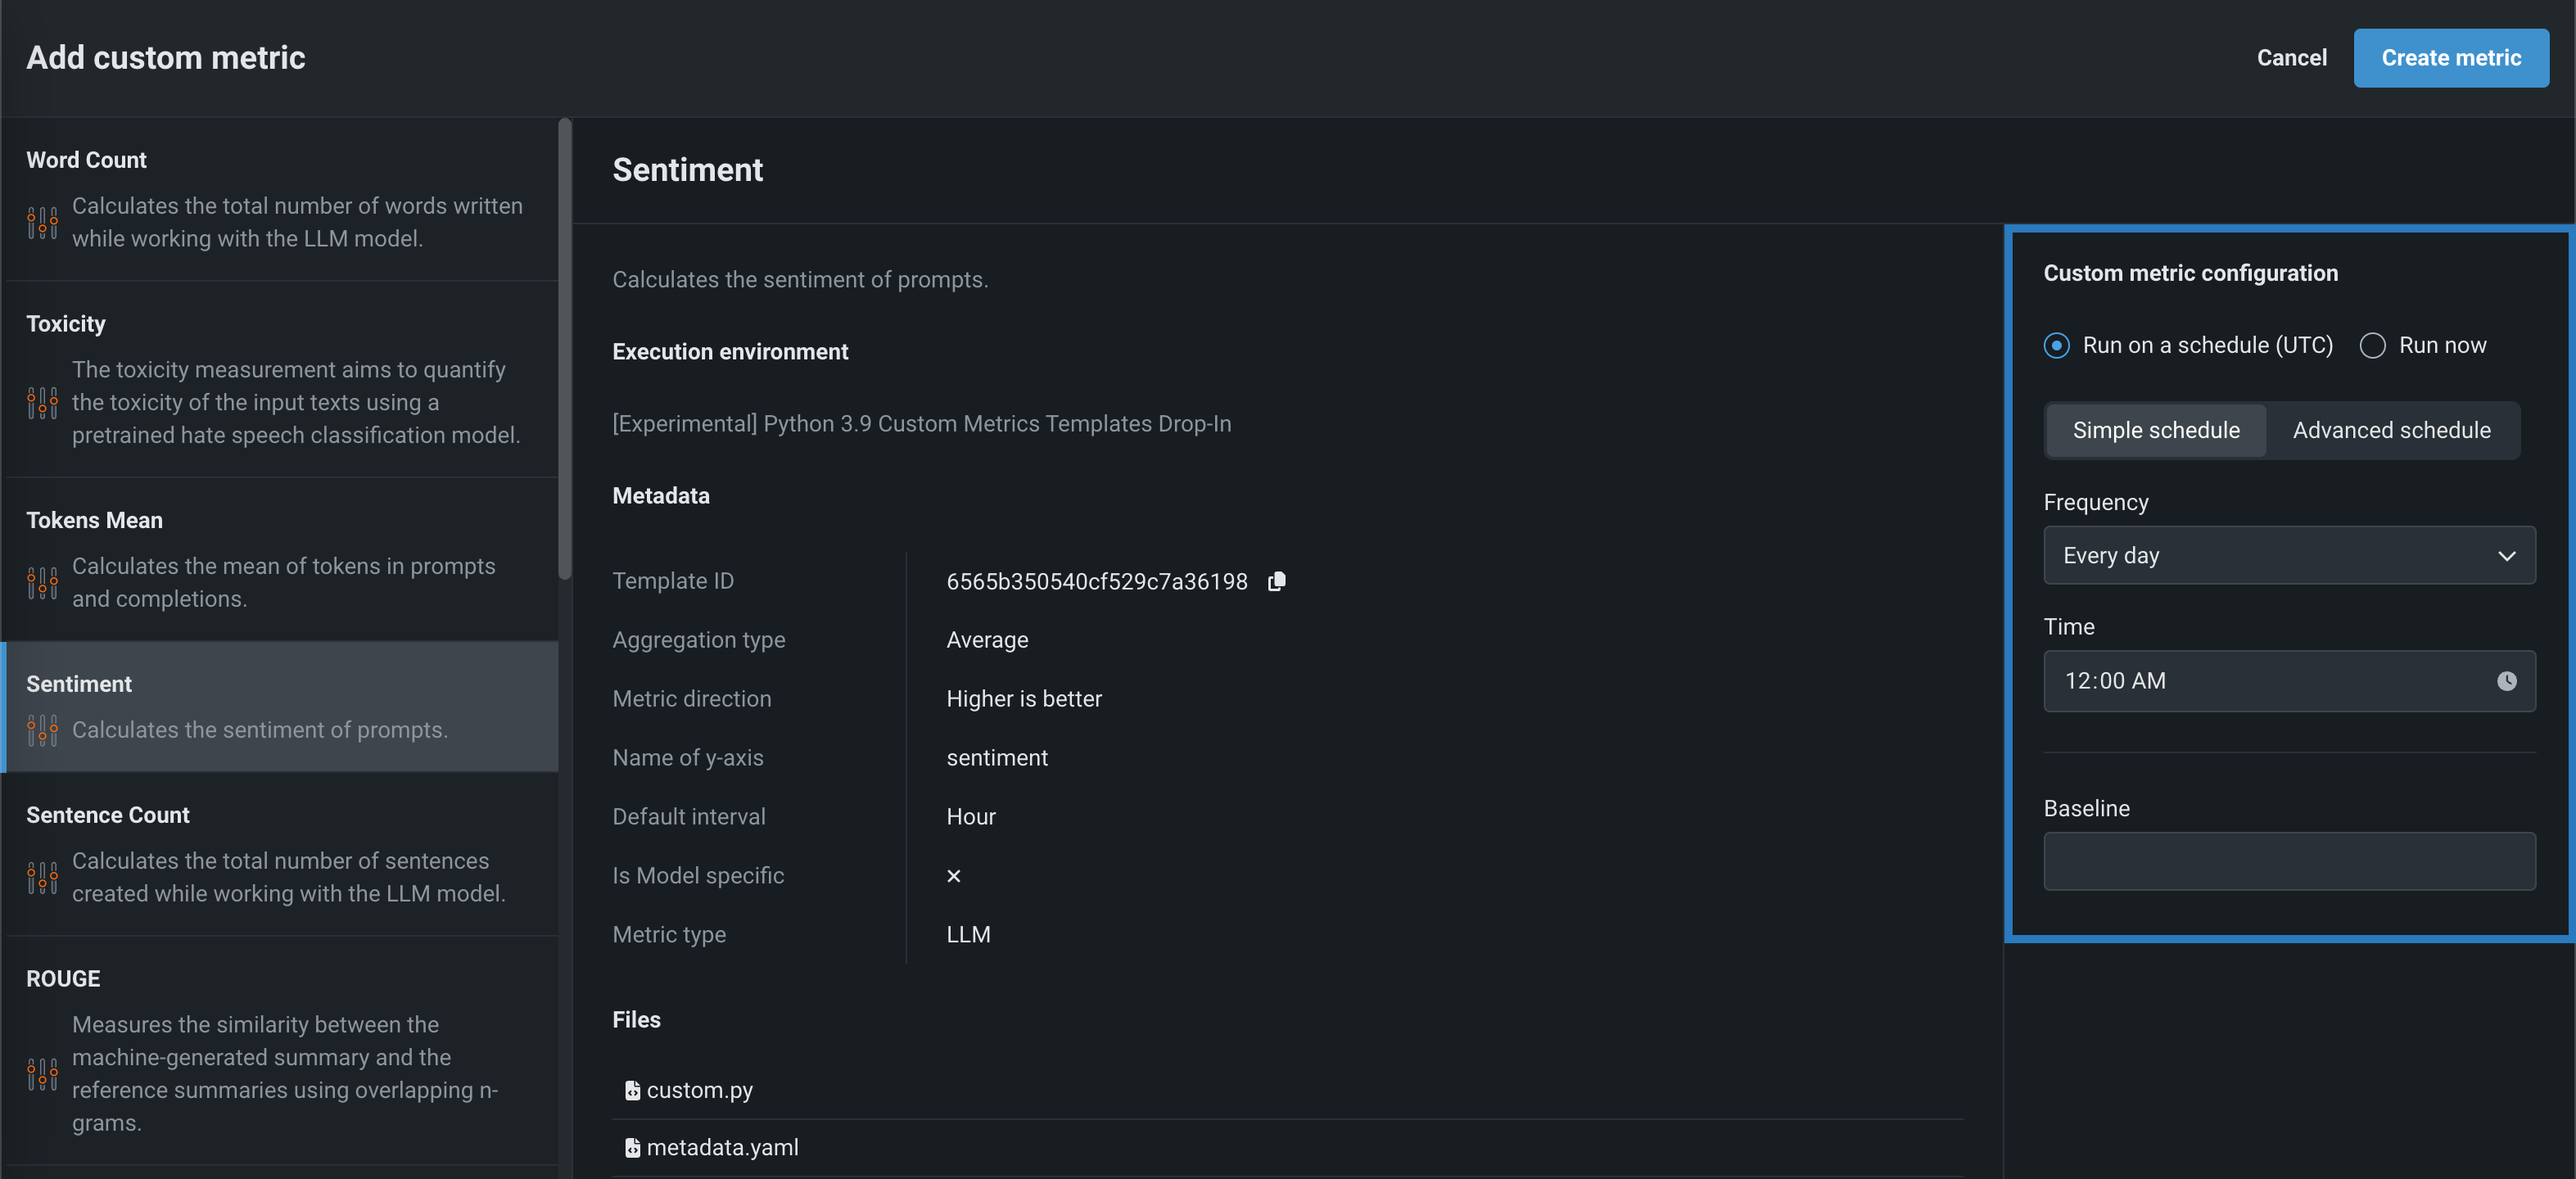
Add hosted custom metrics from the gallery
The custom metrics gallery provides a centralized library containing pre-made, reusable, and shareable code implementing a variety of hosted custom metrics for predictive and generative models. These metrics are recorded on the configurable Custom Metric Summary dashboard, alongside any external custom metrics. From this dashboard, you can monitor, visualize, and export each metric's change over time. This feature allows you to implement your organization's specialized metrics, expanding on the insights provided by DataRobot's built-in service health, data drift, and accuracy metrics.
To add a pre-made custom metric to a deployment:
-
In the Add custom metric panel, select a custom metric template applicable to your use case.
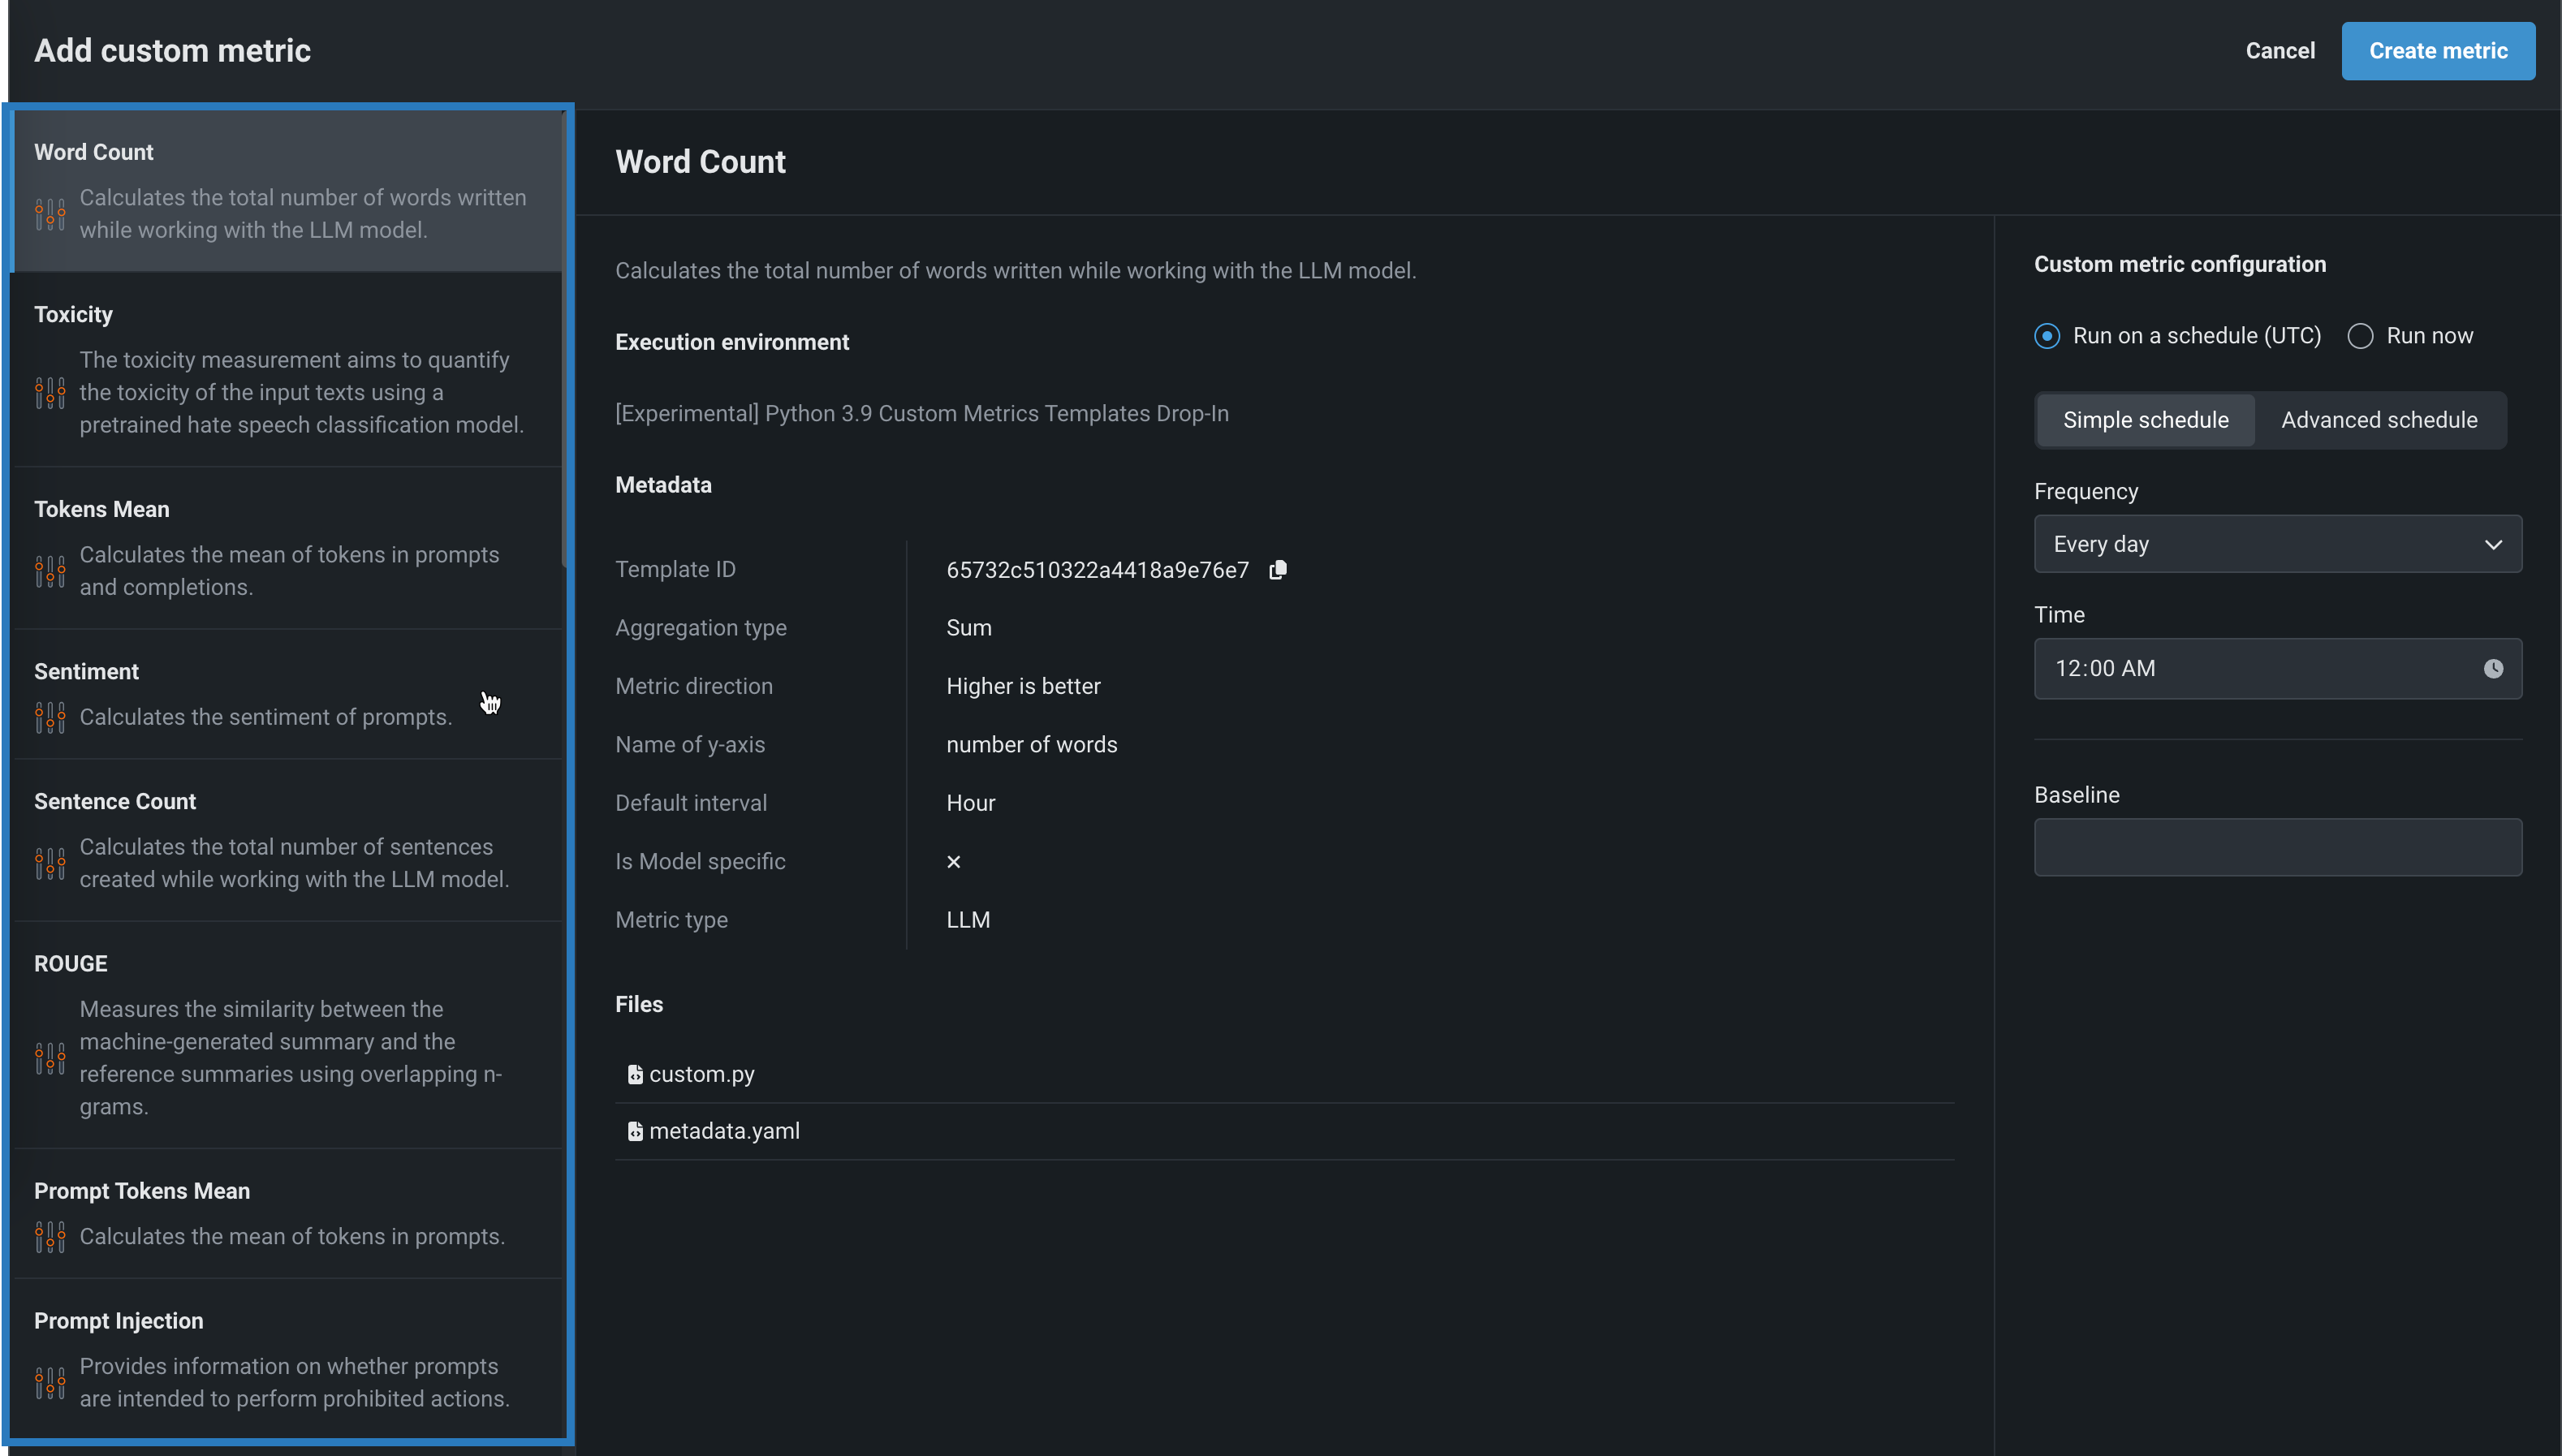
DataRobot provides three different categories of Metric type:
Custom metric template Description Recall for top x% Measures model performance limited to a certain top fraction of the sorted predicted probabilities. Recall is a measure of a model's performance that calculates the proportion of actual positives that are correctly identified by the model. Precision for top x% Measures model performance limited to a certain top fraction of the sorted predicted probabilities. Precision is a measure of a model's performance that calculates the proportion of correctly predicted positive observations from the total predicted positive. F1 for top x% Measures model performance limited to a certain top fraction of the sorted predicted probabilities. F1 score is a measure of a model's performance which considers both precision and recall. AUC (Area Under the ROC Curve) for top x% Measures model performance limited to a certain top fraction of the sorted predicted probabilities. Custom metric template Description Mean Squared Logarithmic Error (MSLE) Calculates the mean of the squared differences between logarithms of the predicted and actual values. It is a loss function used in regression problems when the target values are expected to have exponential growth, like population counts, average sales of a commodity over a time period, and so on. Median Absolute Error (MedAE) Calculates the median of the absolute differences between the target and the predicted values. It is a robust metric used in regression problems to measure the accuracy of predictions. Custom metric template Description Completion Reading Time Estimates the average time it takes a person to read text generated by the LLM. Completion Tokens Mean Calculates the mean number of tokens in completions for the time period requested. The cl100k_base encoding used only supports OpenAI models: gpt-4, gpt-3.5-turbo, and text-embedding-ada-002. If you use a different model, change the encoding. Cosine Similarity Average Calculates the mean cosine similarity between each prompt vector and corresponding context vectors. Cosine Similarity Maximum Calculates the maximum cosine similarity between each prompt vector and corresponding context vectors. Cosine Similarity Minimum Calculates the minimum cosine similarity between each prompt vector and corresponding context vectors. Cost Estimates the financial cost of using the LLM by calculating the number of tokens in the input, output, and retrieved text, and then applying token pricing. The cl100k_base encoding used only supports OpenAI models: gpt-4, gpt-3.5-turbo, and text-embedding-ada-002. If you use a different model, change the encoding. Dale Chall Readability Measures the U.S. grade level required to understand a text based on the percentage of difficult words and average sentence length. Euclidean Average Calculates the mean Euclidean distance between each prompt vector and corresponding context vectors. Euclidean Maximum Calculates the maximum Euclidean distance between each prompt vector and corresponding context vectors. Euclidean Minimum Calculates the minimum Euclidean distance between each prompt vector and corresponding context vectors. Flesch Reading Ease Measures the readability of text based on the average sentence length and average number of syllables per word. Prompt Injection [sidecar metric] Detects input manipulations, such as overwriting or altering system prompts, that are intended to modify the model's output. This metric requires an additional deployment of the Prompt Injection Classifier global model. Prompt Tokens Mean Calculates the mean number of tokens in prompts for the time period requested. The cl100k_base encoding used only supports OpenAI models: gpt-4, gpt-3.5-turbo, and text-embedding-ada-002. If you use a different model, change the encoding. Sentence Count Calculates the total number of sentences in user prompts and text generated by the LLM. Sentiment Classifies text sentiment as positive or negative Sentiment [sidecar metric] Classifies text sentiment as positive or negative using a pre-trained sentiment classification model. This metric requires an additional deployment of the Sentiment Classifier global model. Syllable Count Calculates the total number of syllables in the words in user prompts and text generated by the LLM. Tokens Mean Calculates the mean of tokens in prompts and completions. The cl100k_base encoding used only supports OpenAI models: gpt-4, gpt-3.5-turbo, and text-embedding-ada-002. If you use a different model, change the encoding. Toxicity [sidecar metric] Measures the toxicity of text using a pre-trained hate speech classification model to safeguard against harmful content. This metric requires an additional deployment of the Toxicity Classifier global model. Word Count Calculates the total number of words in user prompts and text generated by the LLM. Japanese text metrics [JP] Character Count Calculates the total number of characters generated while working with the LLM. [JP] PII occurrence count Calculates the total number of PII occurrences while working with the LLM. Custom metric template Description Agentic completion tokens Calculates the total completion tokens of agent-based LLM calls. Agentic cost Calculates the total cost of agent-based LLM calls. Requires that each LLM span reports token usage so the metric can compute cost from the trace. Agentic prompt tokens Calculates the total prompt tokens of agent-based LLM calls. -
After you select a metric from the list, in the Custom metric configuration sidebar, configure a metric calculation schedule or run the metric calculation immediately, and, optionally, set a metric baseline value.
Sidecar metrics
If you selected a
[sidecar metric], when you open the Assemble tab, navigate to the Runtime Parameters section to set theSIDECAR_DEPLOYMENT_ID, associating the sidecar metric with the connected deployment required to calculate that metric. If you haven't deployed a model to calculate the metric, you can find pre-defined models for these metrics as global models. -
Click Create metric. The new metric appears on the Custom metrics dashboard.
-
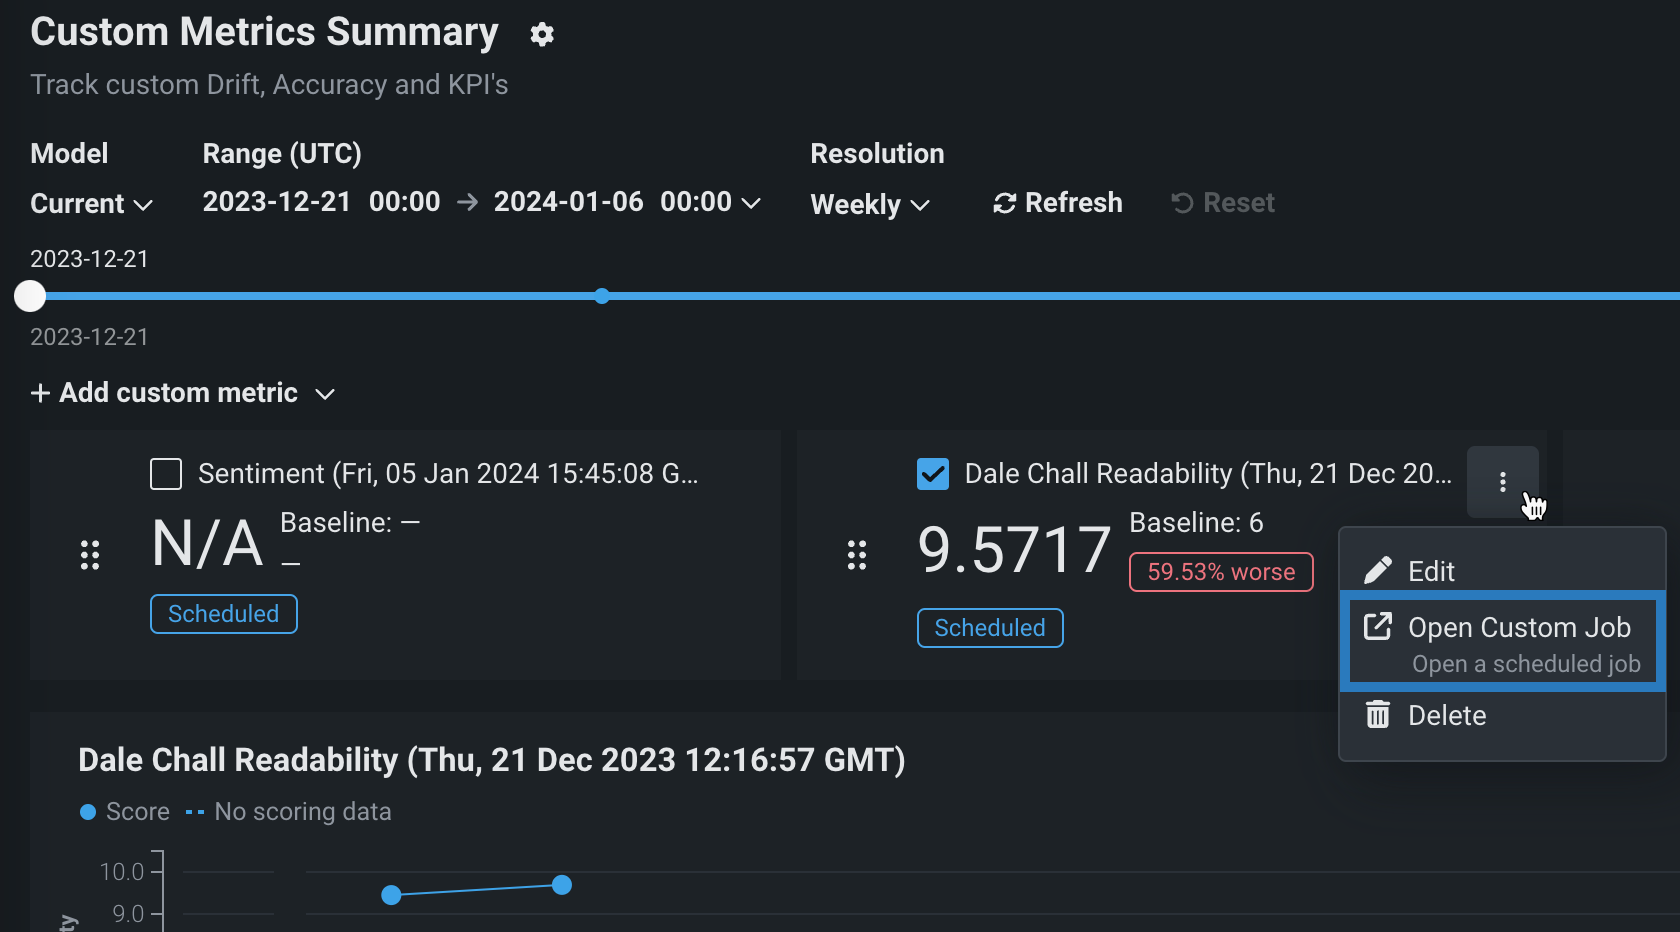
After you create a custom metric, you can view the custom job associated with the metric. This job runs on the metric's defined schedule, in the same way as hosted custom metrics (those not from the gallery). To access and manage the associated custom job, click the Actions menu and then click Open Custom Job:
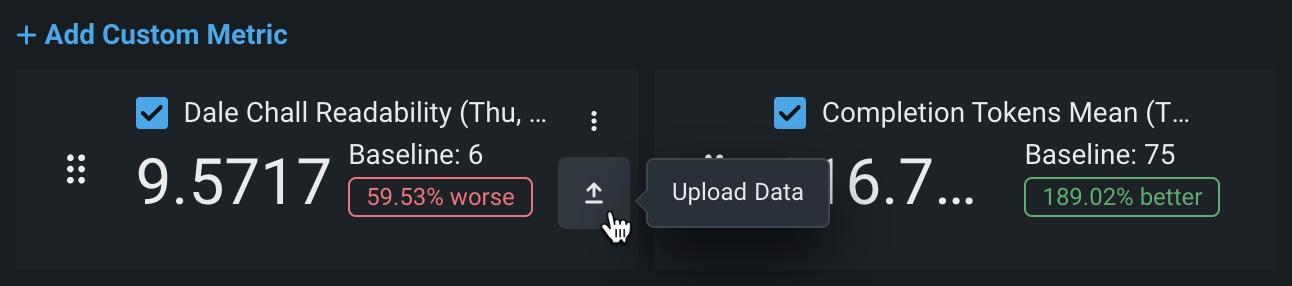
Upload data to custom metrics
After you create a custom metric, you can provide data to calculate the metric:
-
On the Custom metrics tab, locate the custom metric for which you want to upload data and click the Upload Data icon.
-
In the Upload data dialog box, select an upload method and click Next:
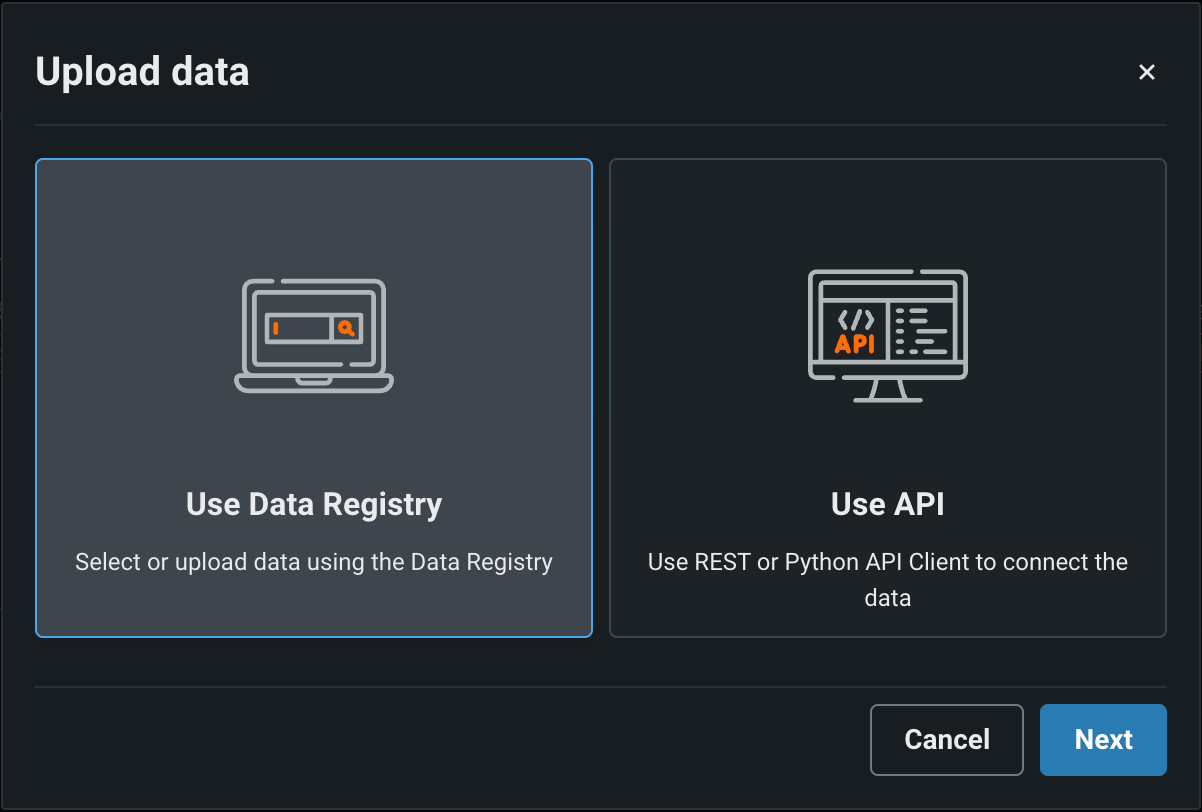
Upload method Description Use Data Registry In the Select a dataset panel, upload a dataset or click a dataset from the list, and then click Confirm. The Data Registry includes datasets from the Data exploration tab. Use API In the Use API Client panel, click Copy to clipboard, and then modify and use the API snippet to upload a dataset. You can upload up to 10,000 values in one API call. -
In the Select dataset columns dialog box, configure the following:
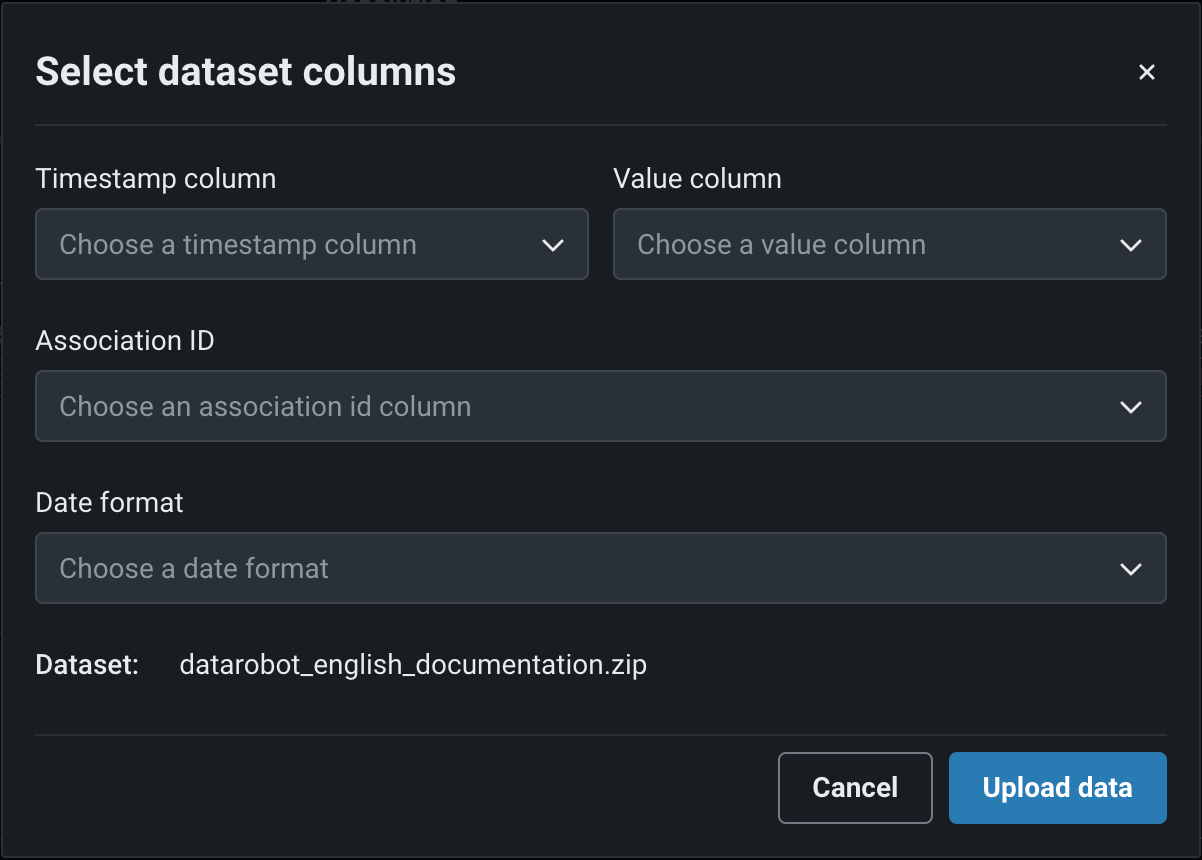
Field Description Timestamp column (Required) The column in the dataset containing a timestamp. Value column (Required) The column in the dataset containing the values used for custom metric calculation. Association ID The row containing the association ID required by the custom metric to link predicted values to actuals. Date format The date format used by the timestamp column. -
Click Upload data.
Report custom metrics via chat requests
For DataRobot-deployed text generation and agentic workflow custom models that implement the chat() hook, custom metric values can be reported directly in chat completion requests using the extra_body field. This allows reporting custom metrics at the same time as making chat requests, without needing to upload data separately.
Manual chat request construction
The OpenAI client converts the extra_body parameter contents to top-level fields in the JSON payload of the chat POST request. When manually constructing a chat payload, without the OpenAI client, include "datarobot_metrics": {...} in the top level of the payload.
To report custom metrics via chat requests:
-
Ensure the deployment has an association ID column defined and moderation configured. These are required for custom metrics to be processed.
-
Define custom metrics on the Custom Metrics tab as described in Add external custom metrics.
-
When making a chat completion request using the OpenAI client, include
datarobot_metricsin theextra_bodyfield with the metric names and values to report:
from openai import OpenAI

openai_client = OpenAI(
    base_url="https://<your-datarobot-instance>/api/v2/deployments/{deployment_id}/",
    api_key="<your_api_key>",
)

extra_body = {
    # These values pass through to the LLM
    "llm_id": "azure-gpt-6",
    # If set here, replaces the auto-generated association ID
    "datarobot_association_id": "my_association_id_0001",
    # DataRobot captures these for custom metrics
    "datarobot_metrics": {
        "field1": 24,
        "field2": 25
    }
}

completion = openai_client.chat.completions.create(
    model="datarobot-deployed-llm",
    messages=[
        {"role": "system", "content": "Explain your thoughts using at least 100 words."},
        {"role": "user", "content": "What would it take to colonize Mars?"},
    ],
    max_tokens=512,
    extra_body=extra_body
)

print(completion.choices[0].message.content)
Custom metric requirements
- A matching custom metric for each name in
datarobot_metricsmust already be defined for the deployment. - Custom metric values reported this way must be numeric.
- The deployed custom model must have an association ID column defined and moderation configured for the metrics to be processed.
For more information about using extra_body with chat requests, including how to specify association IDs, see the chat() hook documentation.
Manage custom metrics
On the Custom metrics dashboard, after you've added your custom metrics, you can edit or delete them:
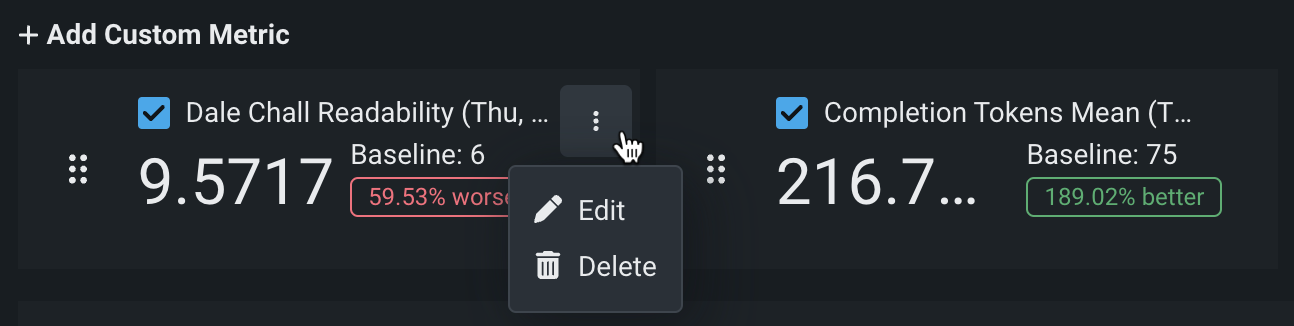
On the Custom metrics tab, locate the custom metric you want to manage, and then click the Actions menu :
-
To edit a metric, click Edit, update any configurable settings, and then click Update custom metric.
-
To delete a metric, click Delete.
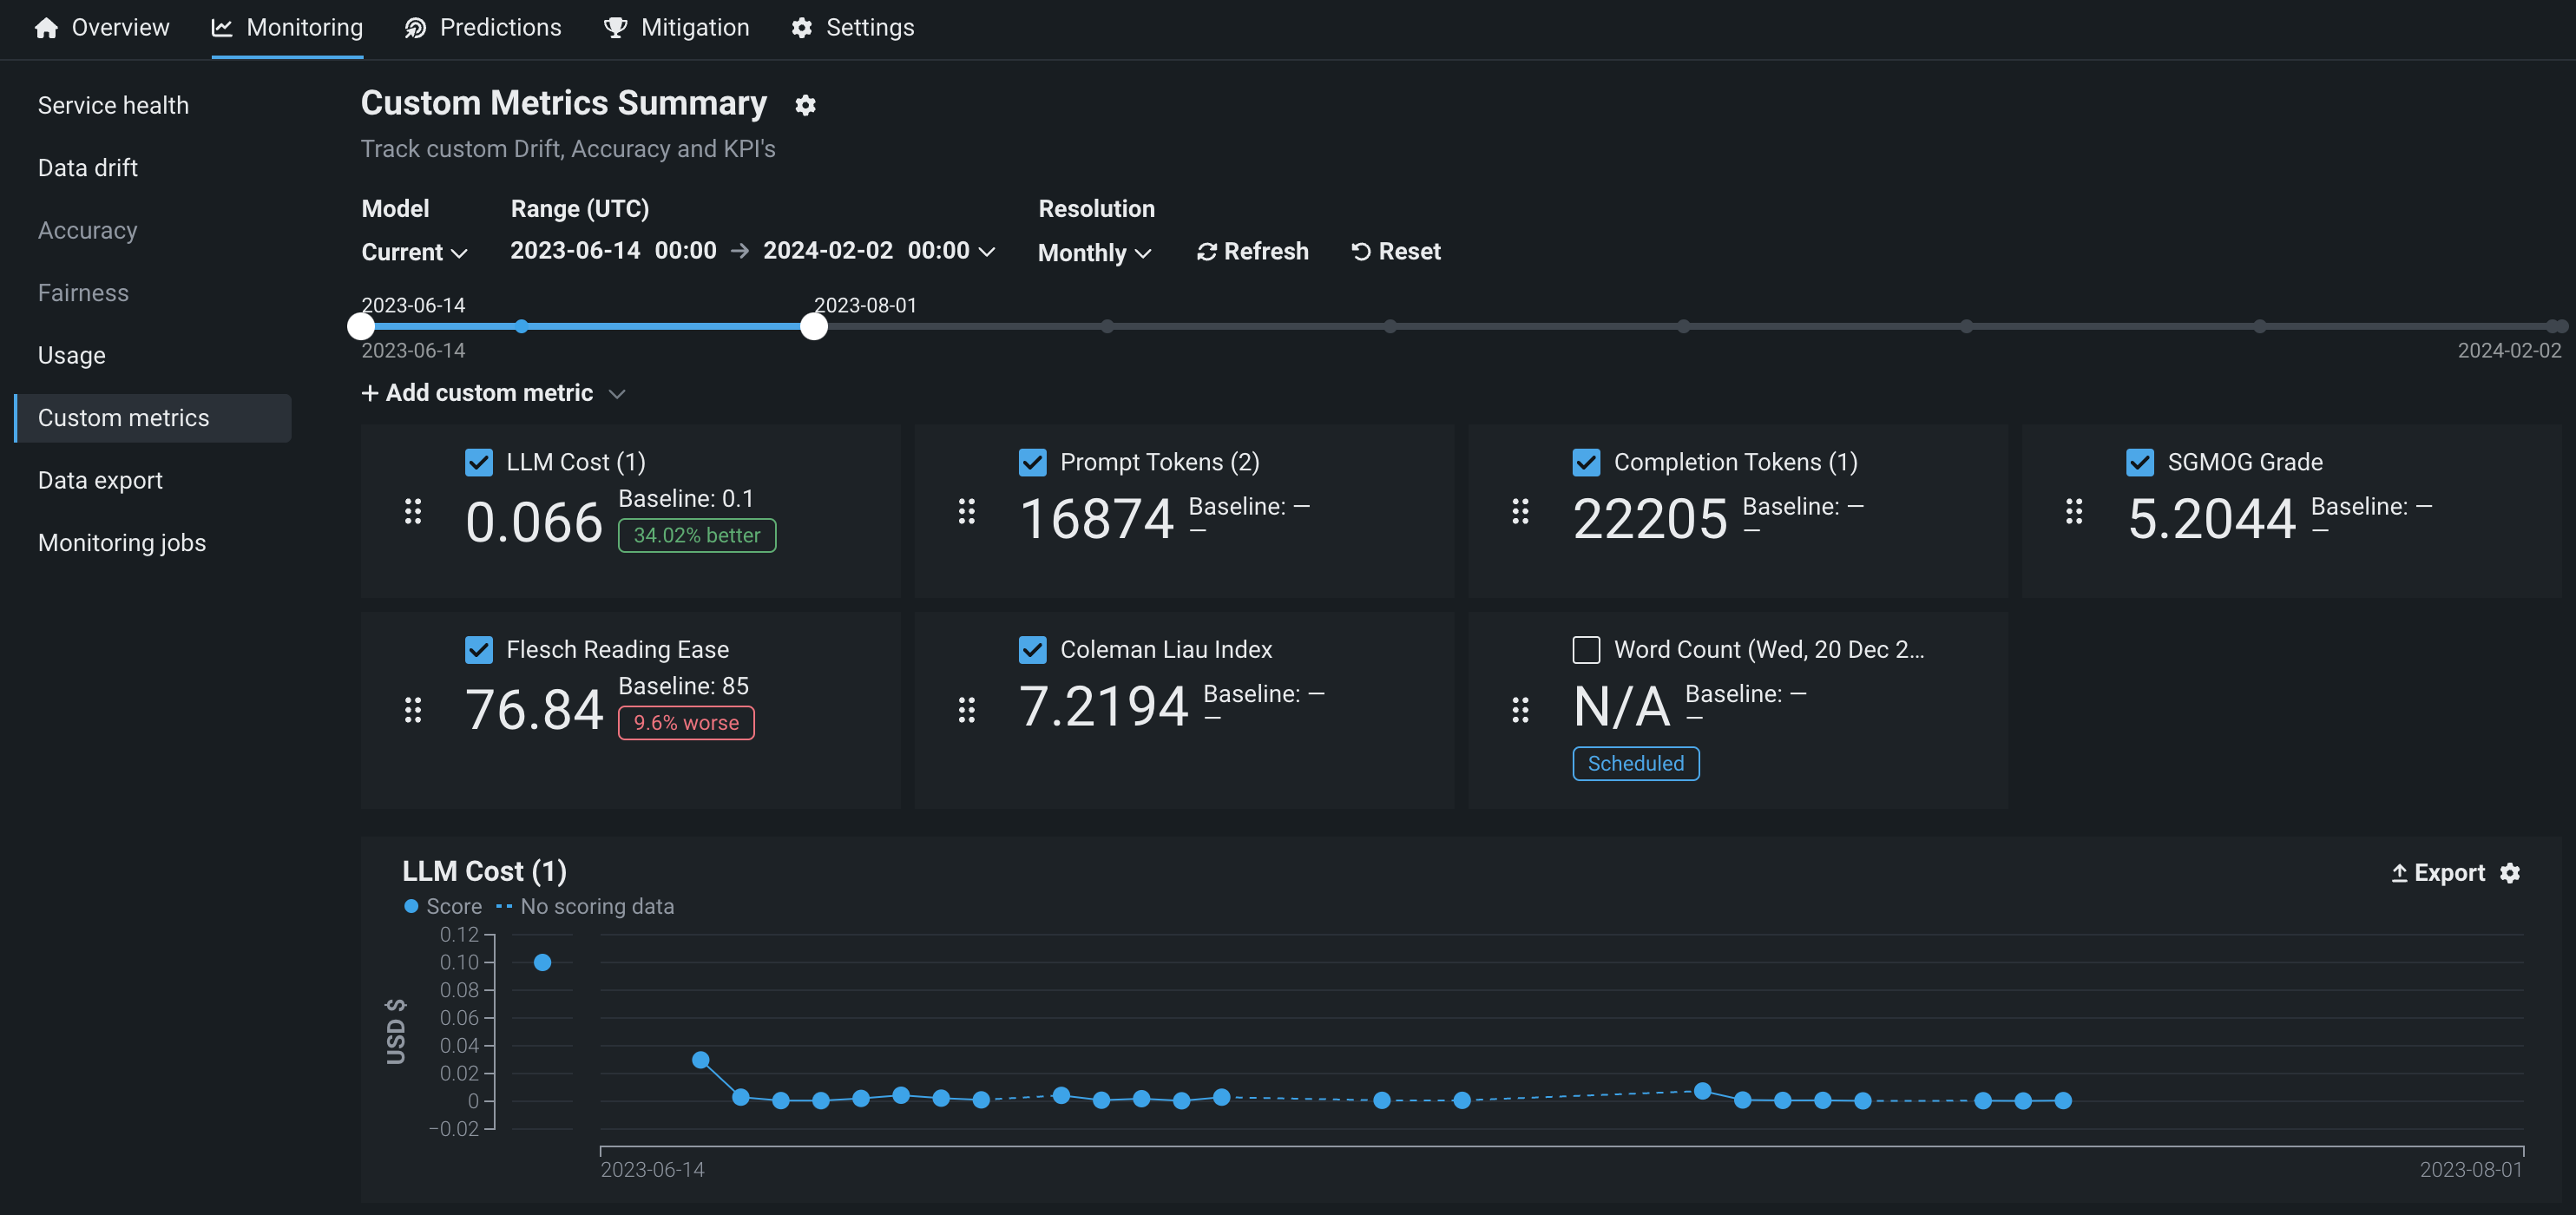
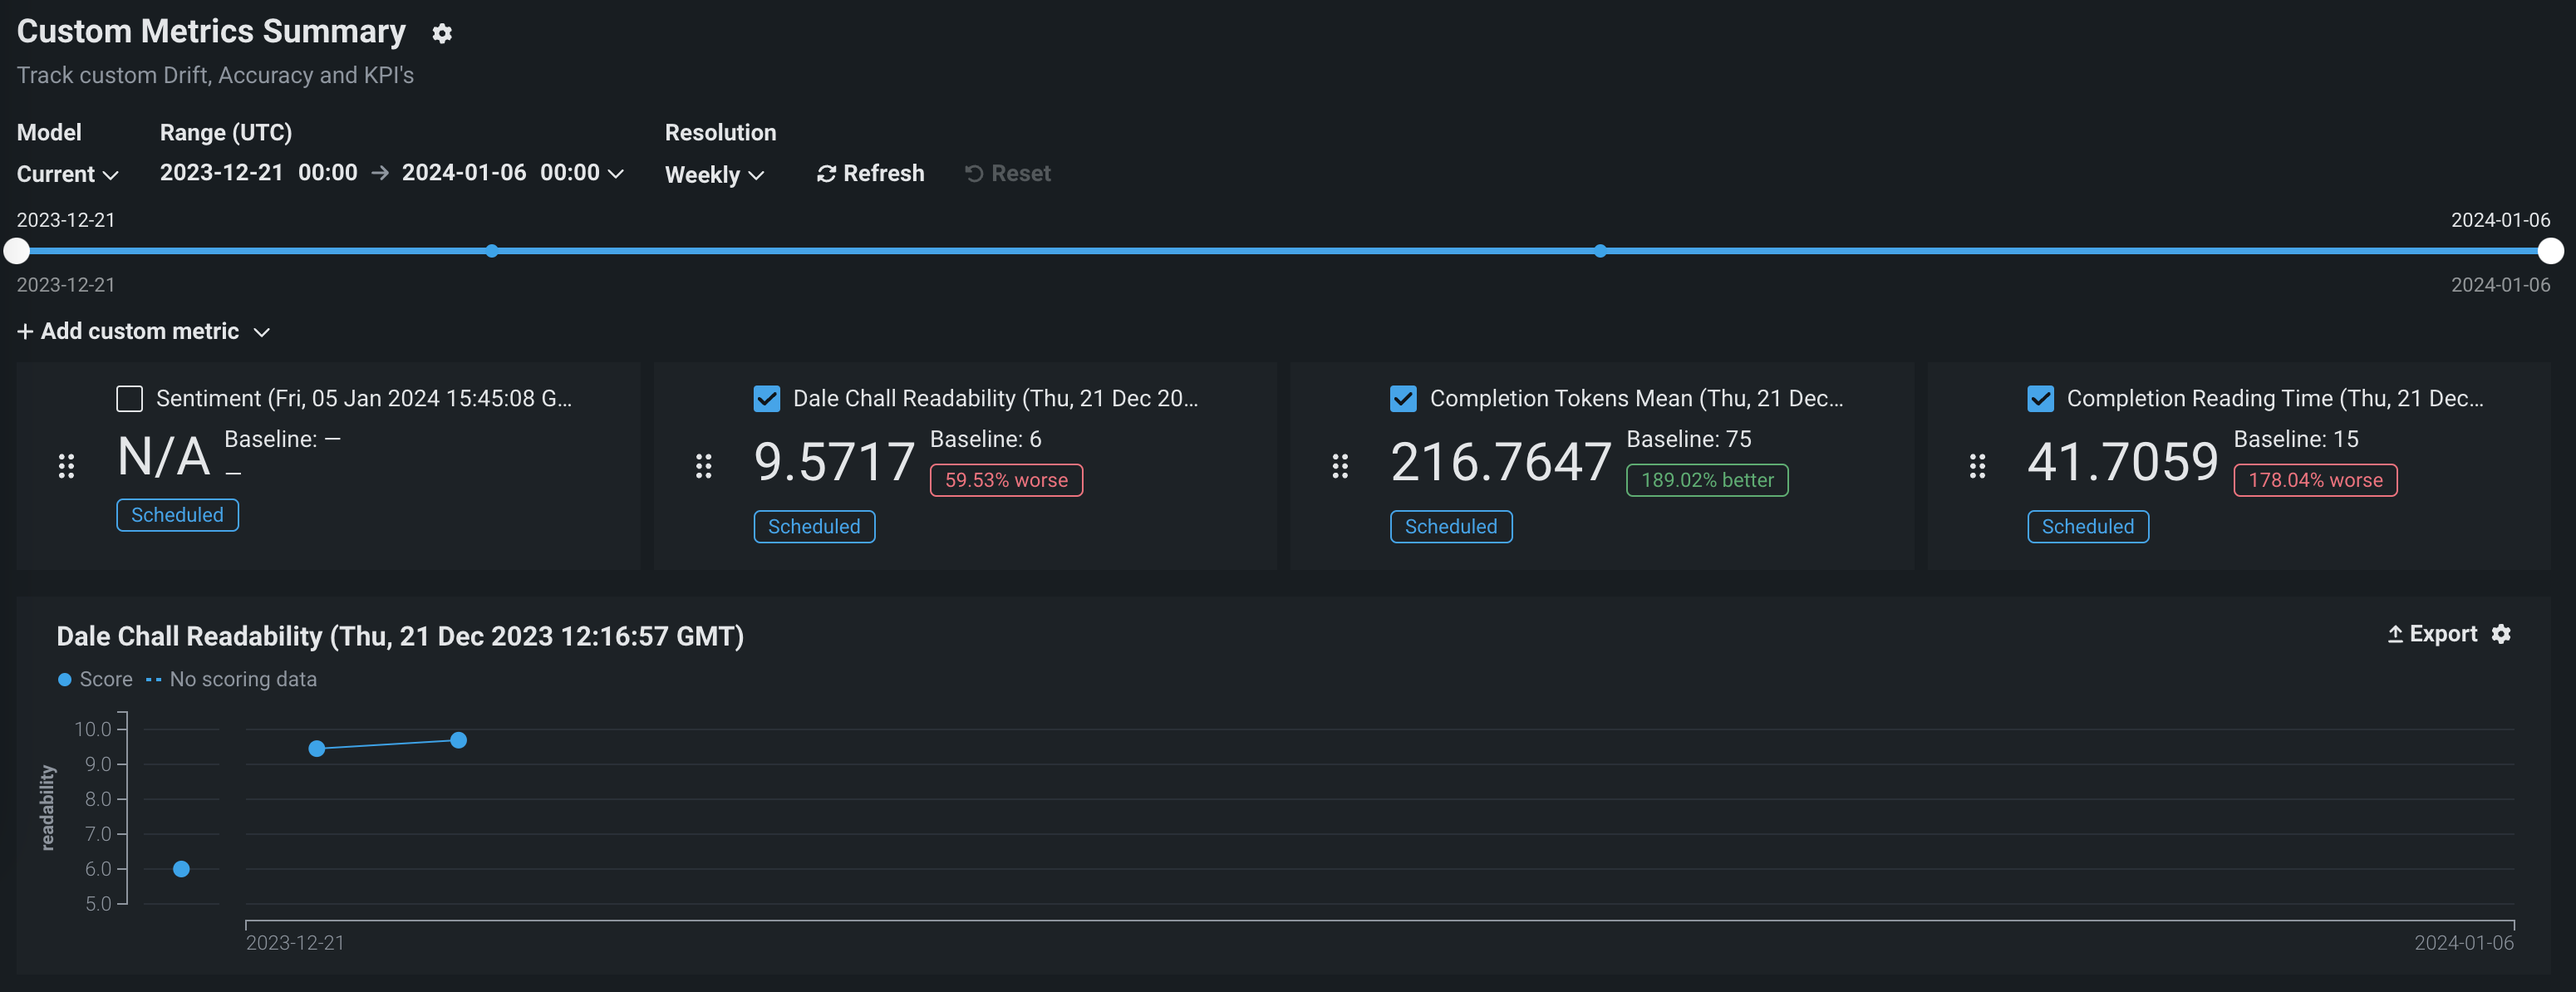
Configure the custom metric dashboard display settings
Configure the following settings to specify the custom metric calculations you want to view on the dashboard:
Custom metrics for evaluation and moderation require an association ID
For the metrics added when you configure evaluations and moderations, to view data on the Custom metrics tab, ensure that you set an association ID and enable prediction storage before you start making predictions through the deployed LLM. If you don't set an association ID and provide association IDs alongside the LLM's predictions, the metrics for the moderations won't be calculated on the Custom metrics tab. After you define the association ID, you can enable automatic association ID generation to ensure these metrics appear on the Custom metrics tab. You can enable this setting during or after deployment.
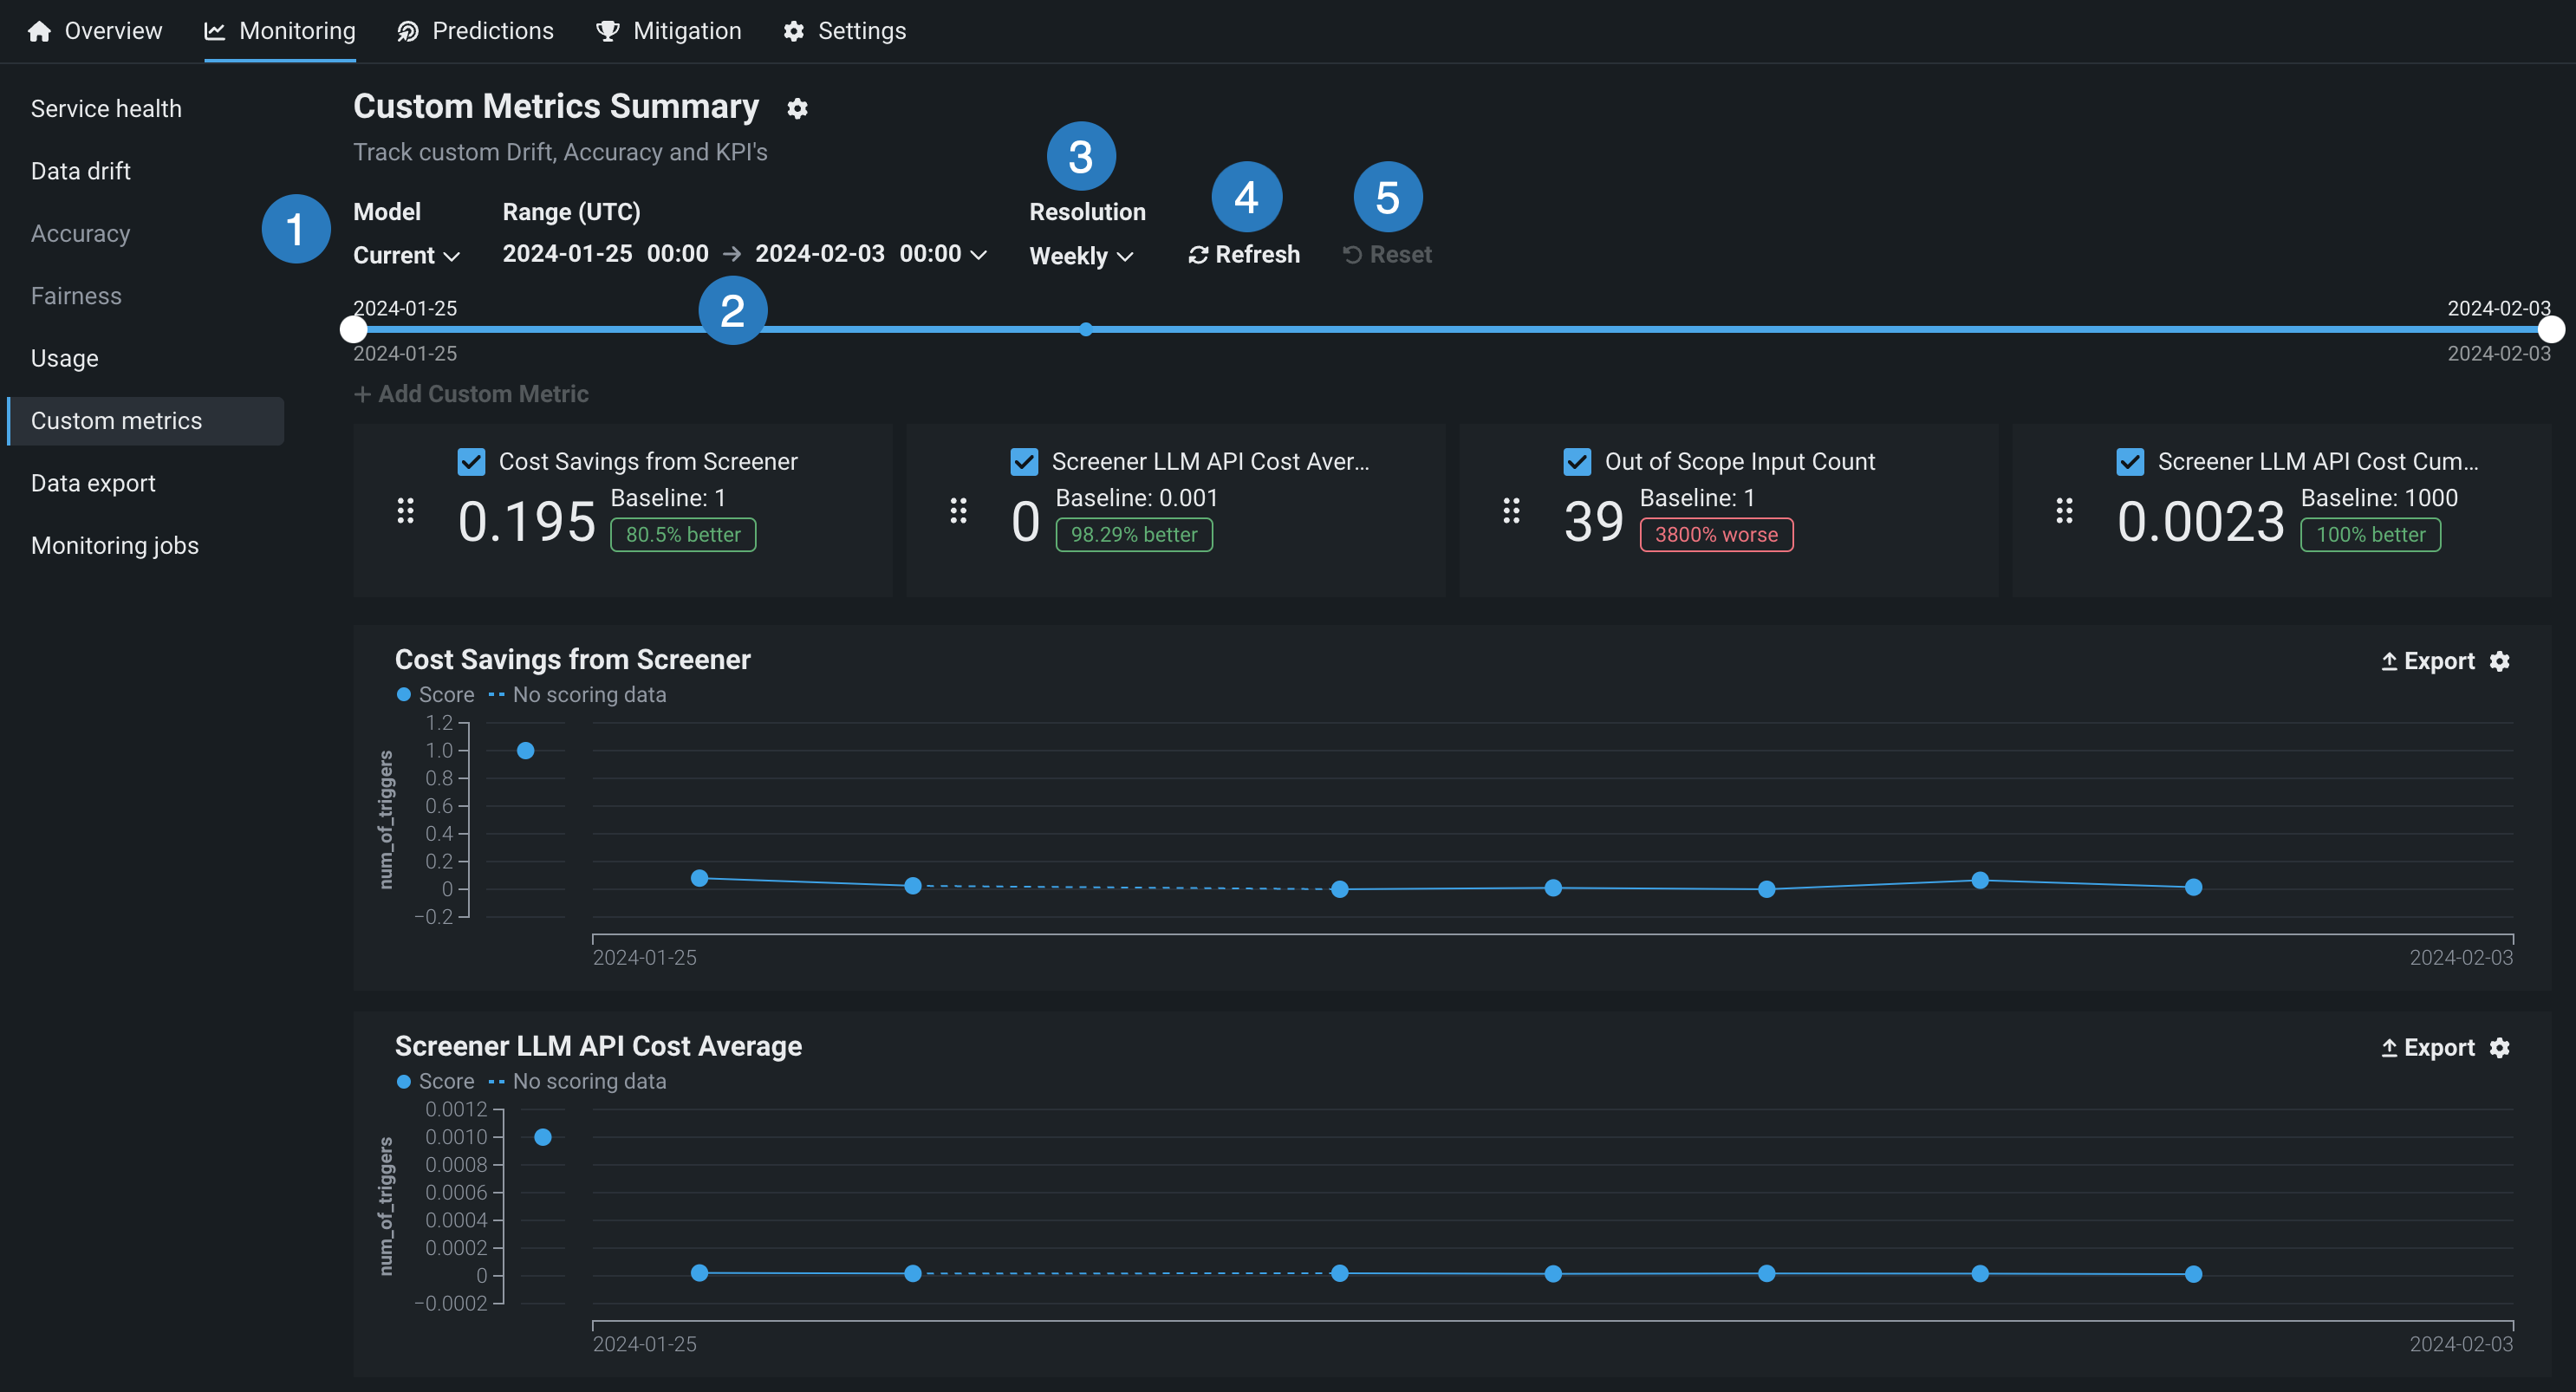
| Setting | Description | |
|---|---|---|
| 1 | Model | Select the deployment's model, current or previous, to show custom metrics for. |
| 2 | Range (UTC) / Date Slider | Select the start and end dates of the period from which you want to view custom metrics. |
| 3 | Resolution | Select the granularity of the date slider. Select from hourly, daily, weekly, and monthly granularity based on the time range selected. If the time range is longer than 7 days, hourly granularity is not available. |
| 4 | Segment attribute / Segment value | Sets the individual attribute and value to filter the data drift visualizations for segment analysis. |
| 5 | Refresh | Refresh the custom metric dashboard. |
| 6 | Reset | Reset the custom metric dashboard's display settings to the default. |
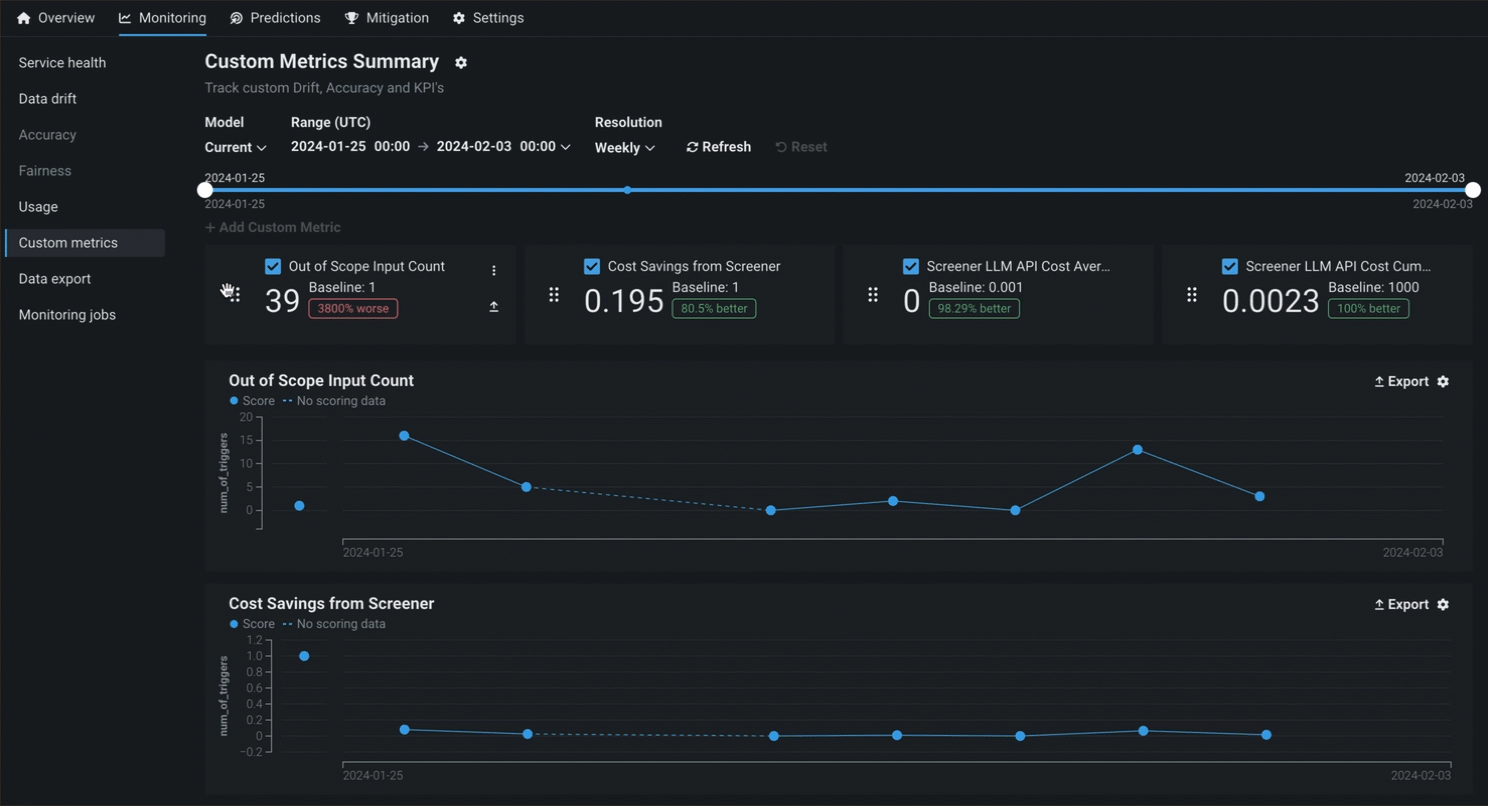
Arrange or hide metrics on the dashboard
To arrange or hide metrics on the Custom metrics summary dashboard, locate the custom metric you want to move or hide:
-
To move a metric, click the grid icon on the left side of the metric tile and then drag the metric to a new location.
-
To hide a metric chart, clear the checkbox next to the metric name.
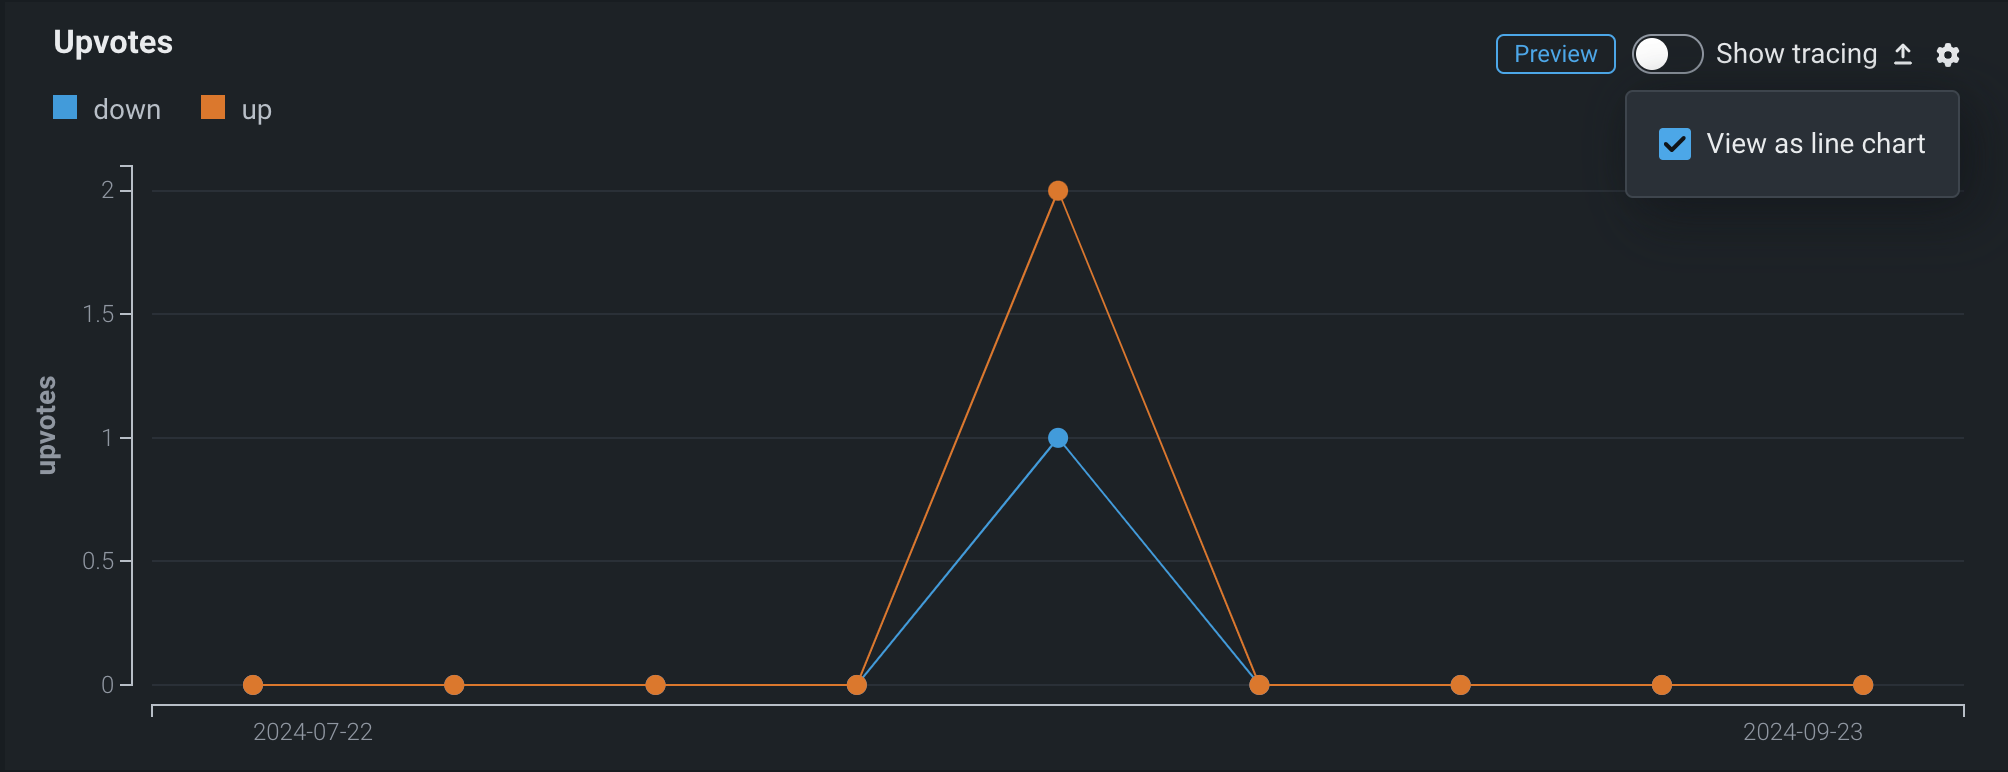
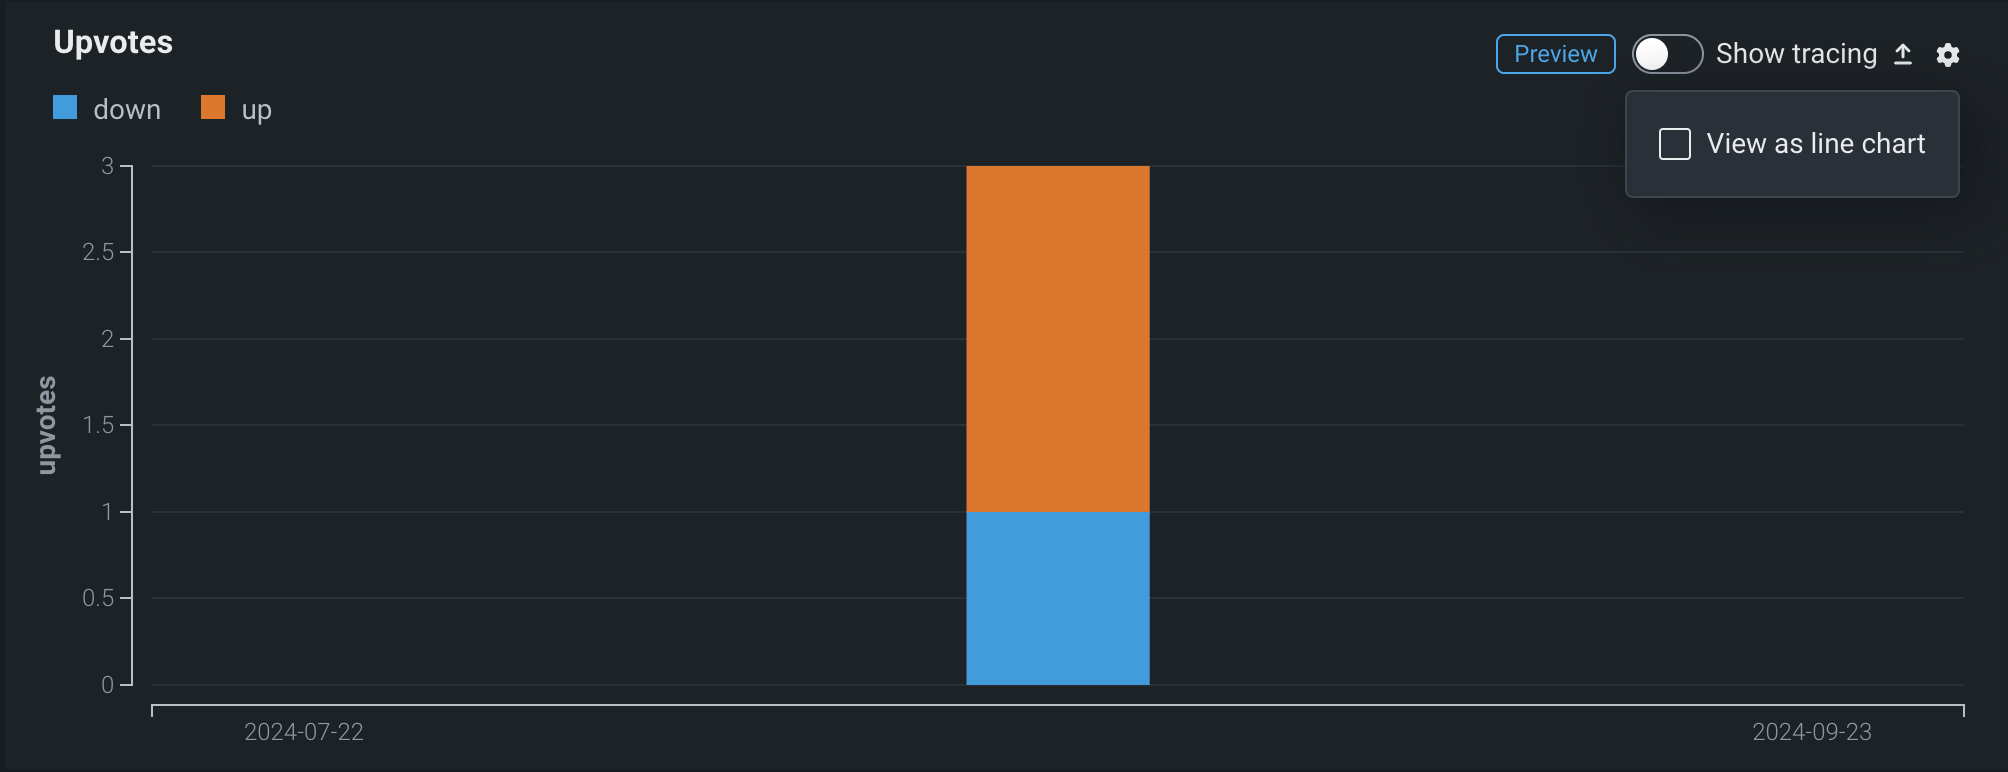
Select chart type for categorical metrics
If you added a categorical external custom metric, the metric chart on the Custom metrics summary dashboard is viewable as a line chart or a bar chart. To change the chart view, click the settings icon in the upper-right corner of the plot area, and then select (or clear) the View as line chart checkbox:
Select chart type for geospatial metrics
Premium
Geospatial monitoring is a premium feature. Contact your DataRobot representative or administrator for information on enabling the feature.
Geospatial feature monitoring support
Geospatial feature monitoring is supported for binary classification, multiclass, regression, and location target types.
If you added a geospatial metric, the metric chart on the Custom metrics summary dashboard is viewable as a standard chart or a geospatial chart (overlaid on a map). To change the view, click Show geospatial chart in the upper-right corner of the plot area:

Explore deployment data tracing
Premium
Tracing is a premium feature. Contact your DataRobot representative or administrator for information on enabling this feature.
On the Custom metrics tab of a custom or external model deployment, in a custom metric chart's header, click Show tracing to view tracing data for the deployment.
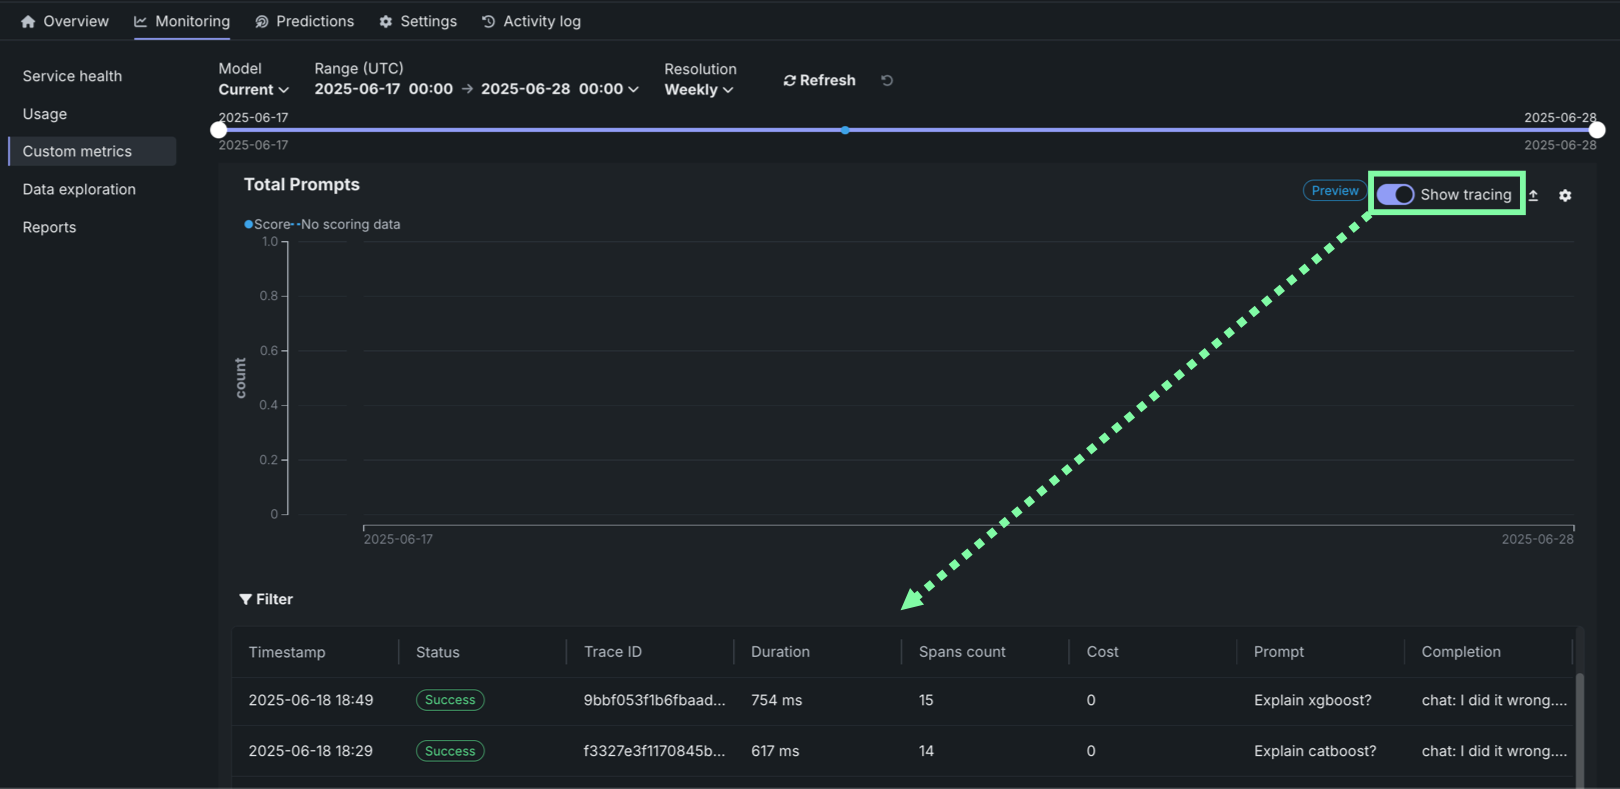
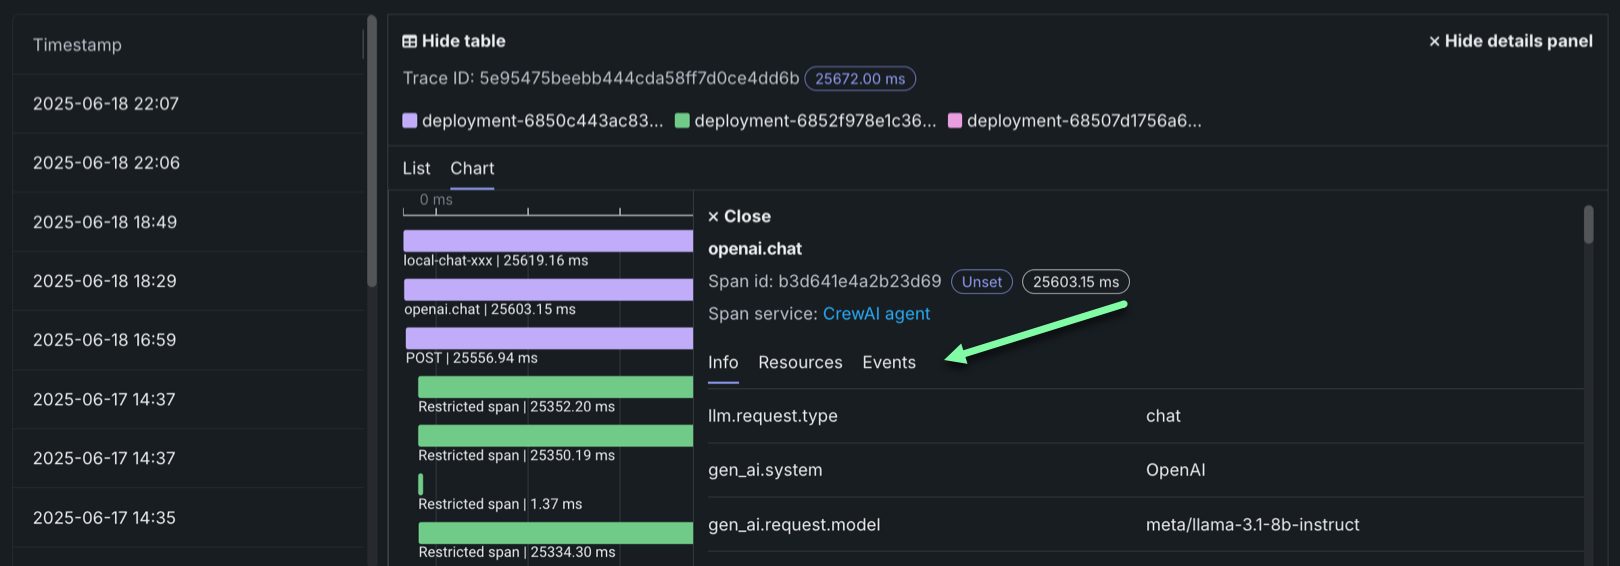
Traces represent the path taken by a request to a model or agentic workflow. DataRobot uses the OpenTelemetry framework for tracing. A trace follows the entire end-to-end path of a request, from origin to resolution. Each trace contains one or more spans, starting with the root span. The root span represents the entire path of the request and contains a child span for each individual step in the process. The root (or parent) span and each child span share the same Trace ID.
Access and retention
The tracing table is available for all custom and external model deployments.
Retention is configured at the organization level by a system administrator and applies to all users in the organization. If a policy isn't set explicitly, trial organizations use a 14-day policy and paying organizations use a 30-day policy. Administrators can set retention per signal type (traces, logs, or metrics) to 14, 30, 60, 90, 180, or 360 days.
To view or change your organization's retention settings, see Configure OTel retention.
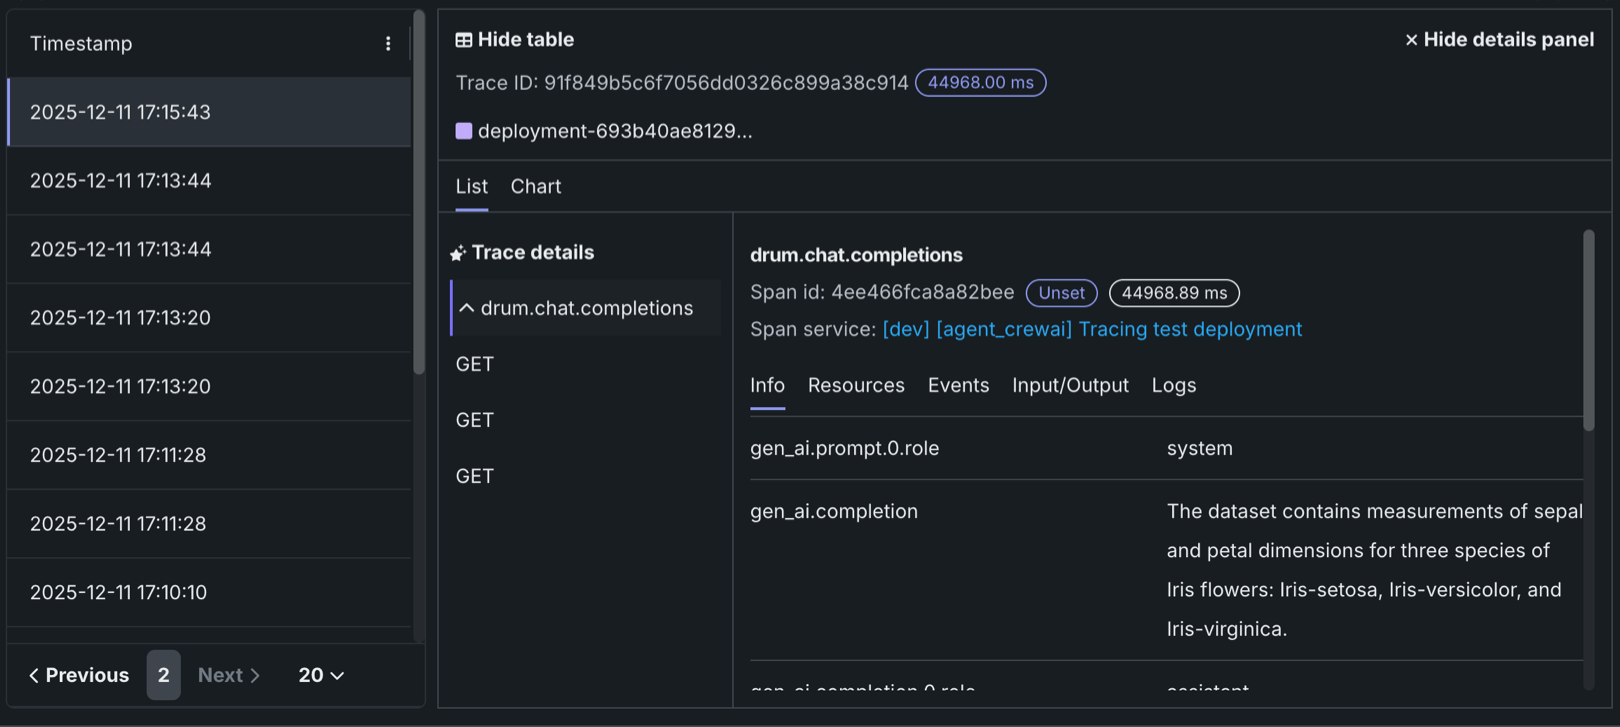
In the Tracing table, you can review the following fields related to each trace:
| Column | Description |
|---|---|
| Timestamp | The date and time of the trace in YYYY-MM-DD HH:MM format. |
| Status | The overall status of the trace, including all spans. The Status will be Error if any dependent task fails. |
| Trace ID | A unique identifier for the trace. |
| Duration | The amount of time, in milliseconds, it took for the trace to complete. This value is equal to the duration of the root span (rounded) and includes all actions represented by child spans. |
| Spans count | The number of completed spans (actions) included in the trace. |
| Cost | If cost data is provided, the total cost of the trace. |
| Prompt | The user prompt related to the trace. |
| Completion | The agent or model response (completion) associated with the prompt for the trace. |
| Tools | The tool or tools called during the request represented by the trace. |
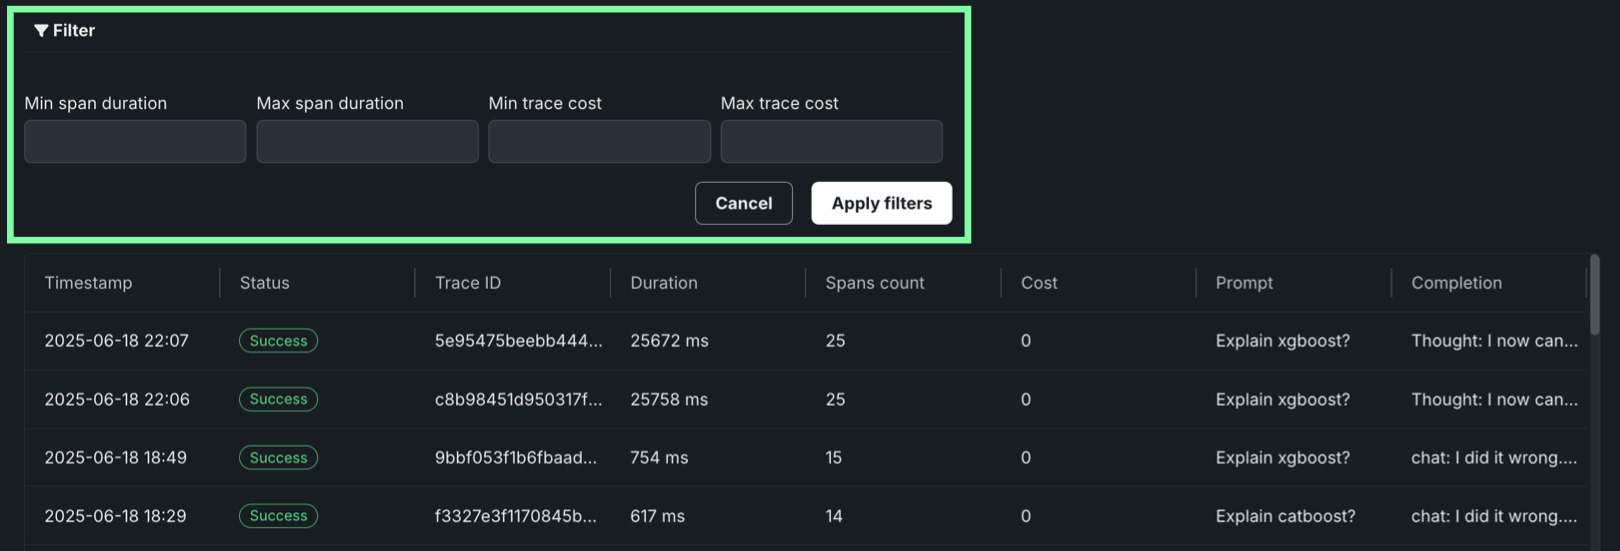
Click Filter to filter by Min span duration, Max span duration, Min trace cost, and Max trace cost. The unit for span filters is nanoseconds (ns), the chart displays spans in milliseconds (ms).
Filter accessibility
The Filter button is hidden when a span is expanded to detail view. To return to the chart view with the filter, click Hide details panel.
To review the spans contained in a trace, along with trace details, click a trace row in the Tracing table. The span colors correspond to a Span service, usually a deployment. Restricted span appears when you don’t have access to the deployment or service associated with the span. You can view spans in Chart format or List format.
Span detail controls
From either view, you can click Hide table to collapse the Timestamps table or Hide details panel to return to the expanded Tracing table view.
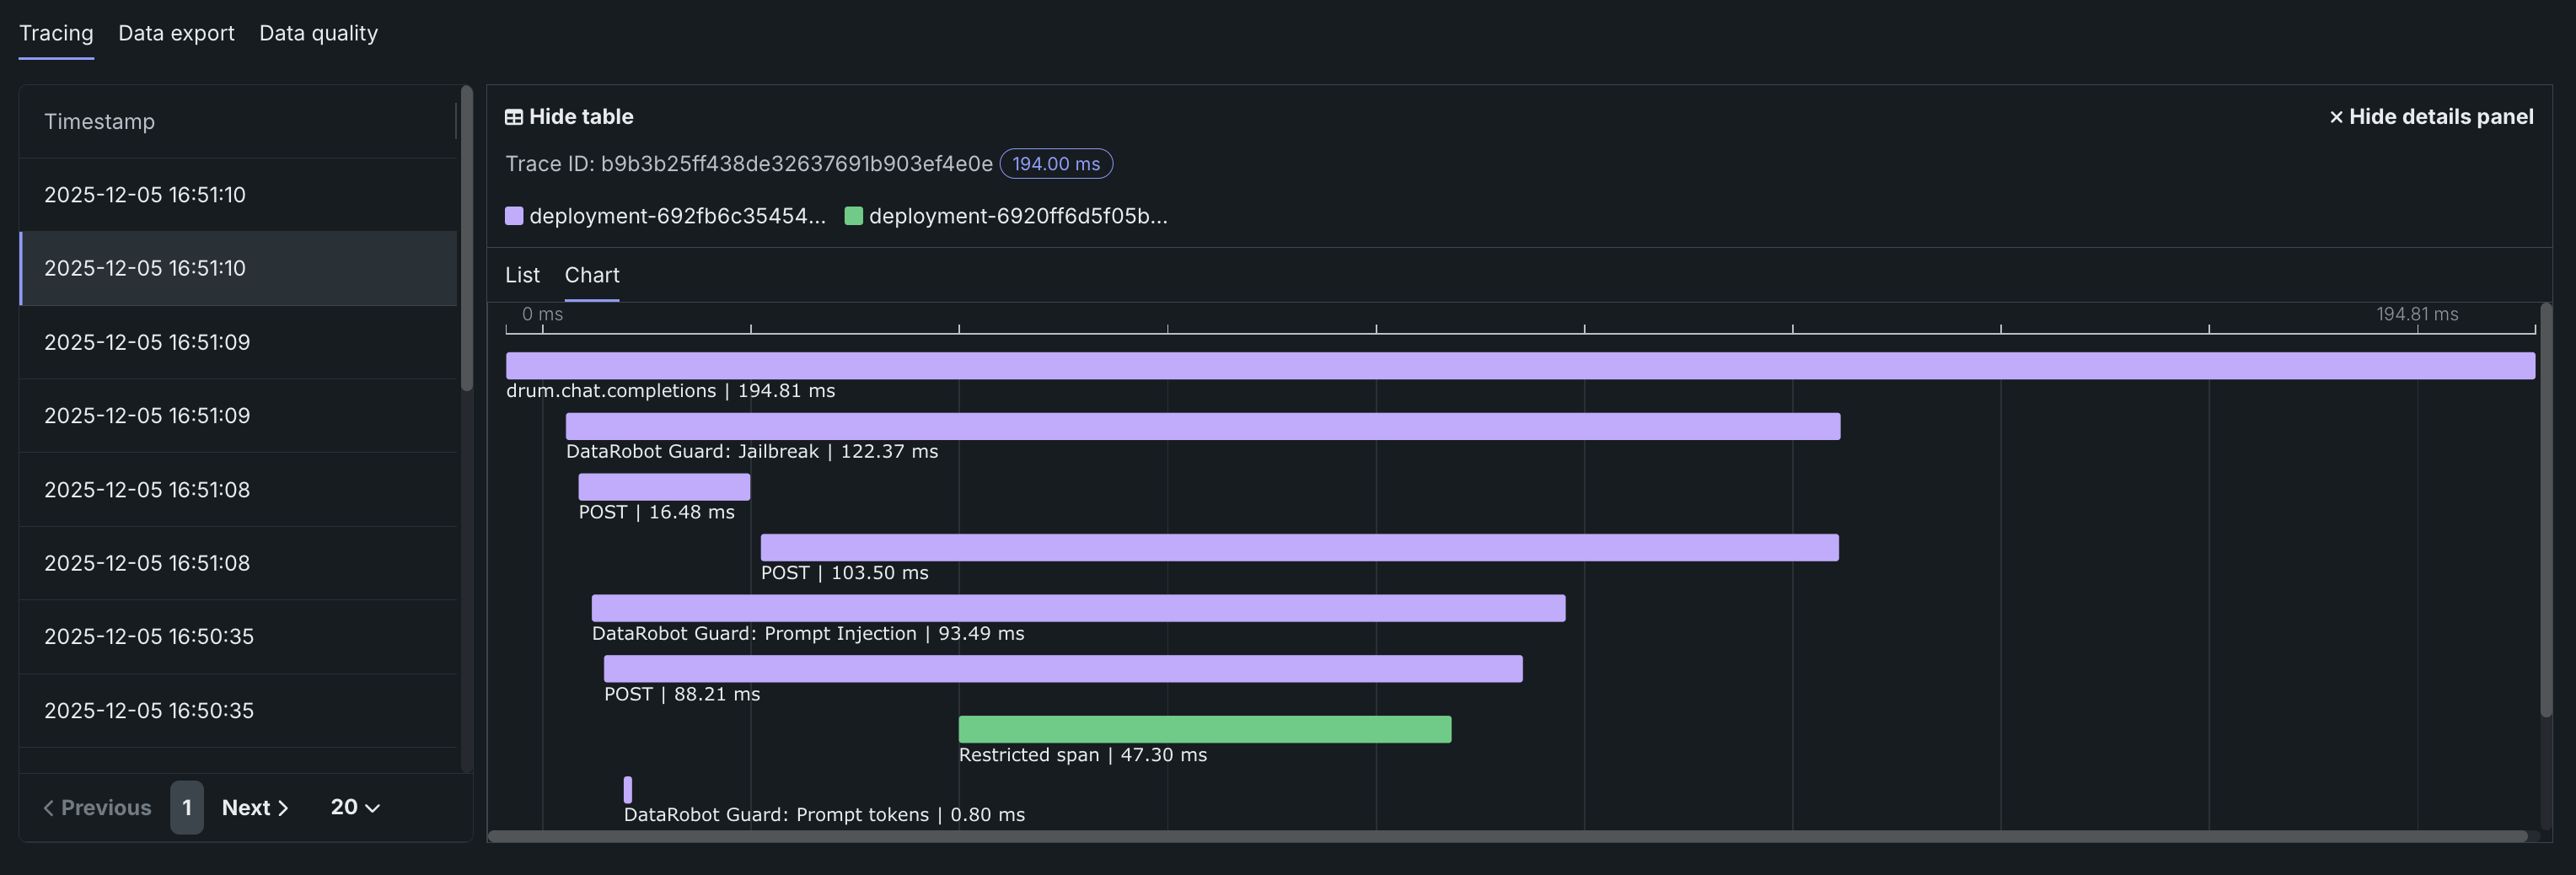
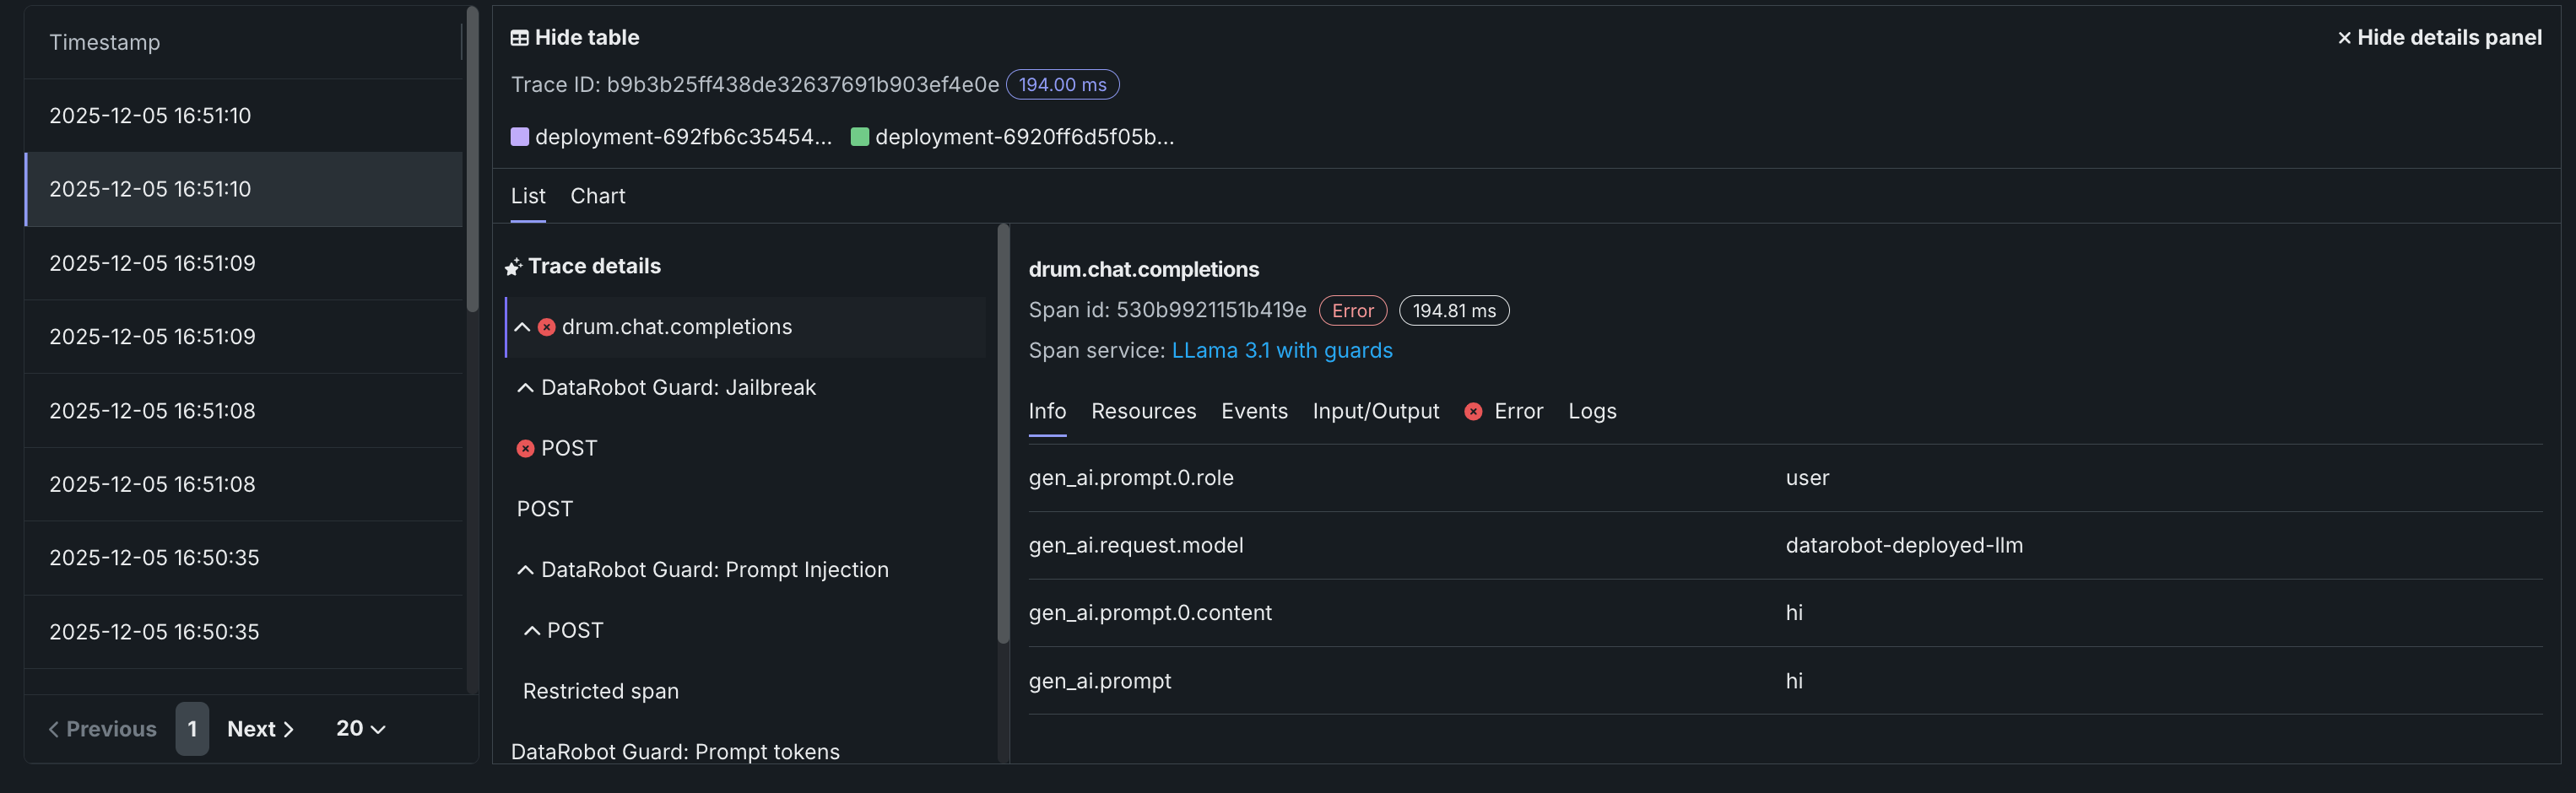
Trace details
In list view, you can click Trace details to view the Input/Output (Prompt and Completion) and Evaluation details about the trace associated with the current span.
For either view, click the Span service name to access the deployment or resource (if you have access). Additional information, dependent on the configuration of the generative AI model or agentic workflow, is available on the Info, Resources, Events, Input/Output, Error, and Logs tabs. The Error tab only appears when an error occurs in a trace.
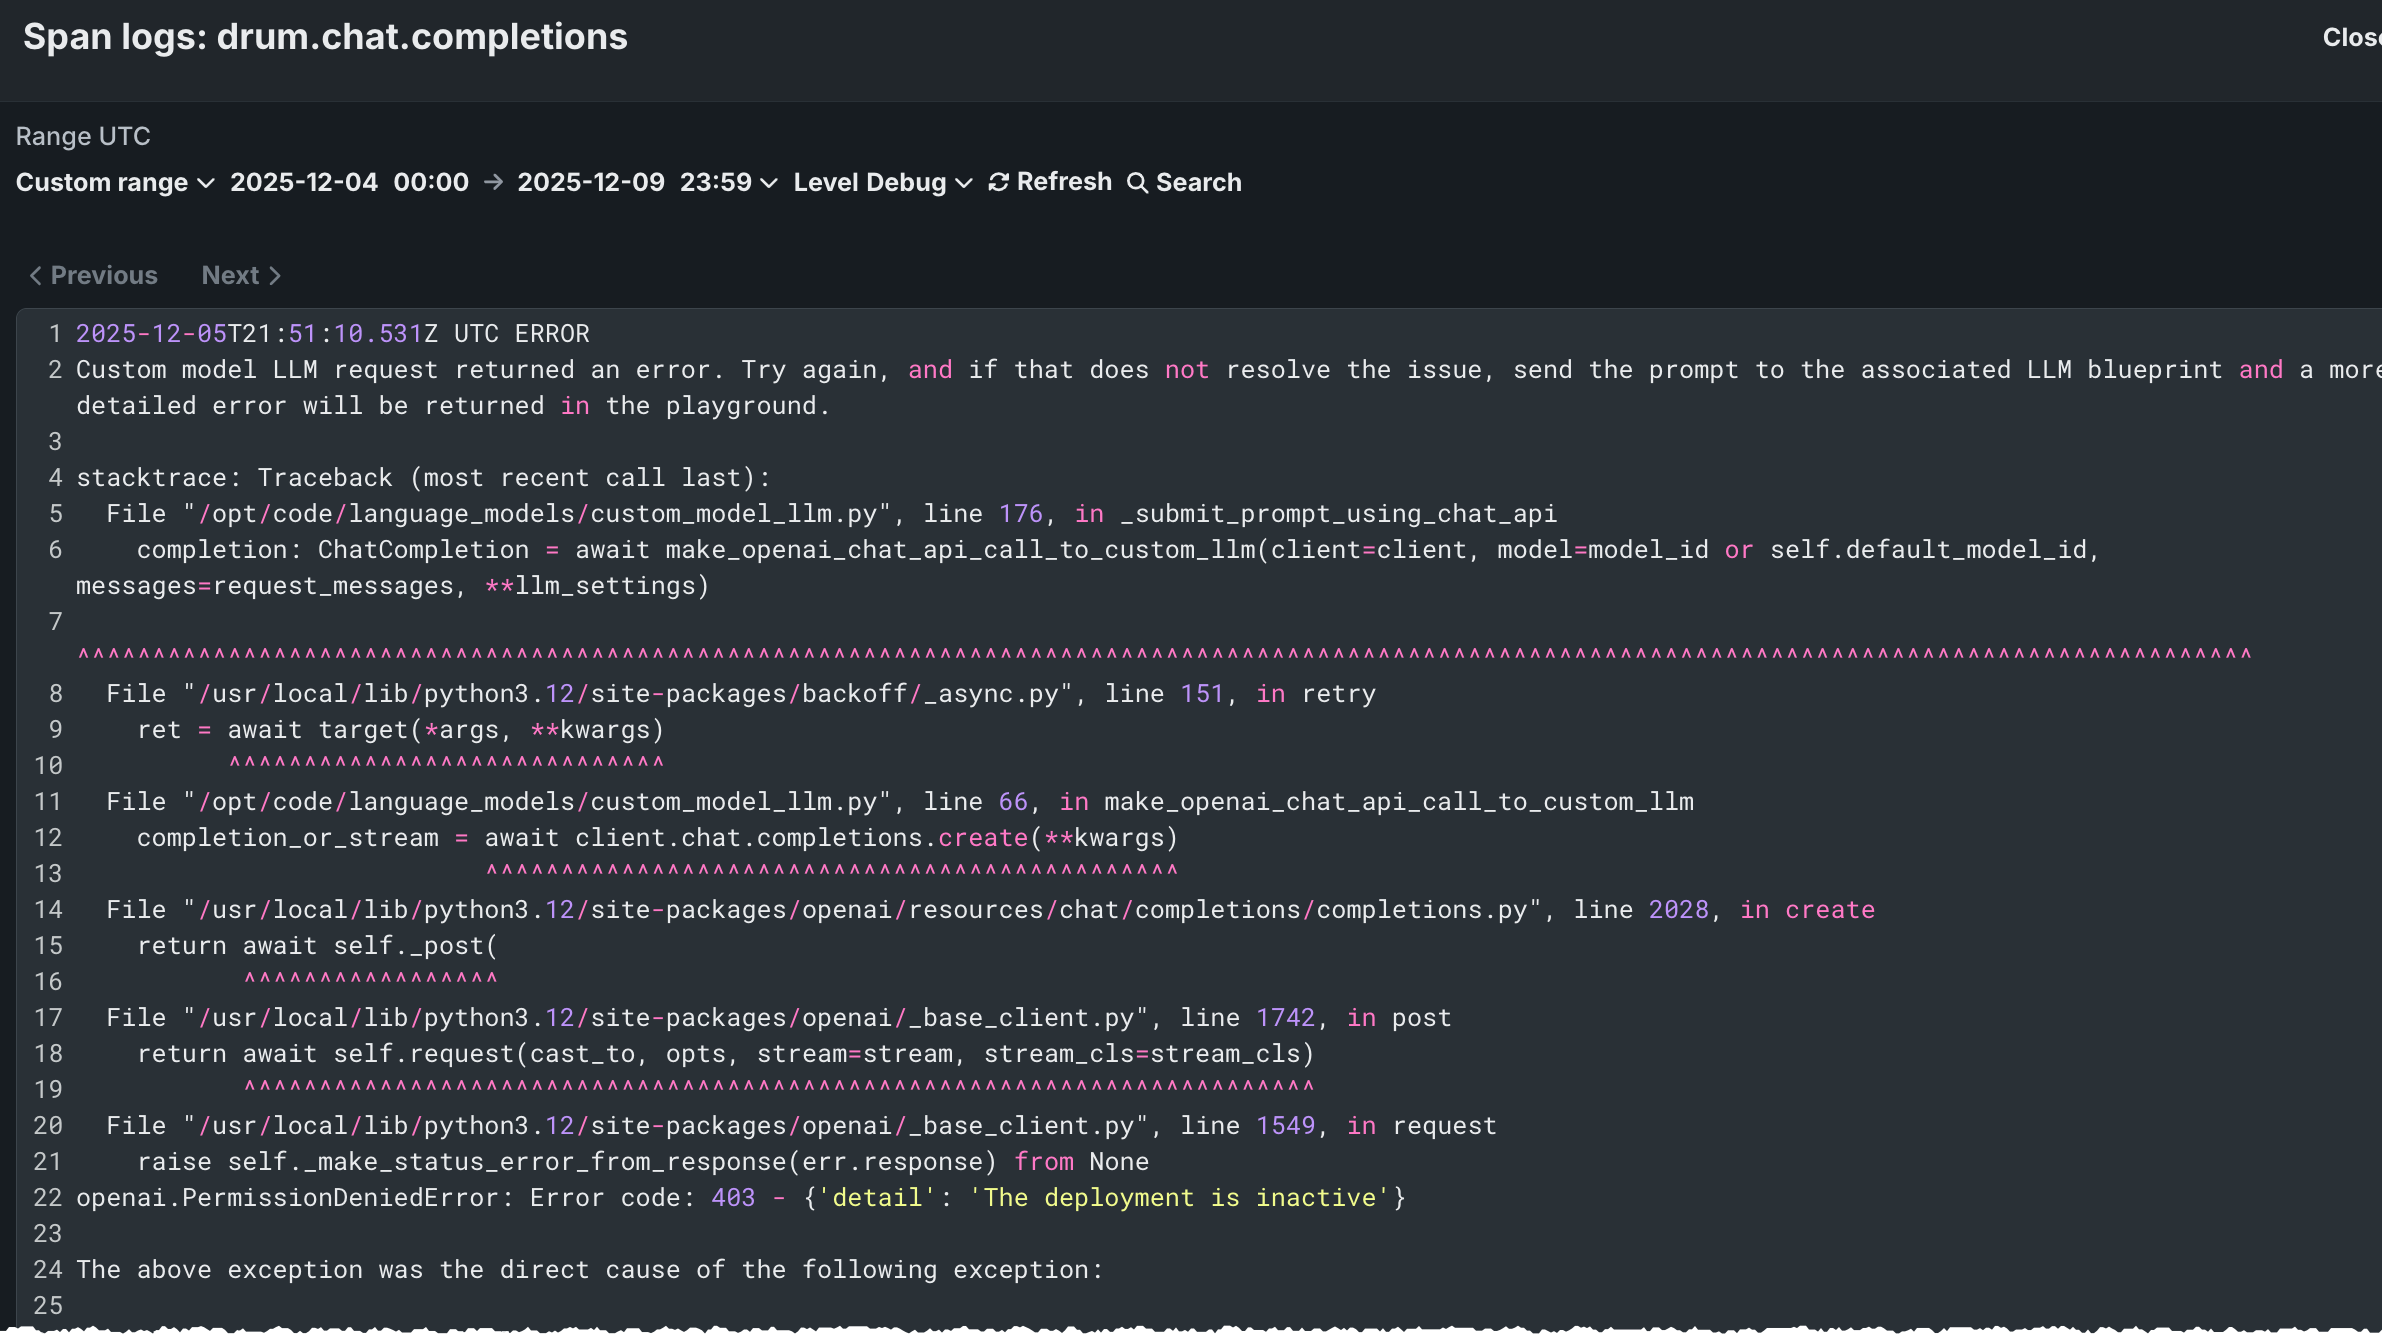
Filter tracing logs
From the list view, you can display OTel logs for a span. The results shown are a subset of the full deployment logs, and are accessed as follows:
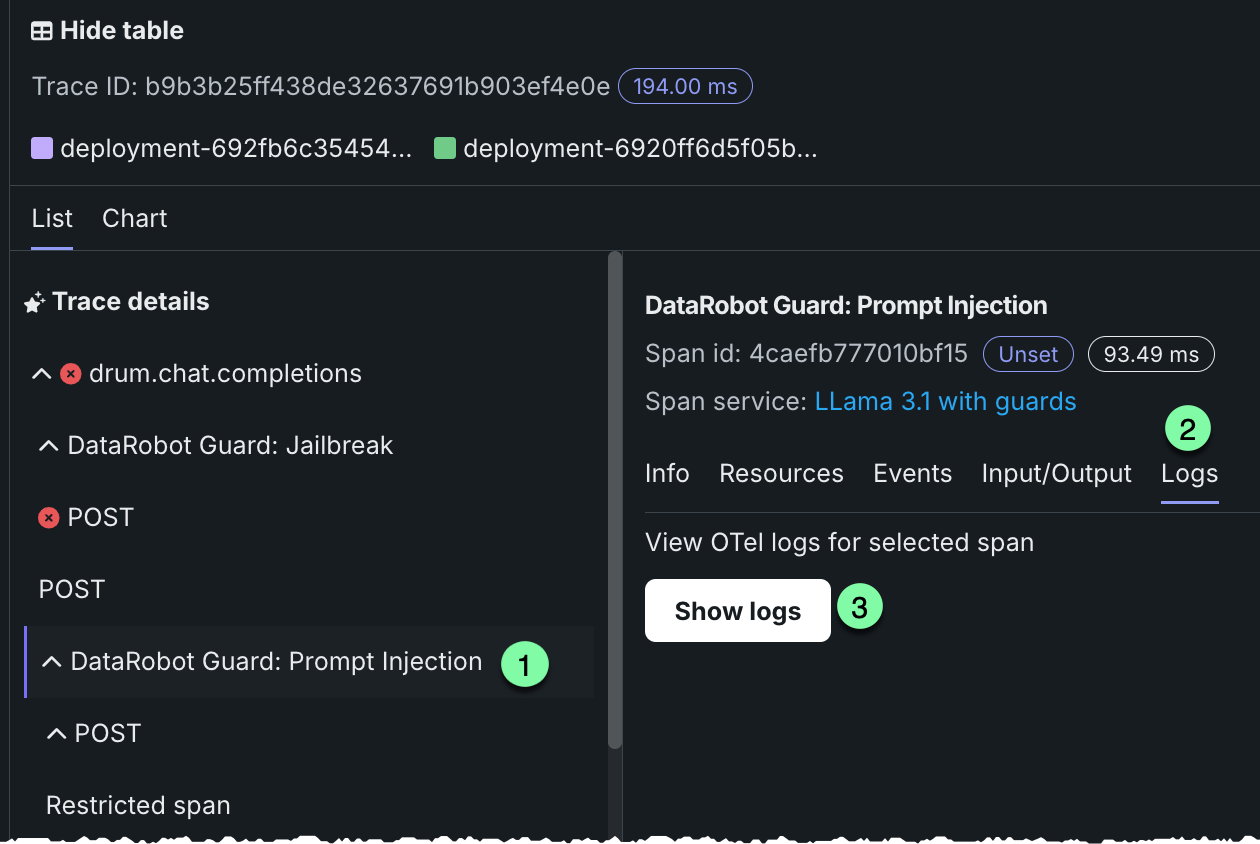
-
Open the list view and select a span under Trace details.
-
Click the Logs tab.
-
Click Show logs.
Tracing table OTel attributes
For Cost, Prompt, Completion, and Tools, DataRobot reads specific span attributes across all spans that belong to the trace. Other columns (such as Timestamp and Duration) come from trace and span metadata rather than these attributes.
| Column | OpenTelemetry mapping |
|---|---|
| Cost | Sums numeric values from the datarobot.moderation.cost attribute on spans in the trace (when that attribute is present). |
| Prompt | Uses the gen_ai.prompt attribute. If more than one span includes gen_ai.prompt, the first value encountered in trace order is shown. |
| Completion | Uses the gen_ai.completion attribute. If more than one span includes gen_ai.completion, the last value encountered in trace order is shown. |
| Tools | Collects every distinct value of the tool_name attribute found on spans in the trace and lists those tool names in the column. |
Attribute keys must match exactly (including the underscore in gen_ai). Names such as genai.prompt or GenAI.prompt are not read for the Prompt and Completion columns.
Automatic instrumentation (including DataRobot agent templates) often sets gen_ai.prompt, gen_ai.completion, and sometimes tool_name. For custom or external models, frameworks differ: tool execution may not emit tool_name even when tools run (for example, some LangGraph callback flows). In that case Prompt and Completion can populate while Tools remains empty until tool_name is configured on a span that runs inside the tool—see Implement tracing.