Agent events
On a deployment's Activity log > Agent events tab, you can view Management events (e.g., deployment actions) and Monitoring events (e.g., spooler channel and rate limit events). Monitoring events can help you quickly diagnose MLOps agent issues. The spooler channel error events can help you diagnose and fix spooler configuration issues. The rate limit enforcement events can help you identify if service health stats, data drift values, or accuracy values aren't updating because you exceeded the API request rate limit.
To view the agent events log, navigate to the Activity log > Agent events tab. The most recent events appear at the top of the list.
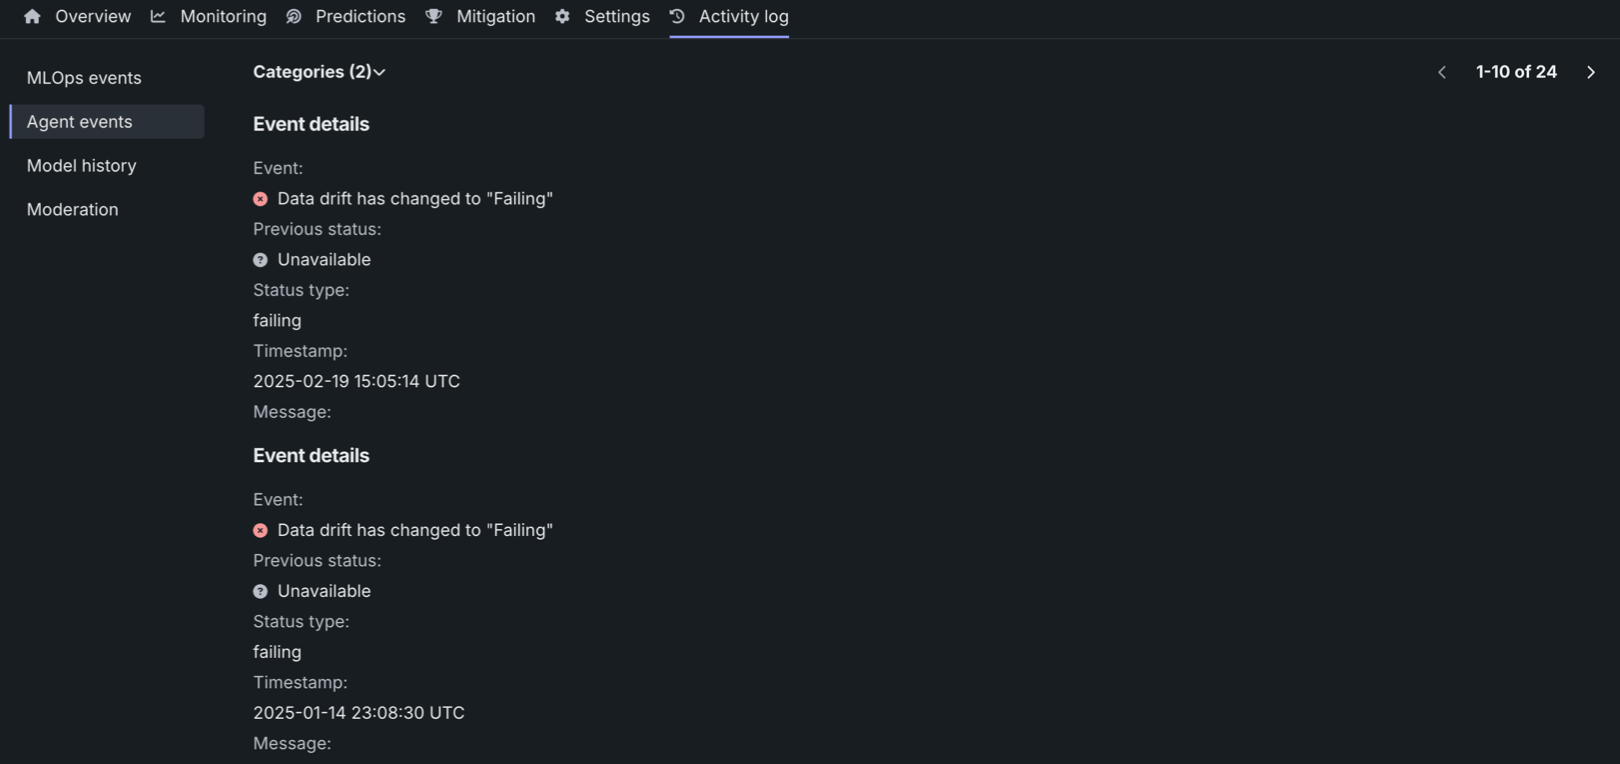
Each event shows the time it occurred, a description, and an icon indicating its status:
| Status icon | Description |
|---|---|
| Green / Passing | No action needed. |
| Yellow / At risk | Concerns found, but no immediate action needed; continue monitoring. |
| Red / Failing | Immediate action needed. |
| Gray / Informational | Details a deployment action (e.g., deployment launch has started). |
| Gray / Unknown | Unknown. |
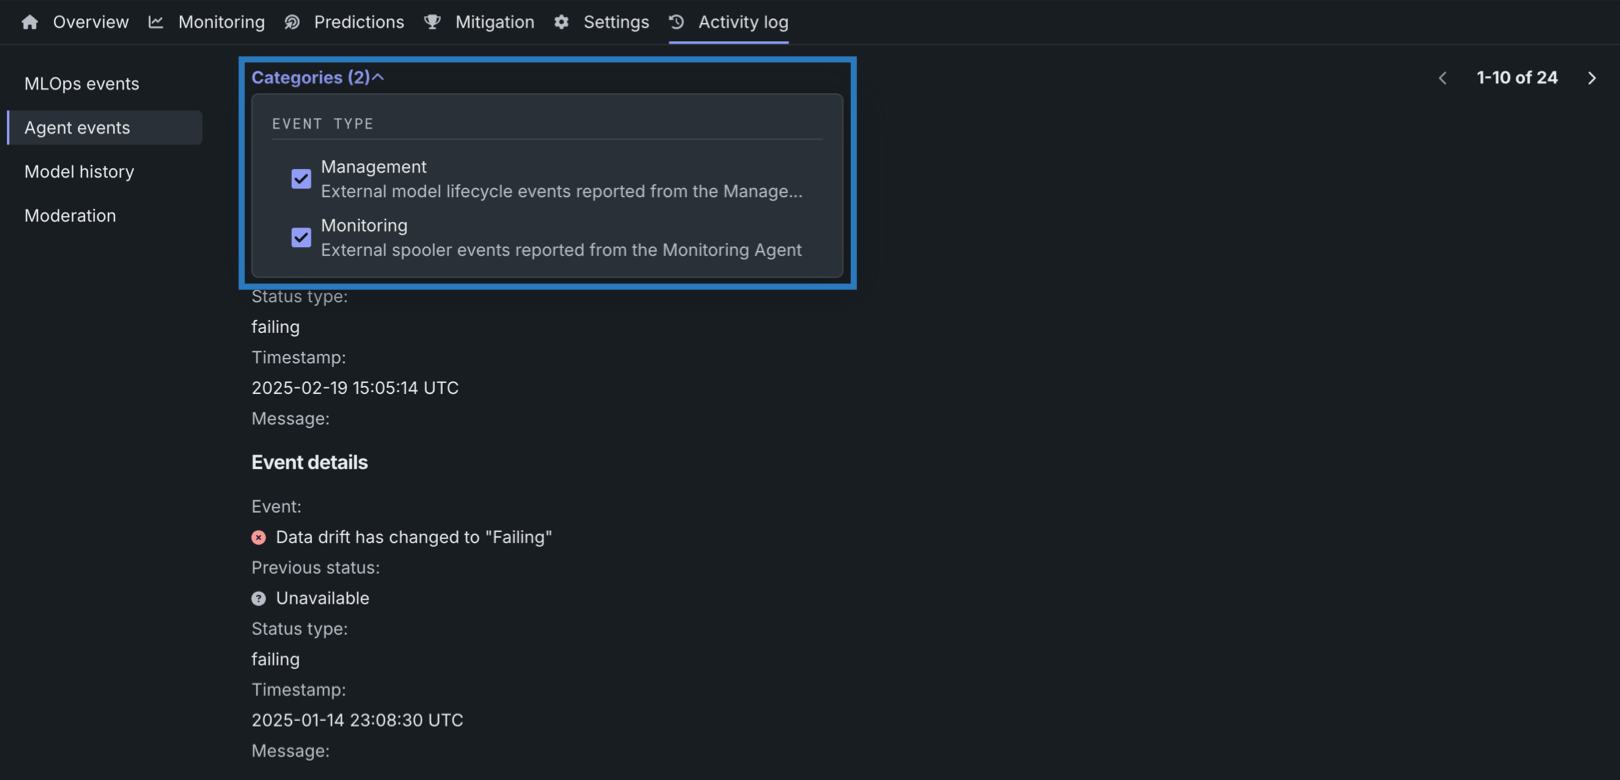
To interact with the Agent events log, configure the Categories filter to limit the list to Management events (e.g., deployment actions) or Monitoring events (e.g., spooler channel and rate limit events).
Management events
Management events represent deployment actions and can help you review the status of your deployment and the health of the management agent. Currently, the following events can appear as management events:
| Event type | Description |
|---|---|
| Deployment launch | Reports deployment launch status, notifying you when launch starts and if it succeeds or fails. |
| Deployment shutdown | Reports deployment shutdown status, notifying you when shutdown starts and if it succeeds or fails. |
| Model replacement | Reports model replacement status, notifying you when replacement starts and if it succeeds or fails. |
| Prediction request | Reports model prediction status, notifying you if a prediction request fails. |
| Management agent health | Reports changes in the health of the management agent implementation for this deployment. |
| Service health has changed | Reports changes in the service health of the deployed model. |
| Data drift has changed | Reports changes in the data drift status of the deployed model. |
| Accuracy has changed | Reports changes in the accuracy status of the deployed model. |
Monitoring events
Monitoring events can help you diagnose and fix agent issues. Currently, the following events can appear as monitoring events:
| Event | Description |
|---|---|
| Monitoring spooler channel | Diagnose spooler configuration issues to troubleshoot them. |
| Rate limit was enforced | Identify when an operation exceeds API request rate limits, resulting in updates to service health stats, data drift calculations, or accuracy calculations stalling. This event reports how long the affected operation is suspended. Rate limits are applied per deployment, per operation. |
Rate limits for the deployments API
| Operation | Endpoint (POST) | Limit |
|---|---|---|
| Submit Metrics (Service Health) | api/v2/deployments/<id>/predictionRequests/fromJSON/ |
1M requests / hour |
| Submit Prediction Results (Data Drift) | api/v2/deployments/<id>/predictionInputs/fromJSON/ |
1M requests / hour |
| Submit Actuals (Accuracy) | api/v2/deployments/<id>/actuals/fromJSON/ |
40 requests / second |
Enable agent event log for external models
To view Monitoring events, you must provide a predictionEnvironmentID in the agent configuration file (conf\mlops.agent.conf.yaml) as shown below. If you haven't already installed and configured the MLOps agent, see the Installation and configuration guide.
MLOps Agent configuration file example
1 2 3 4 5 6 7 8 9 10 11 12 13 14 15 16 17 18 19 20 21 22 23 24 25 26 27 28 29 30 31 32 33 34 35 36 37 38 39 40 41 42 43 44 45 46 47 48 49 50 51 52 53 54 55 56 57 58 59 60 61 62 63 64 65 66 67 68 69 70 71 72 | |