Humility
After configuring humility rules on the Settings > Humility tab and making predictions with humility monitoring enabled, you can view the humility data collected over time for a deployment from the Monitoring > Humility tab. The X-axis measures the range of time that predictions have been made for the deployment. The Y-axis measures the number of times humility rules triggered in the given period.
View humility data
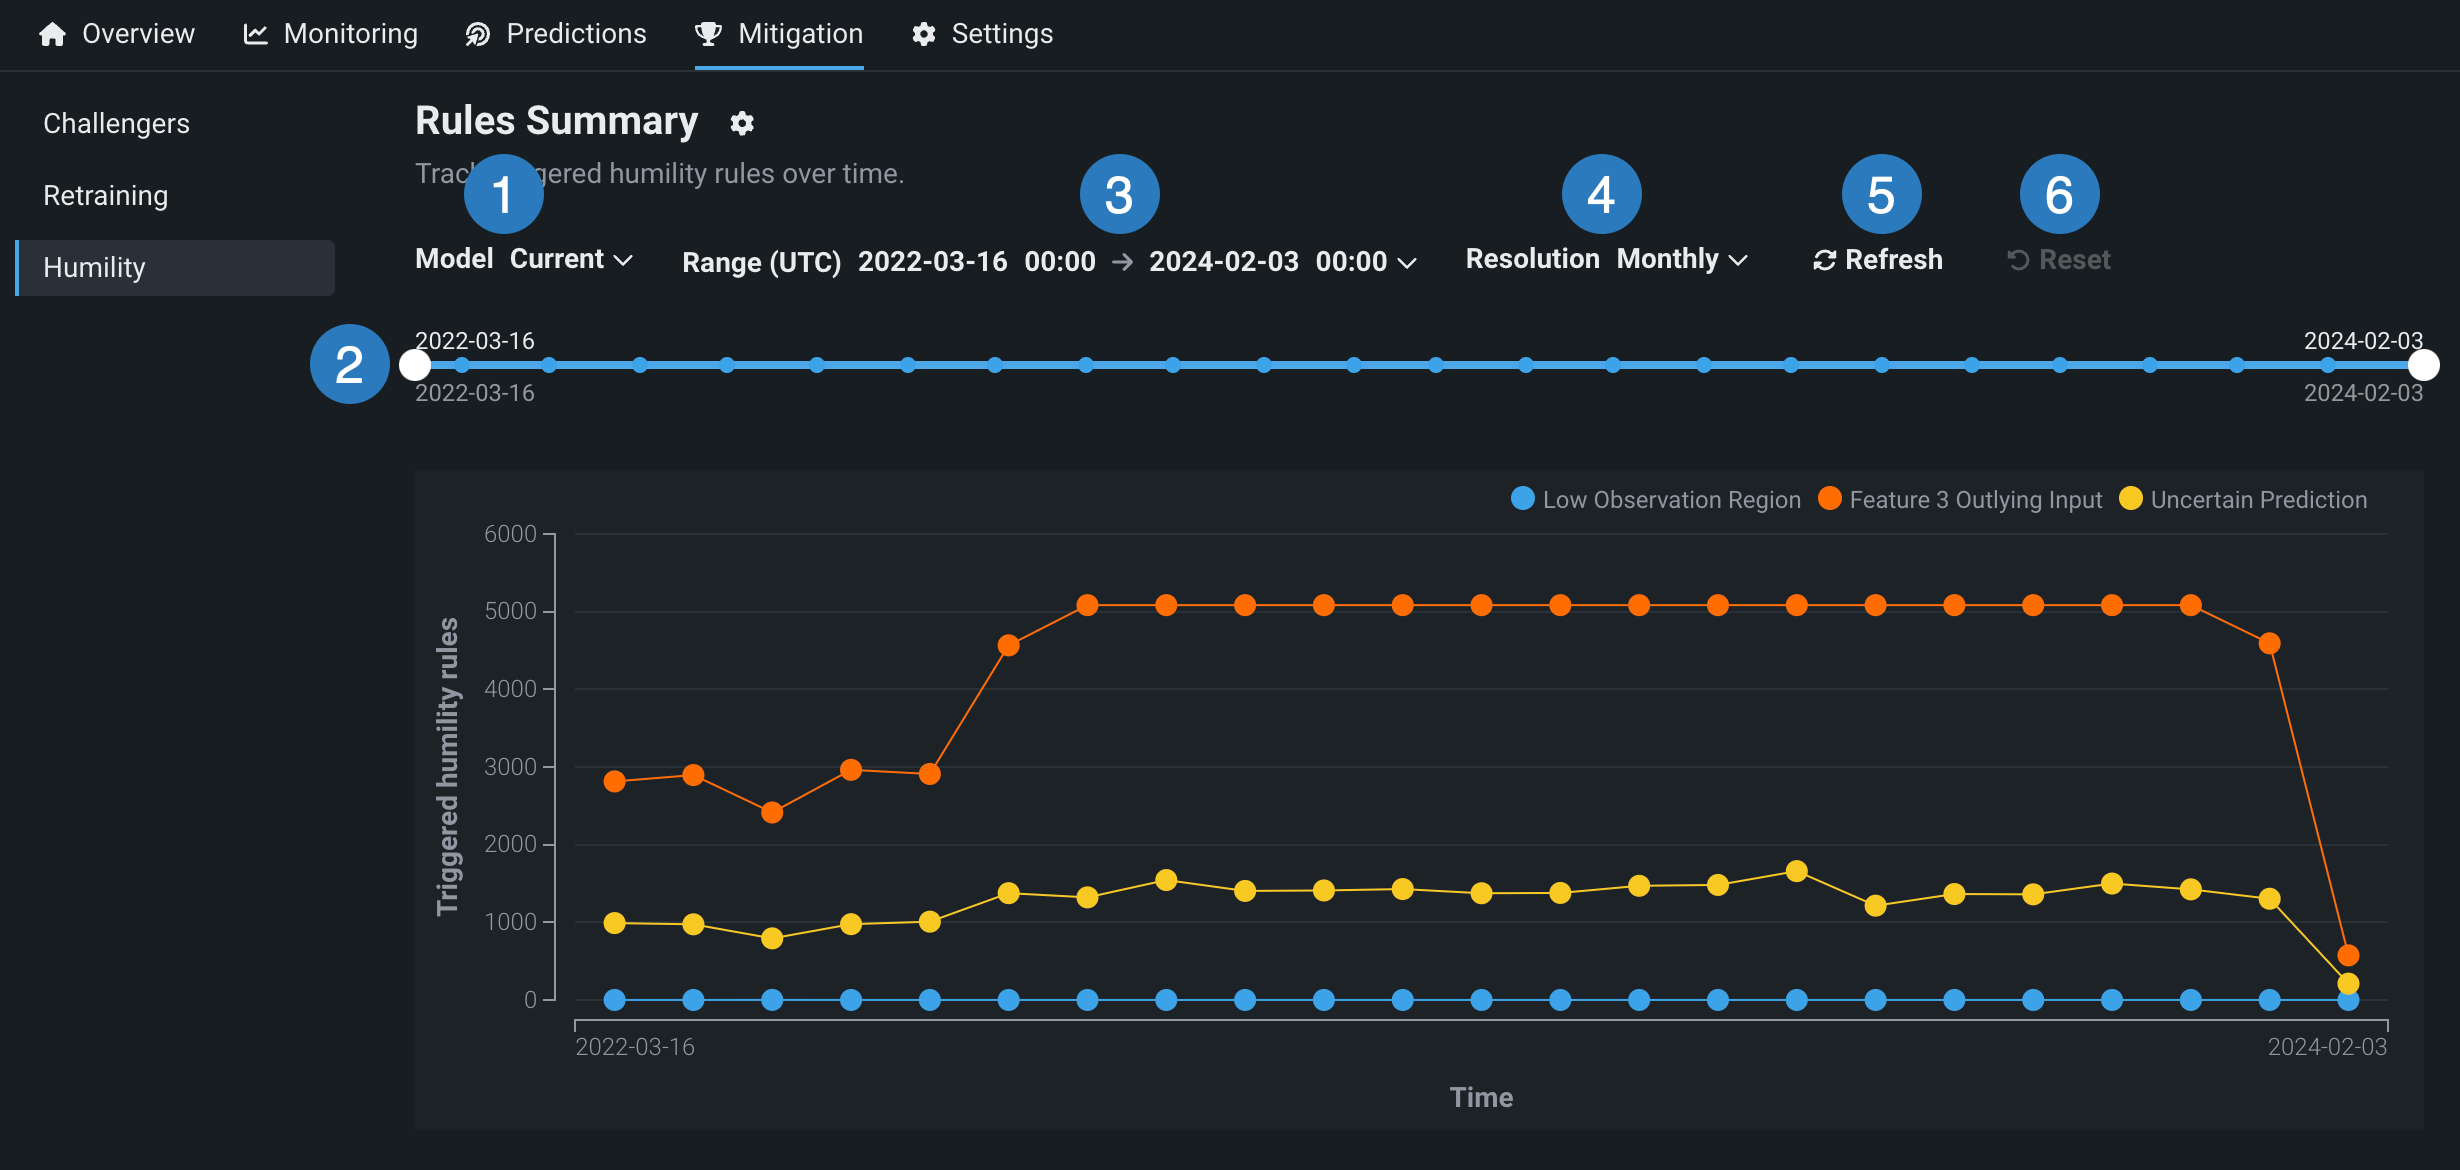
Use the following controls to configure the Humility dashboard:
| Control | Description | |
|---|---|---|
| 1 | Model version selector | Updates the dashboard displays to reflect the model you selected from the dropdown. |
| 2 | Date slider | Limits the range of data displayed on the dashboard (i.e., zooms in on a specific time period). |
| 3 | Range (UTC) selector | Sets the date range displayed for the deployment date slider. |
| 4 | Resolution selector | Sets the time granularity of the deployment date slider. |
| 5 | Refresh | Initiates an on-demand update of the dashboard with new data. Otherwise, DataRobot refreshes the dashboard every 15 minutes. |
| 6 | Reset | Reverts the dashboard controls to the default settings. |
Enable prediction warnings
Enable prediction warnings for regression model deployments on the Humility > Prediction warnings tab. Prediction warnings allow you to mitigate risk and make models more robust by identifying when predictions do not match their expected result in production. This feature detects when deployments produce predictions with outlier values, summarized in a report that returns with your predictions.
Prediction warnings availability
Prediction warnings are only available for deployments using regression models. This feature does not support classification or time series models.
Prediction warnings provide the same functionality as the Uncertain Prediction trigger that is part of humility monitoring. You may want to enable both, however, because prediction warning results are integrated into the Predictions Over Time chart on the Data drift tab.
-
To enable prediction warnings, navigate to Mitigation > Humility > Prediction warnings.
-
Enter a Lower bound and Upper bound, or click Configure to have DataRobot calculate the prediction warning ranges.

DataRobot derives thresholds for the prediction warning ranges from the Holdout partition of your model. These are the boundaries for outlier detection—DataRobot reports any prediction result outside these limits. You can choose to accept the Holdout-based thresholds or manually define the ranges instead.
-
After making any desired changes, click Save ranges.
After the humility rules are in effect, you can include prediction outlier warnings when you make predictions. Prediction warnings are reported on the Predictions Over Time chart on the Data drift tab.
Note
Prediction warnings are not retroactive. For example, if you set the upper-bound threshold for outliers to 40, a prediction with a value of 50, made prior to setting up thresholds, is not retroactively detected as an outlier. Prediction warnings will only return with prediction requests made after the feature is enabled.