Experiment insights
| Tile | Description |
|---|---|
 |
Opens insights that provide experiment-level information for all models. |
Experiment insights are tools that provide contextual information for the model:
- Use Learning Curves to compare model performance across different sample sizes.
- Use Speed vs Accuracy to graph tradeoffs between runtime and predictive accuracy.
Learning Curves
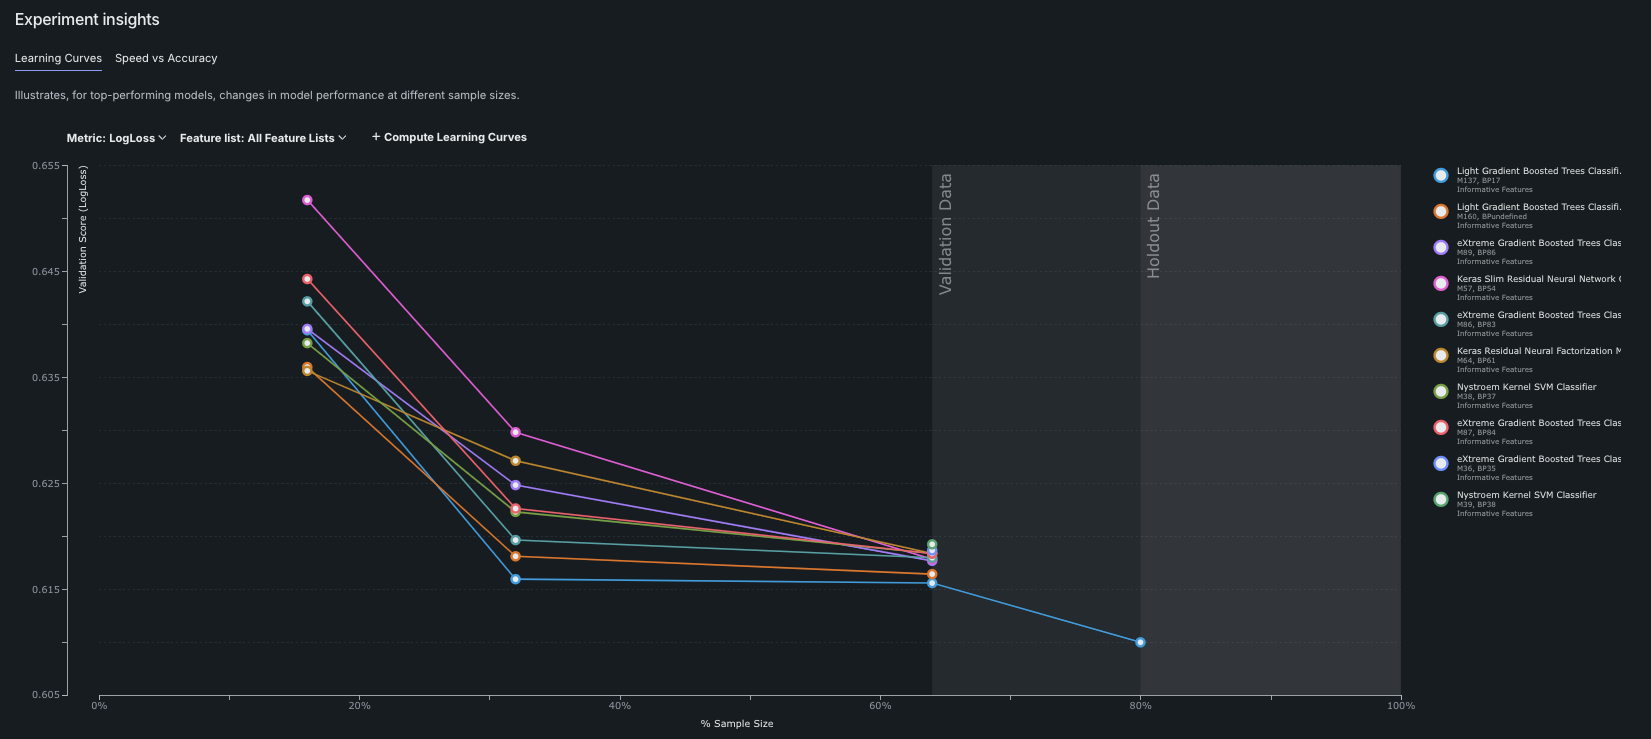
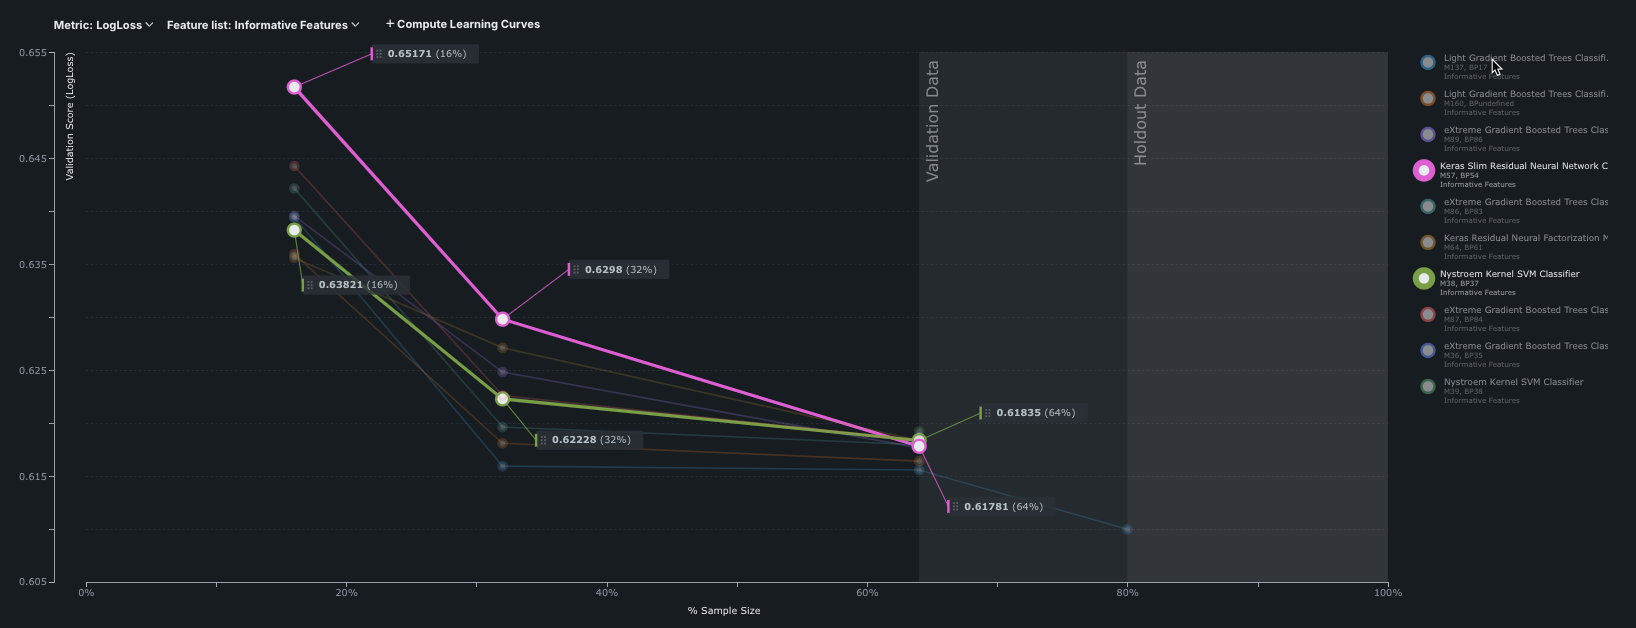
Learning Curves help to determine whether it is worthwhile to increase the size of the dataset. Getting additional data can be expensive, but may be worthwhile if it increases model accuracy. The graph illustrates, for top-performing models, how model performance varies as the sample size changes. A metric dropdown is available to sort the results, independently of the sort setting for the Leaderboard. It charts how well a model group performs when it is computed across multiple sample sizes in the training and validation partitions. This grouping represents a line in the graph, with each dot on the line representing the sample size and score of an individual model in that group.
How does DataRobot calculate model selection for display?
The Learning Curves graph uses the metric selected in the dropdown to plot model accuracy—for example, if LogLoss is chosen, the lower the log loss, the higher the accuracy. The display plots, for the top 10 performing models, log loss for each size data run. The resulting curves helps to predict how well each model will perform for a given quantity of training data.
DataRobot groups models by the blueprint ID and Feature List. So, for example, every Regularized Logistic Regression model, built using the Informative Features feature list, is a single model group. A Regularized Logistic Regression model built using a different feature list is part of a different model group.
By default, DataRobot displays:
- Up to the top 10 grouped models. There may be fewer than 10 models if, for example, one or more of the models highly diverges from the top model. To preserve graph integrity, that divergent model is treated as a kind of outlier and is not plotted.
- Any blenders models with scores that fall within an automatically determined threshold (that emphasizes important data points and graph legibility).
View values
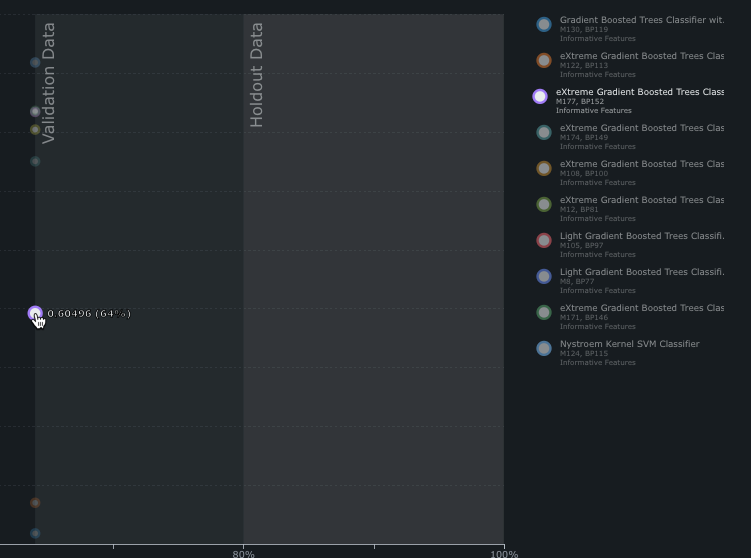
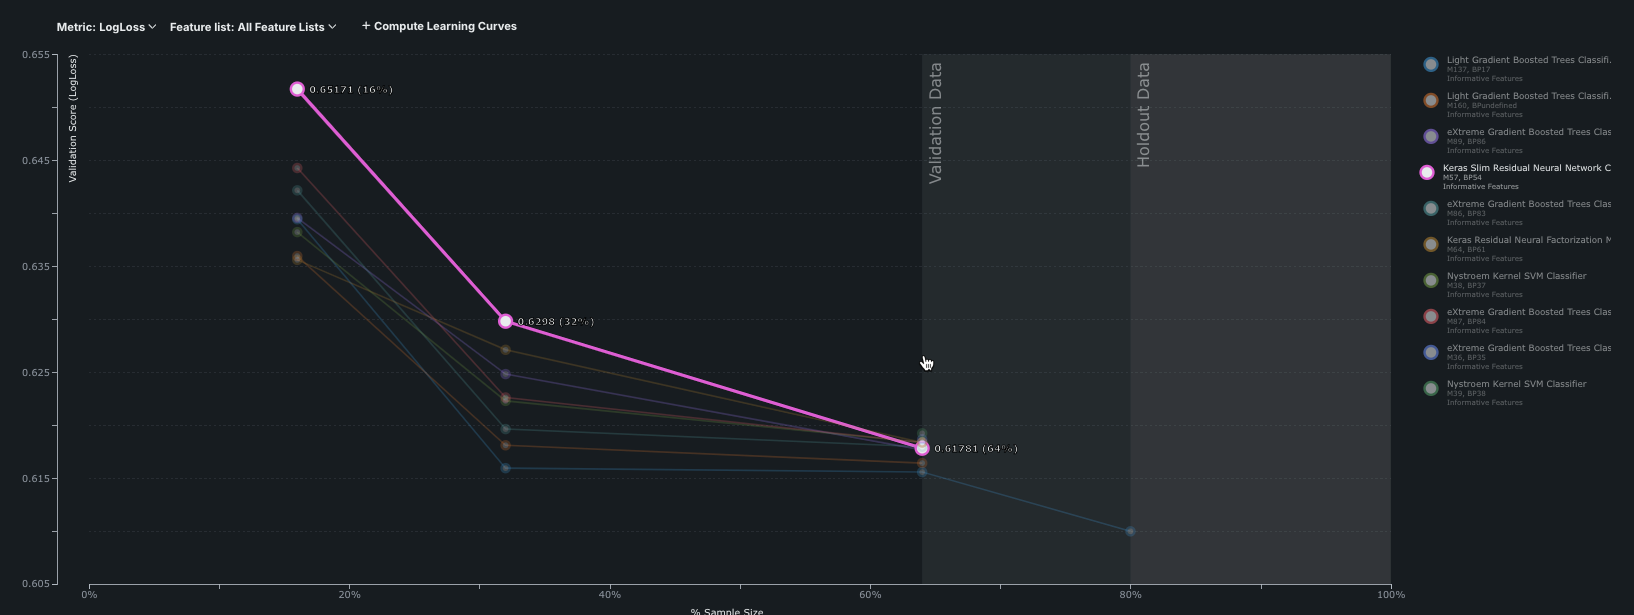
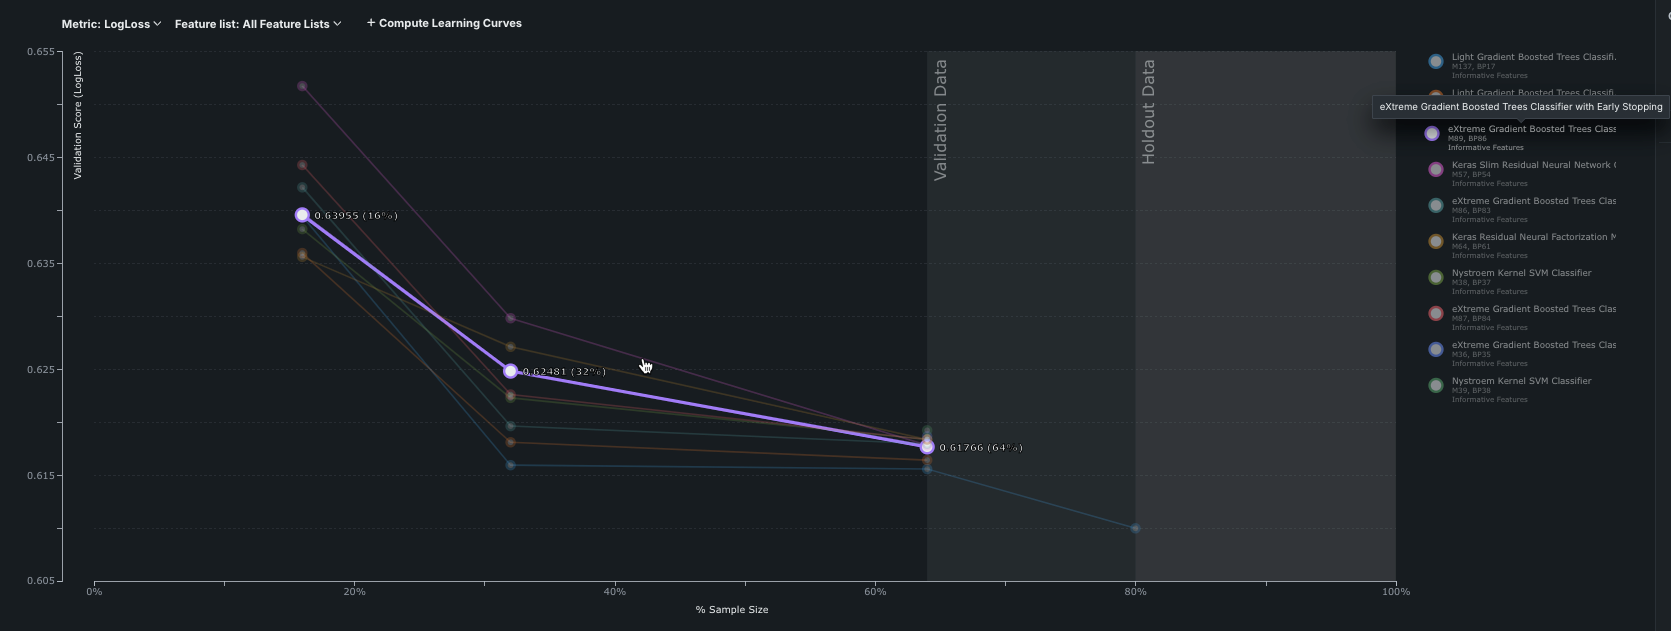
To see the values for a curve point, you can mouse over or click. The corresponding model highlights in the model list.
Note
If you ran comprehensive mode, not all models show all sample sizes in the graph. This is because as DataRobot reruns data with a larger sample size, only the highest scoring models from the previous run progress to the next stage. Also, the number of points for a given model depend on the number of rows in your dataset.
Filter view
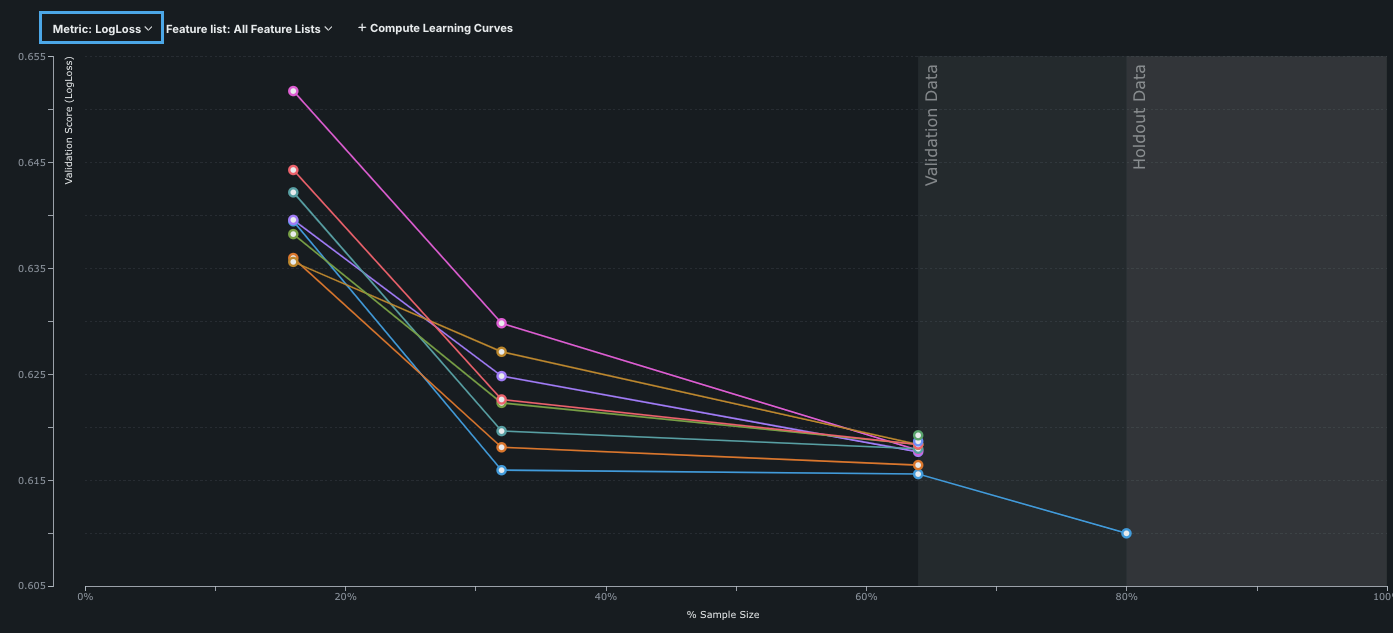
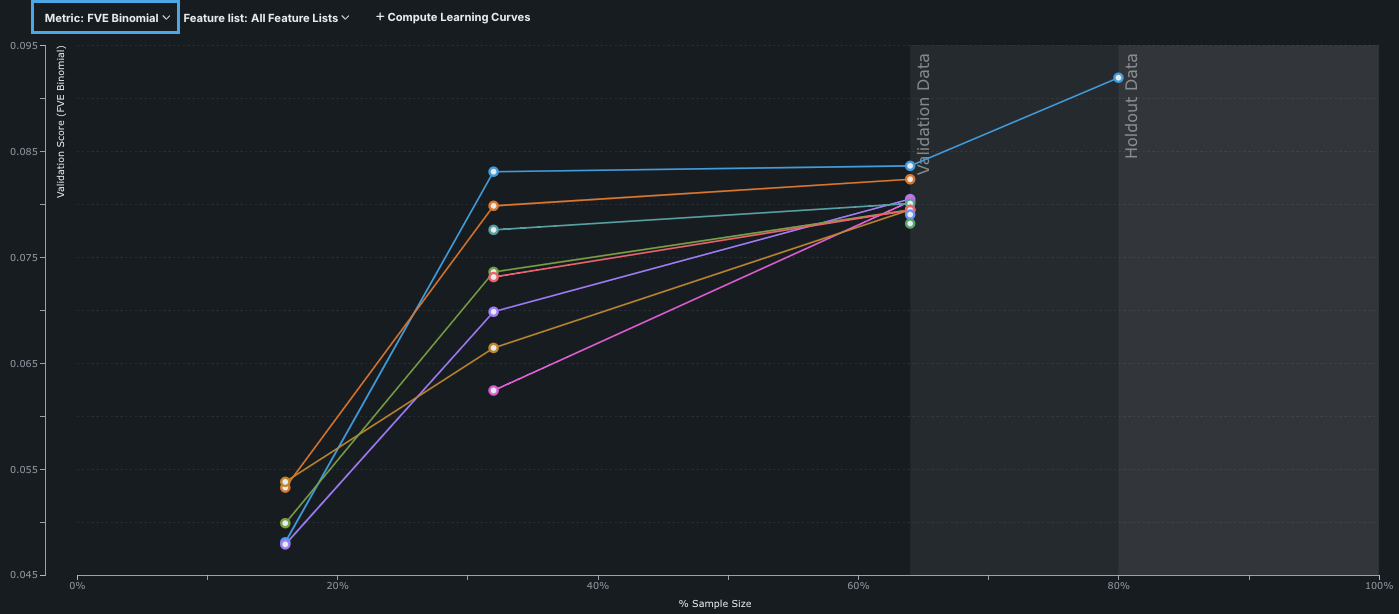
You can filter the Learning Curve display by metric or feature list. Select a metric to compare results. For example, the image below shows results for LogLoss and FVE Binomial:
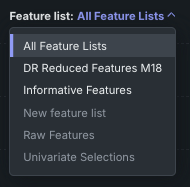
By default, the graph plots using the Informative Features feature list. Filter the graph to show models for a different feature list, including custom lists (if it was used to run models) by using the Feature list dropdown menu. The menu lists all feature lists that belong to the project. If you have not run models on a feature list, the option is displayed but disabled.
Compute new sample sizes
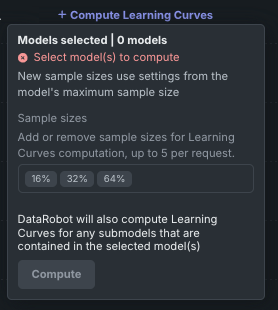
Because Quick Autopilot uses one-stage training, the Learning Curves graph will initially populate with only a single point for each of the top 10 performing models. Use the Compute Learning Curves option to increase the display points.
Notes on sample sizes
-
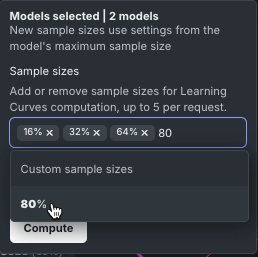
Adding sample sizes causes DataRobot to recompute for the newly entered sizes. Computation is run for all models, or, if you selected one or more models from the list of the right, only for the selected model(s). While per-request size is limited to five sample sizes, you can display any number of points on the graph using multiple requests. The sample size values you add via Compute Learning Curves are only remembered and auto-populated for that session; they do not persist if you navigate away from the page.
-
If you trained on a new sample size from the Leaderboard, any atypical size (a size not available from the snap-to choices in the dialog to add a new model) does not automatically display on the Learning Curves graph, although you can add it from the graph.
-
Initially, the sample size field populates with the default snap-to sizes (usually 16%, 32%, and 64%). Because the field only accepts five sizes per request, if you have more than two additional custom sizes you can delete the defaults if they are already plotted. (Their availability on the graph is dependent on the modeling mode you used to build the project.)
To compute new points:
-
Select which models to compute for from the list on the right side of the window. Selected models highlight in the display. Click Compute Learning Curves.
-
Add or remove sample sizes, including custom sizes.
-
Click Compute.
Interpret Learning Curves
Consider the following when evaluating the Learning Curves graph:
-
Study the model for any sharp changes or performance decrease with increased sample size. If the dataset or the validation set is small, there may be significant variation due to the exact characteristics of the datasets.
-
Model performance can decrease with increasing sample size, as models may become overly sensitive to particular characteristics of the training set.
-
In general, high-bias models (such as linear models) may do better at small sample sizes, while more flexible, high-variance models often perform better at large sample sizes.
-
Preprocessing variations can increase model flexibility.
Speed vs Accuracy
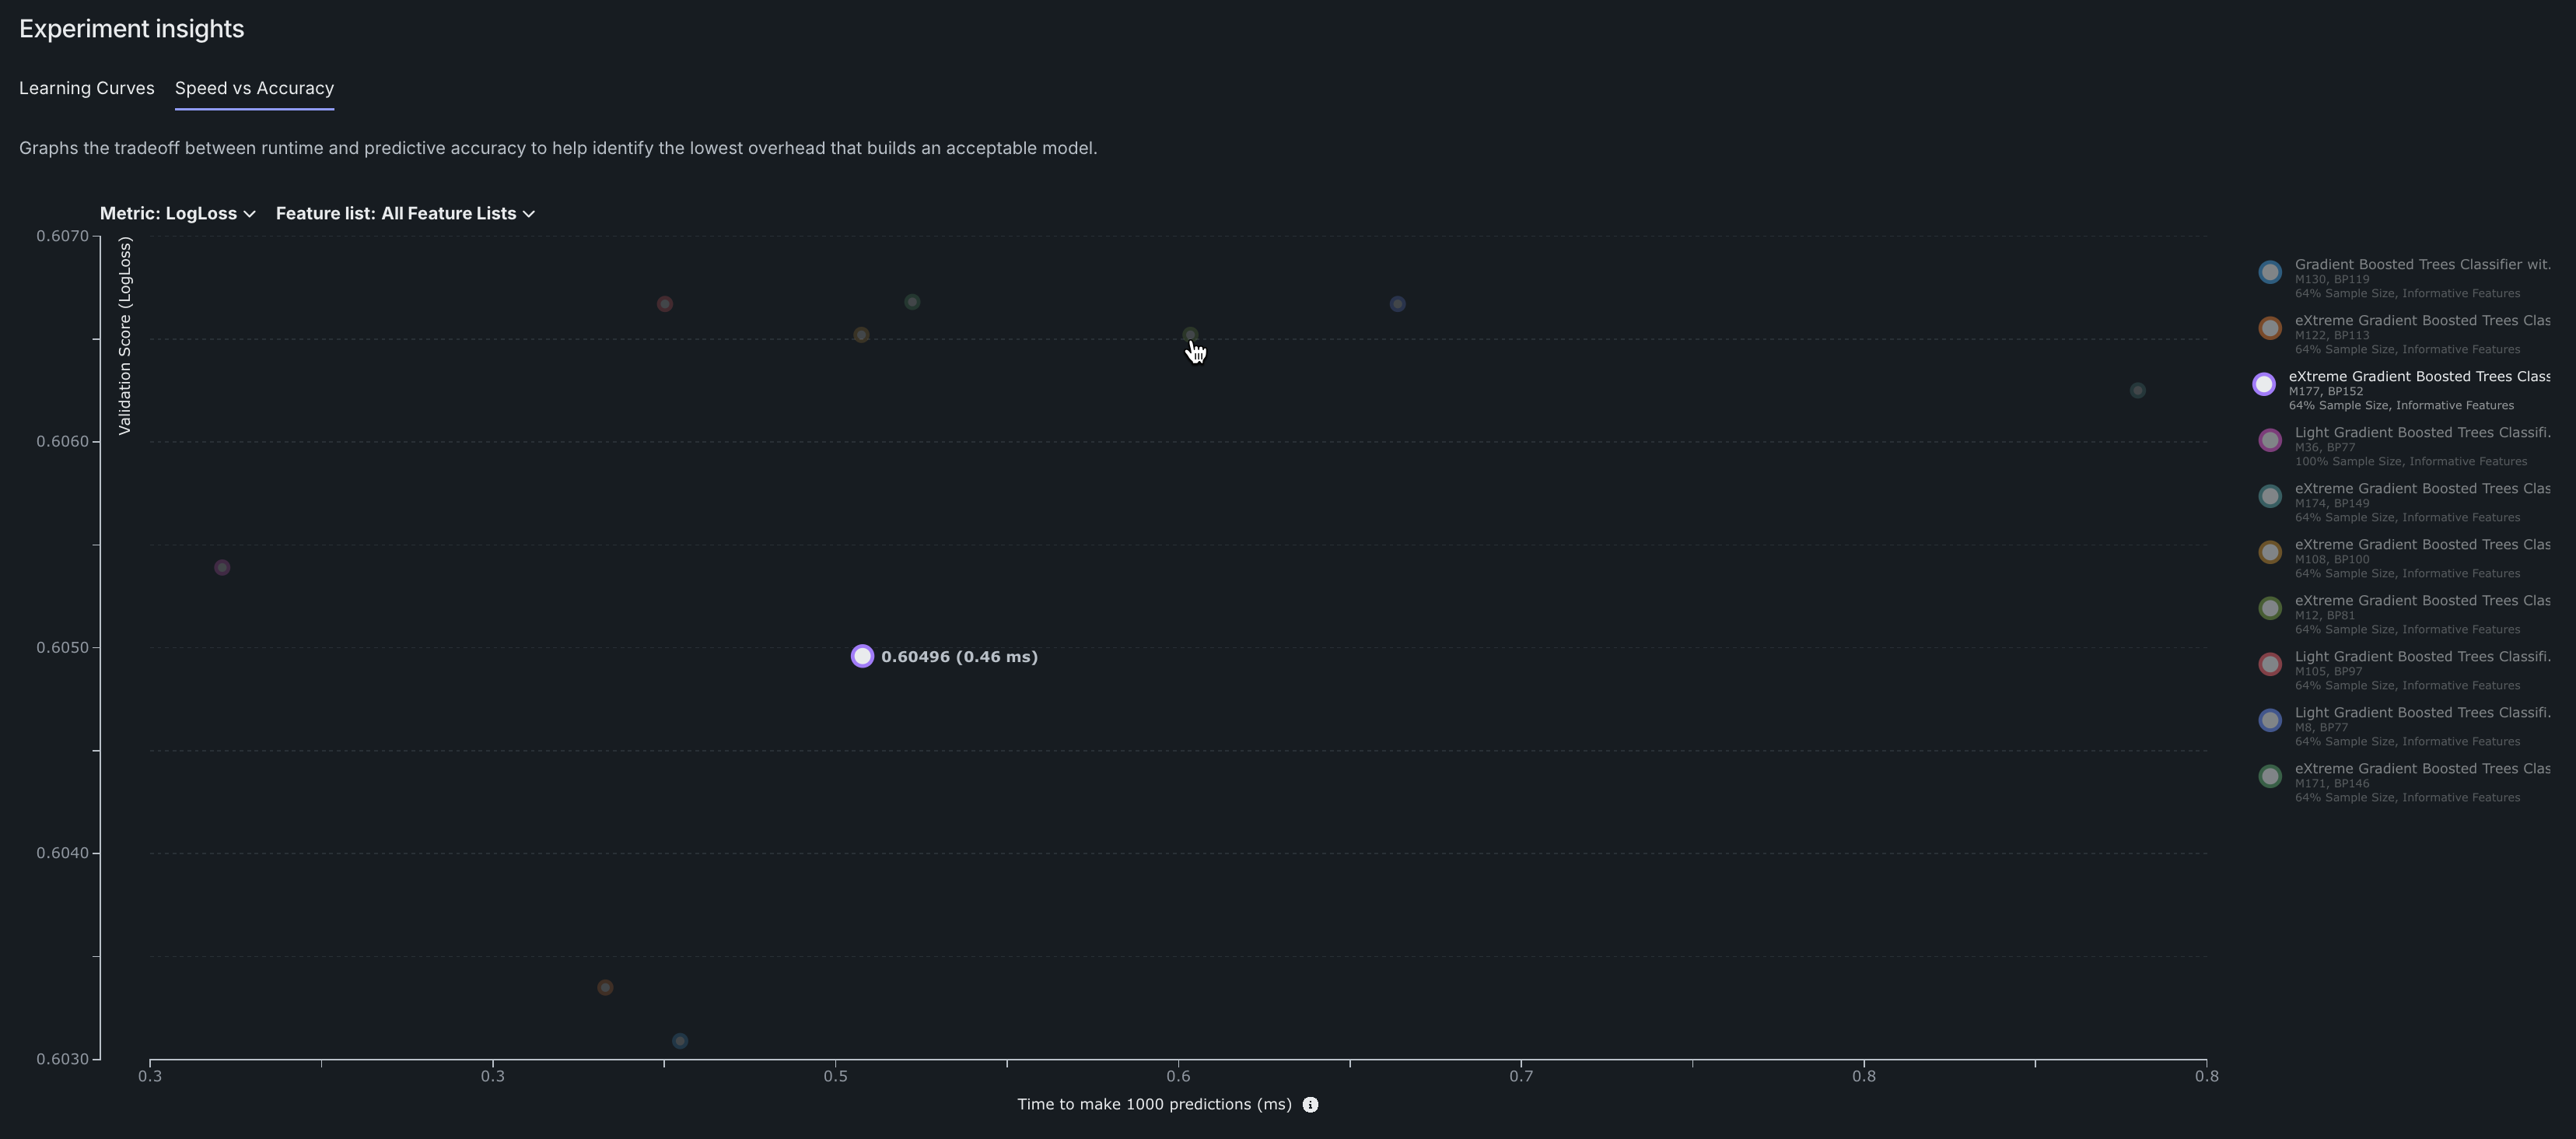
Predictive accuracy often comes at the price of increased prediction runtime. The Speed vs Accuracy analysis plot shows the tradeoff between runtime and predictive accuracy to help choose the best model with the lowest overhead. The display is based on the validation score, using the currently selected metric.
-
The Y-axis lists the metric currently selected on the Leaderboard. Use the Metric dropdown to change metric.
-
The X-axis displays the estimated time, in milliseconds, to make 1000 predictions. Total prediction times include a variety of factors and vary based on the implementation. Mouse over any point on the graph, or the model name in the legend to the right, to display the estimated time and the score.
Tip
If you re-order the Leaderboard display, for example to sort by cross-validation score, the Speed vs Accuracy graph continues to plot the top 10 models based on validation score.
