View model insights
On the Registry > Models tab, the Insights tab is available for DataRobot and custom models (not agent-monitored external models). The following insights are supported:
| Insight | Description | Problem type | Sliced insights? |
|---|---|---|---|
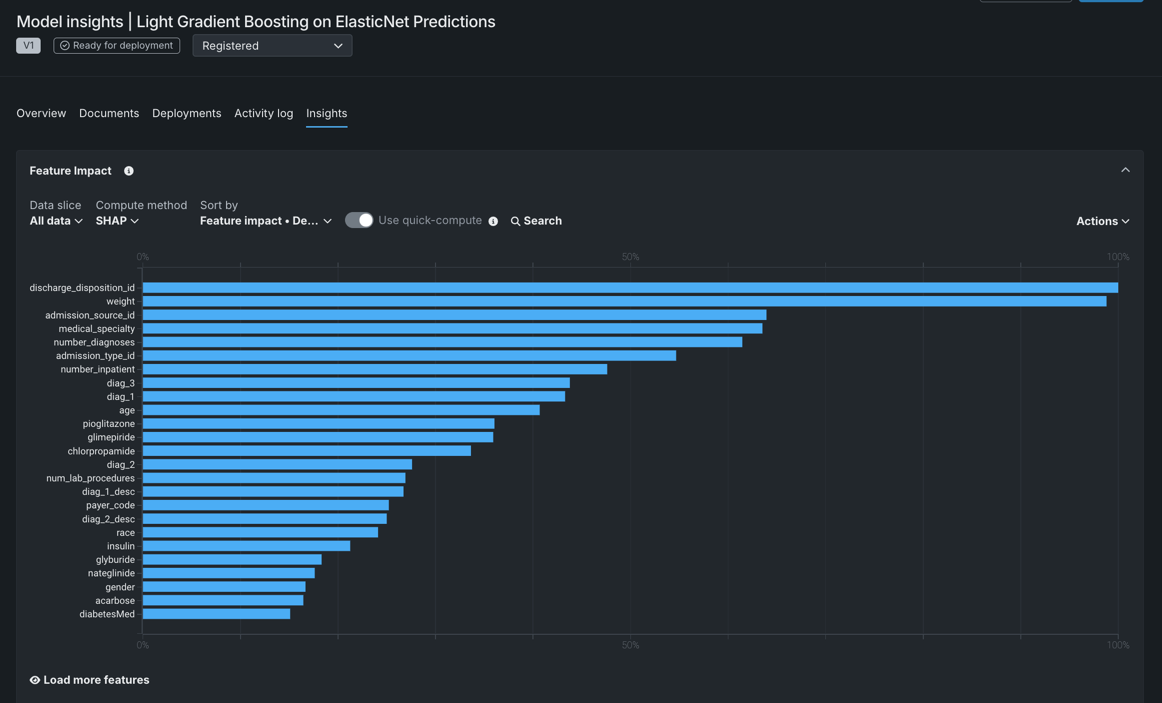
| Feature Impact | Shows which features are driving model decisions. | All | ✔ |
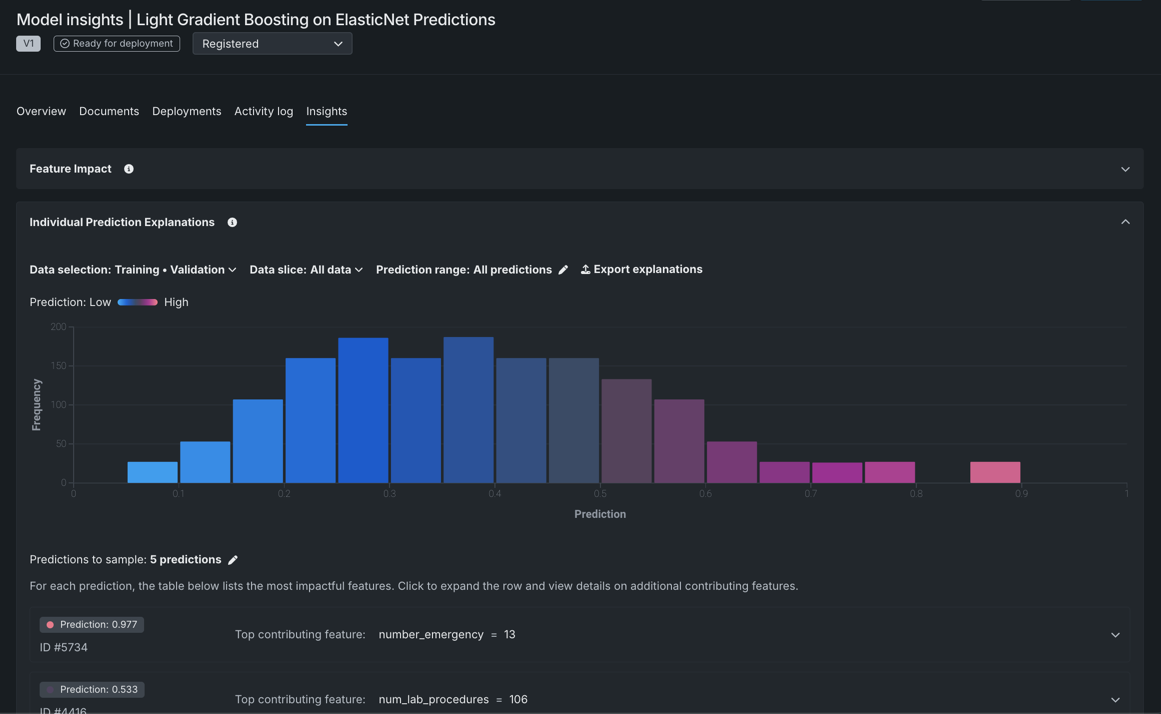
| Individual Prediction Explanations | Estimates how much each feature contributes to a given prediction, with values based on difference from the average. | Binary classification, regression | ✔ |
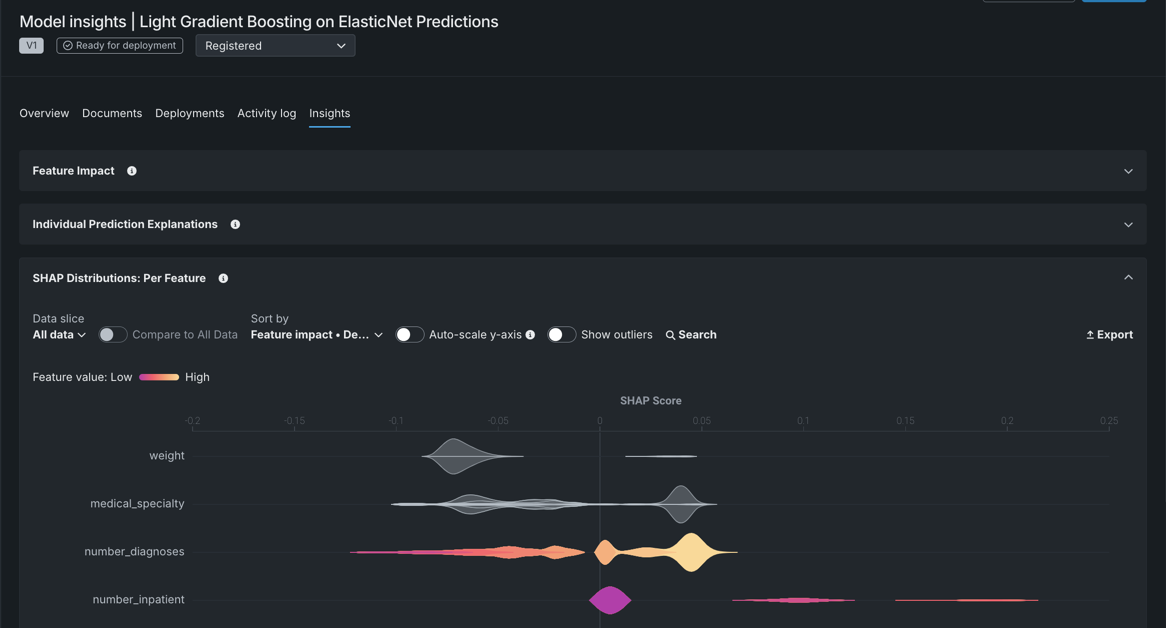
| SHAP Distributions: Per Feature | Displays, via a violin plot, the distribution of SHAP values and feature values to aid in the analysis of how feature values influence predictions. | Binary classification, regression | ✔ |
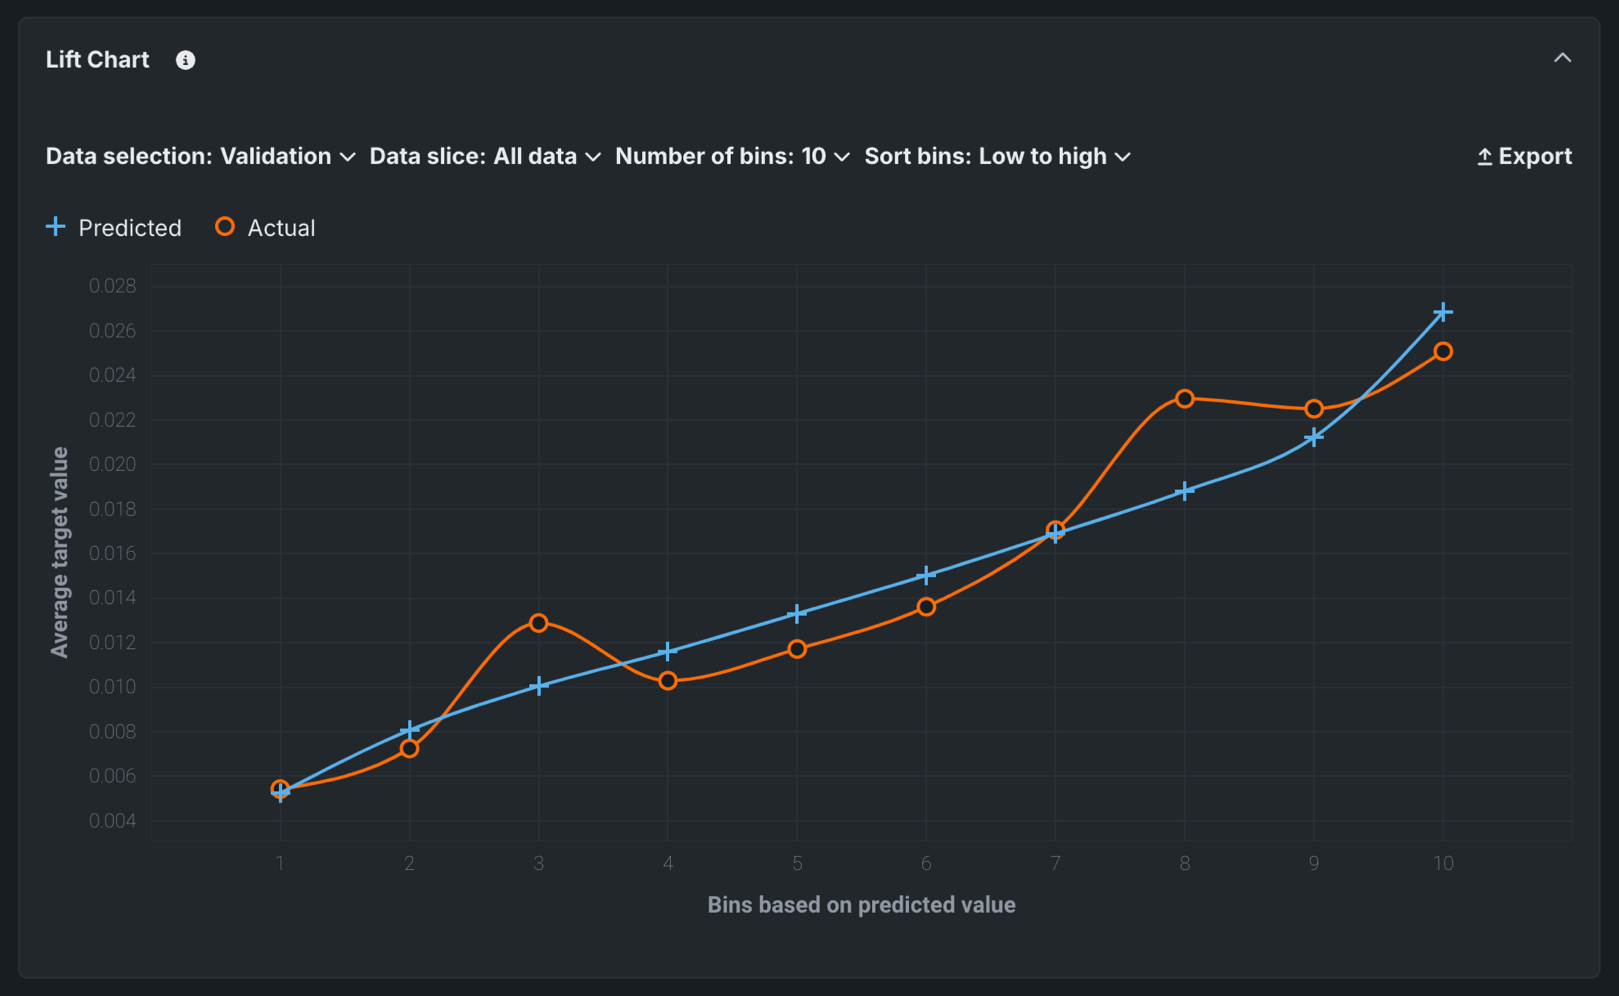
| Lift Chart | Depicts how well a model segments the target population and how capable it is of predicting the target. | All | ✔ |
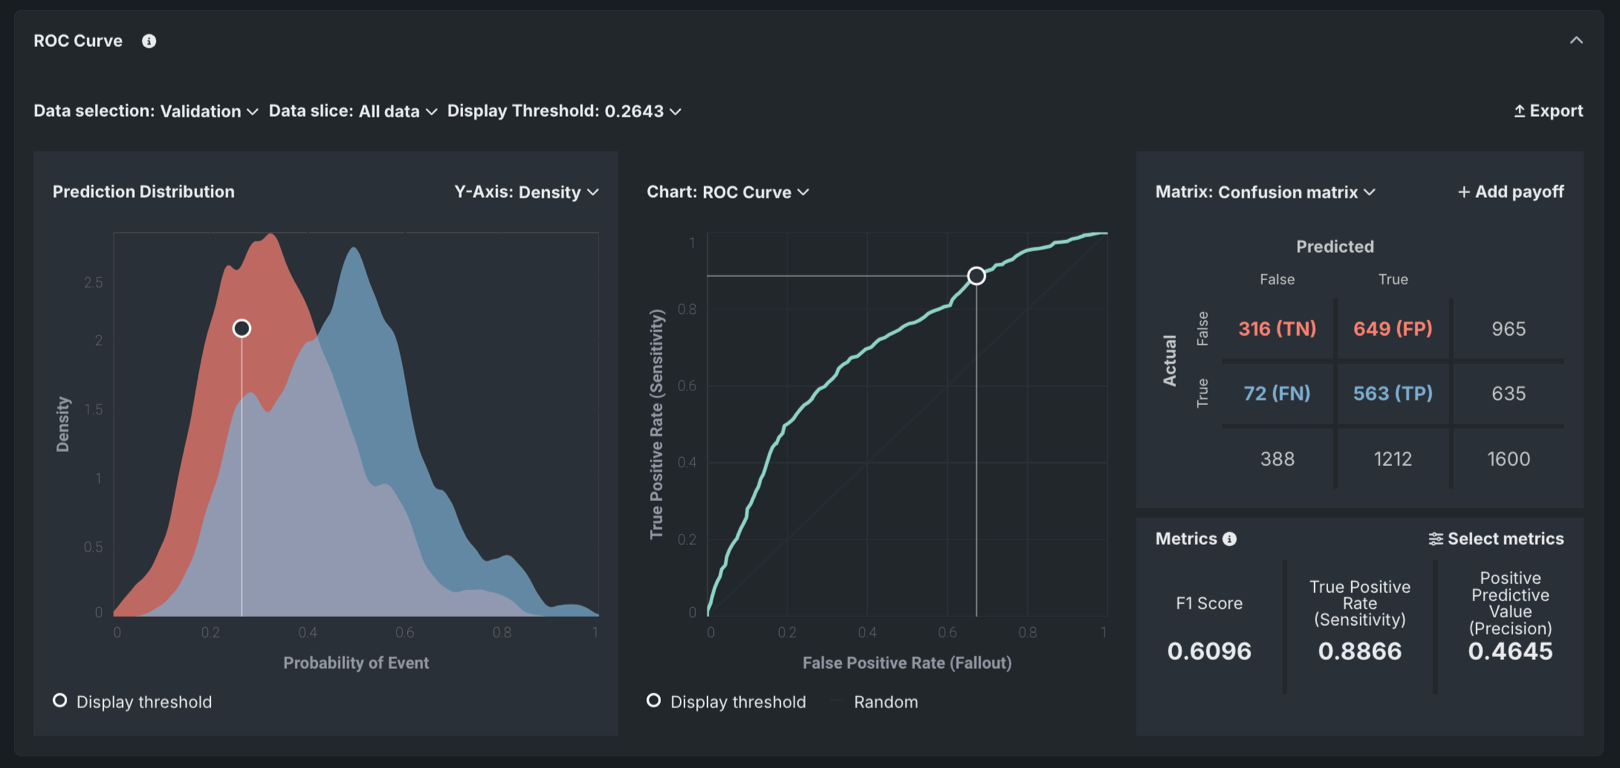
| ROC Curve | Provides tools for exploring classification, performance, and statistics related to a model. | Binary classification | ✔ |
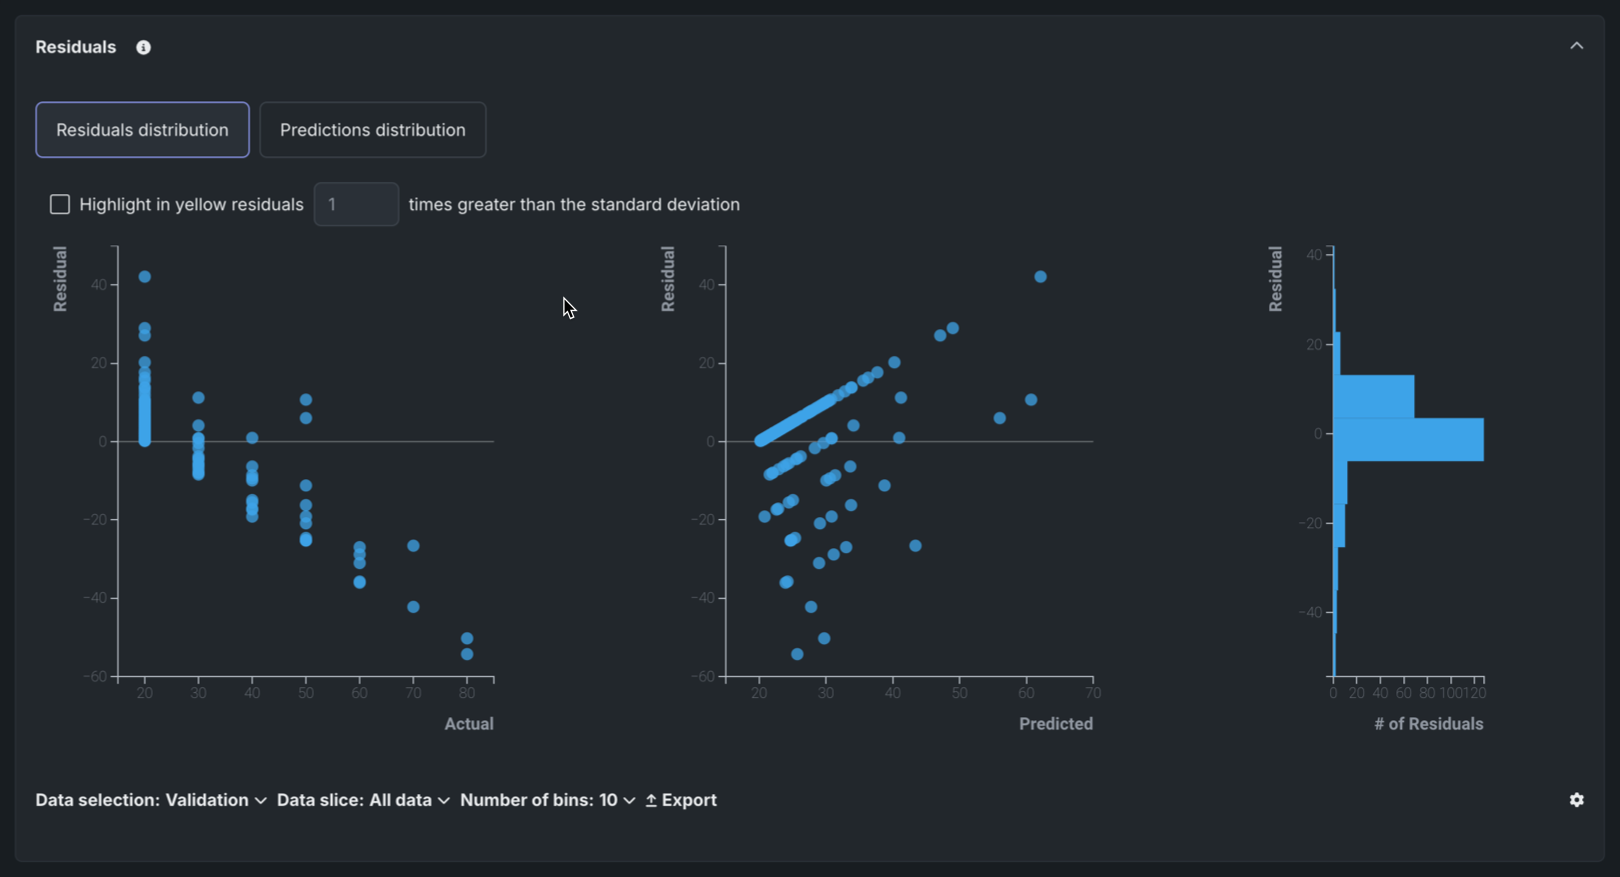
| Residuals | Provides scatter plots and a histogram for understanding model predictive performance and validity. | Regression | ✔ |
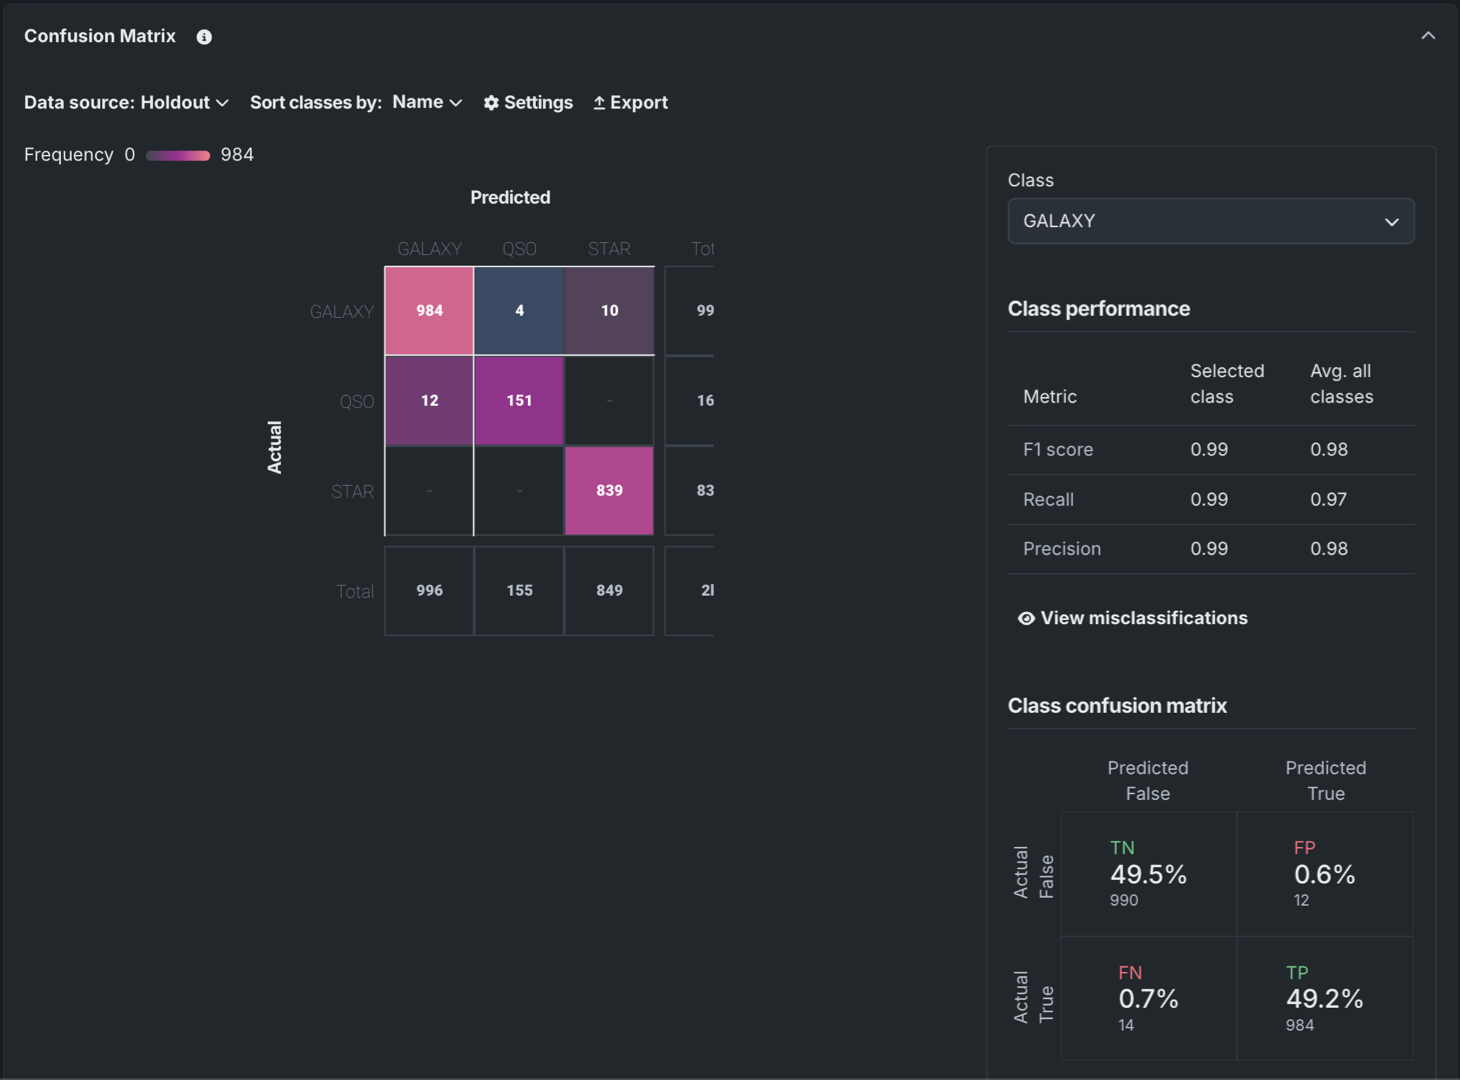
| Confusion matrix | Compares actual with predicted values in multiclass classification problems to identify class mislabeling. | Classification, time-aware |
Compute insights
When you first access the Insights tab for a registered model version, to view the table of predictions for the Individual Prediction Explanations insight and the violin chart for the SHAP Distributions: Per Feature insight, click Compute.