Forecasting Accuracy
| Tab | Description |
|---|---|
| Performance | Provides a visual indicator of how well a model predicts at each forecast distance in the experiment's forecast window. Time-aware only |
Use Forecasting Accuracy to help determine, for example, how much harder it is to accurately forecast four days out as opposed to two days out. The chart depicts how accuracy changes as you move further into the future. The insight is available for all time series experiments (both single series and multiseries).
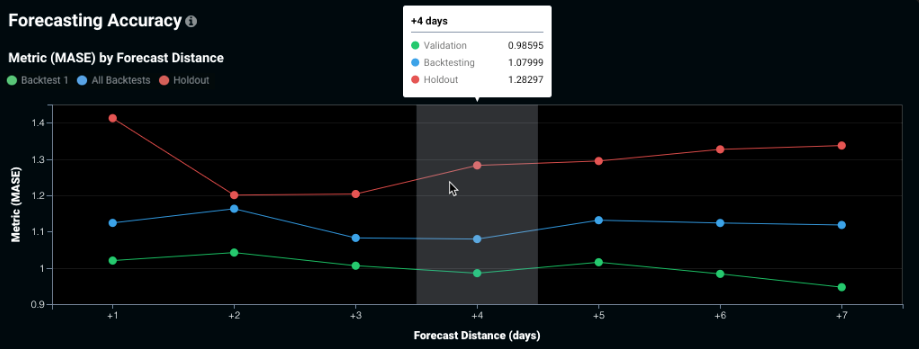
For each forecast distance, the points represent:
-
Green (Backtest 1): the validation score displayed on the Leaderboard, which represents the validation score of the first (most recent) backtest.
-
Blue (All Backtests): the backtesting score displayed on the Leaderboard, which represents the average validation score across all backtests.
-
Red (Holdout): the holdout score.
Change the optimization metric from the Leaderboard to change the display.