Resource monitoring
The Monitoring > Resource monitoring tab provides visibility into resource utilization metrics for deployed custom models and agentic workflows, helping you monitor performance, identify bottlenecks, and understand auto-scaling behavior. Use this tab to evaluate resource usage, navigate tradeoffs between speed and cost, and ensure your deployments efficiently utilize available hardware resources.
To access Resource monitoring, select a deployment from the Deployments inventory and then click Monitoring > Resource monitoring. The tab displays summary tiles showing aggregated and current values for key metrics, along with interactive charts that visualize resource utilization over time.
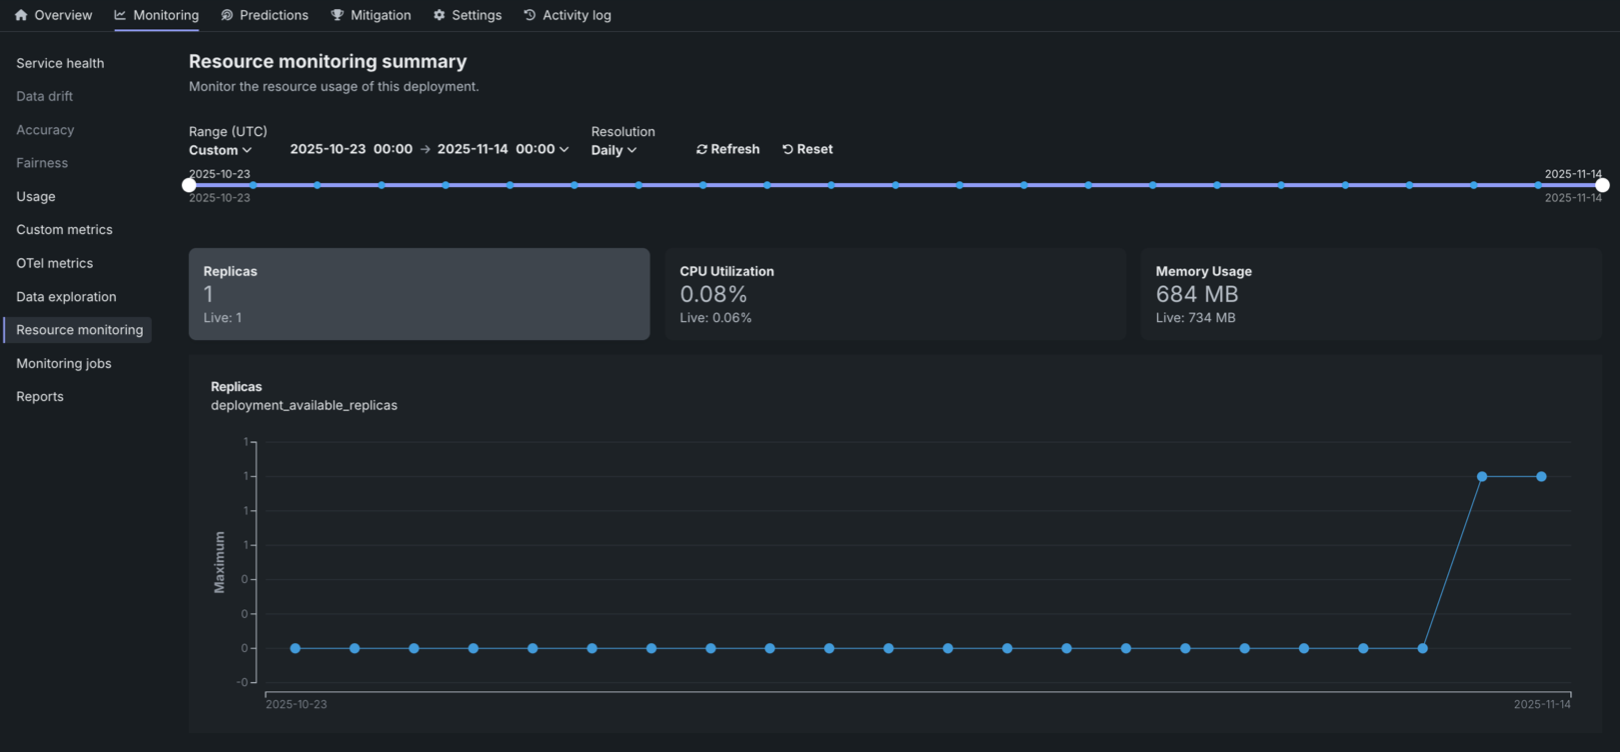
Resource utilization summary tiles
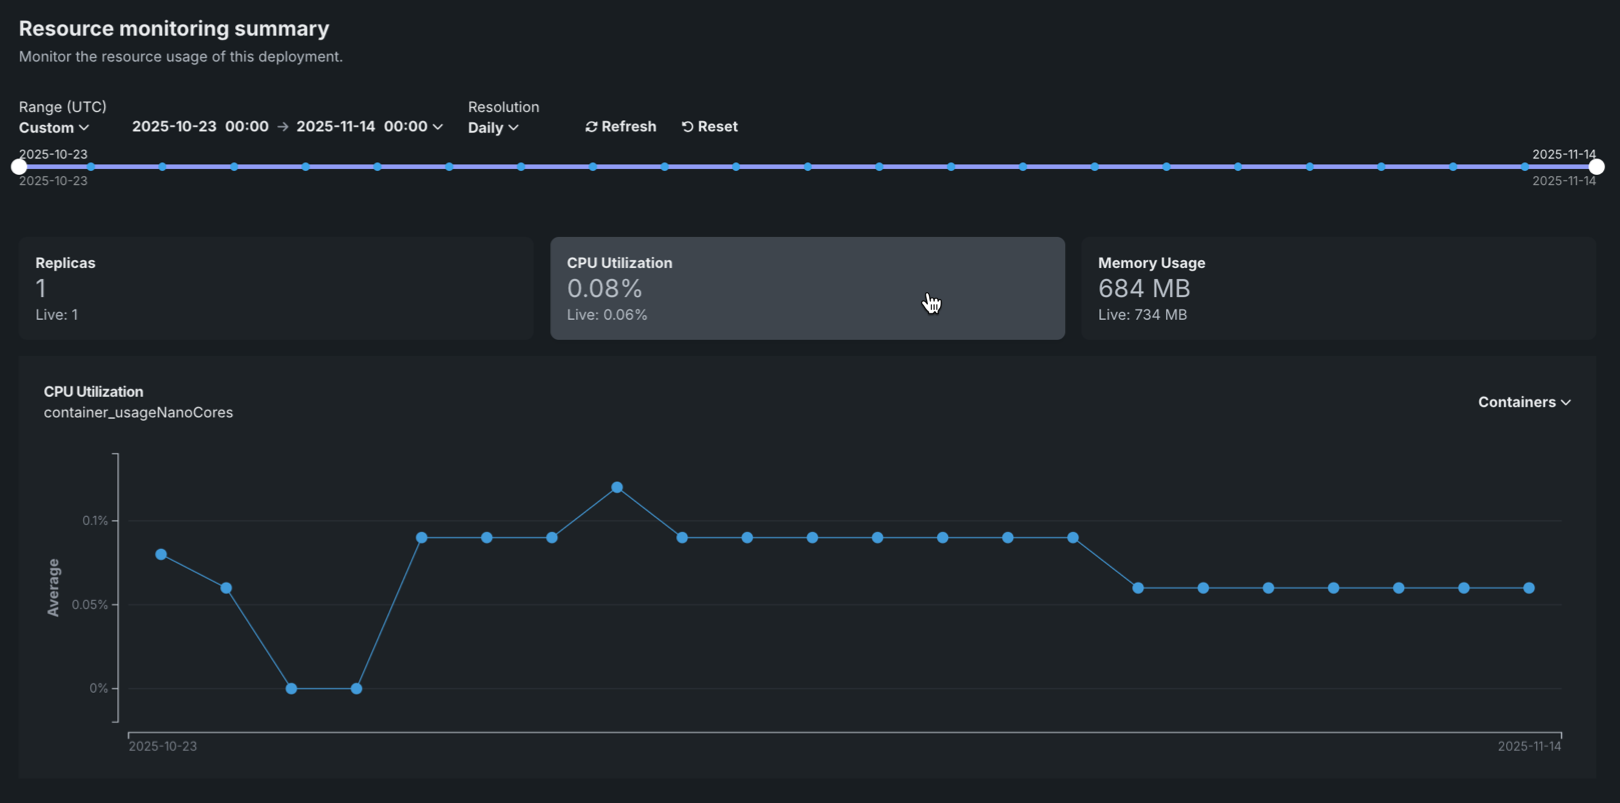
The Resource monitoring tab displays summary tiles at the top of the page, showing both the aggregated value over the selected timespan (the primary value) and the current Live value at the time of the request. The aggregated value represents the average value over the selected timespan. Clicking on a metric tile updates the chart below to display that metric over time.
The following metrics are displayed as summary tiles:
| Metric | Description |
|---|---|
| Replicas | The number of active compute instances (replicas) out of the maximum available for the deployment. For native models, this counts prediction server pods. For custom models, this counts the number of custom model pods. |
| CPU utilization | The percentage of CPU cores being used across all compute instances for the deployment. |
| Memory usage | The amount of memory (in bytes or appropriate units) being used across all compute instances for the deployment. |
Resource utilization charts
The Resource monitoring tab displays interactive charts that visualize resource utilization metrics over time, helping you identify patterns and understand resource consumption trends.
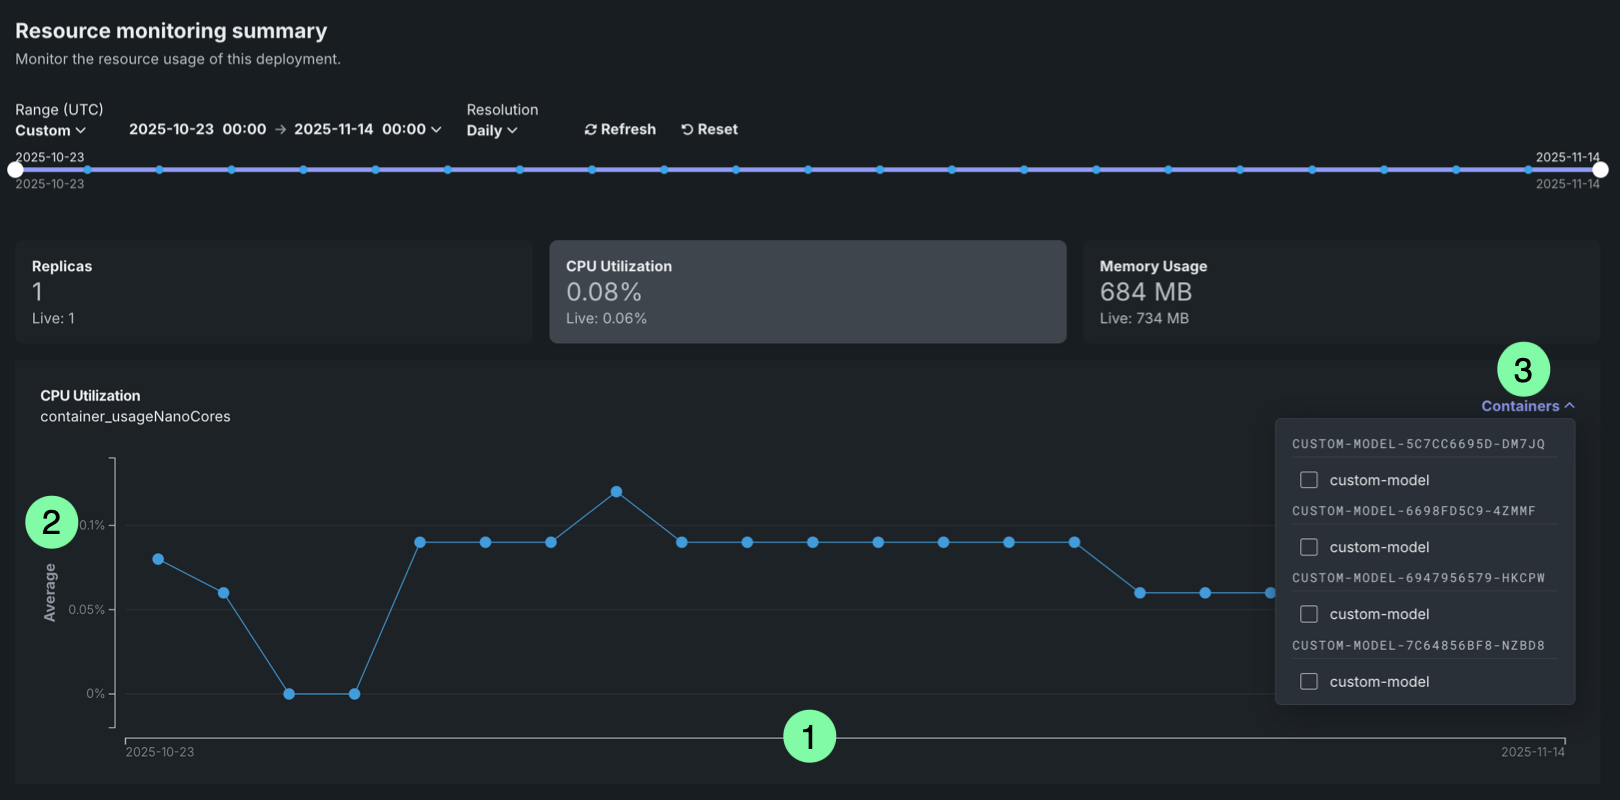
The chart displays the selected metric over time, with the following elements:
| Chart element | Description | |
|---|---|---|
| 1 | Time (X-axis) | Displays the time represented by each data point, based on the selected resolution (1 minute, 5 minutes, hourly, or daily). |
| 2 | Metric value (Y-axis) | Displays the value (cardinality for Replicas and average for all other metrics) of the selected metric (Replicas, CPU utilization, or Memory usage) for each time period. |
| 3 | Containers | For deployments with multiple compute instances, you can filter resource utilization metrics by specific compute instance. |
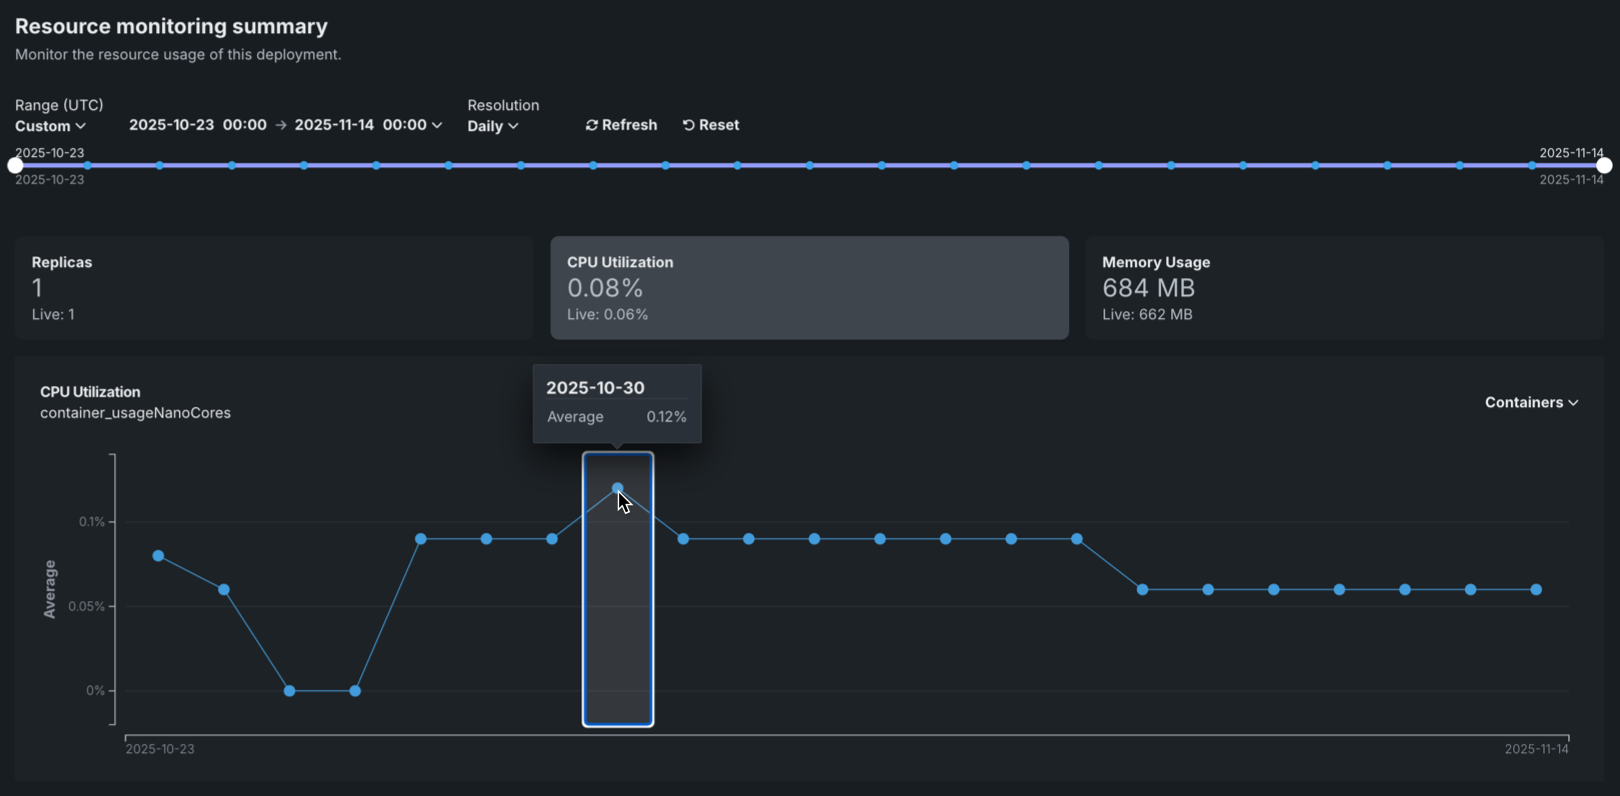
To view additional information on the chart, hover over a data point to see the time range and metric value:
You can configure the Resource monitoring dashboard to focus on specific time frames and metrics. The following controls are available:
| Control | Description |
|---|---|
| Range (UTC) | Sets the date range displayed for the deployment date slider. You can also drag the date slider to set the range. The range selector only allows you to select dates and times between the start date of the deployment's current version of a model and the current date. |
| Resolution | Sets the time granularity of the deployment date slider. The following resolution settings are available, based on the selected range:
|
| Refresh | Initiates an on-demand update of the dashboard with new data. Otherwise, DataRobot refreshes the dashboard every 15 minutes. |
| Reset | Reverts the dashboard controls to the default settings. |
Time range limitations
The Resource monitoring tab is limited to displaying data from the last 30 days. This limitation ensures optimal performance when querying and displaying resource utilization metrics.
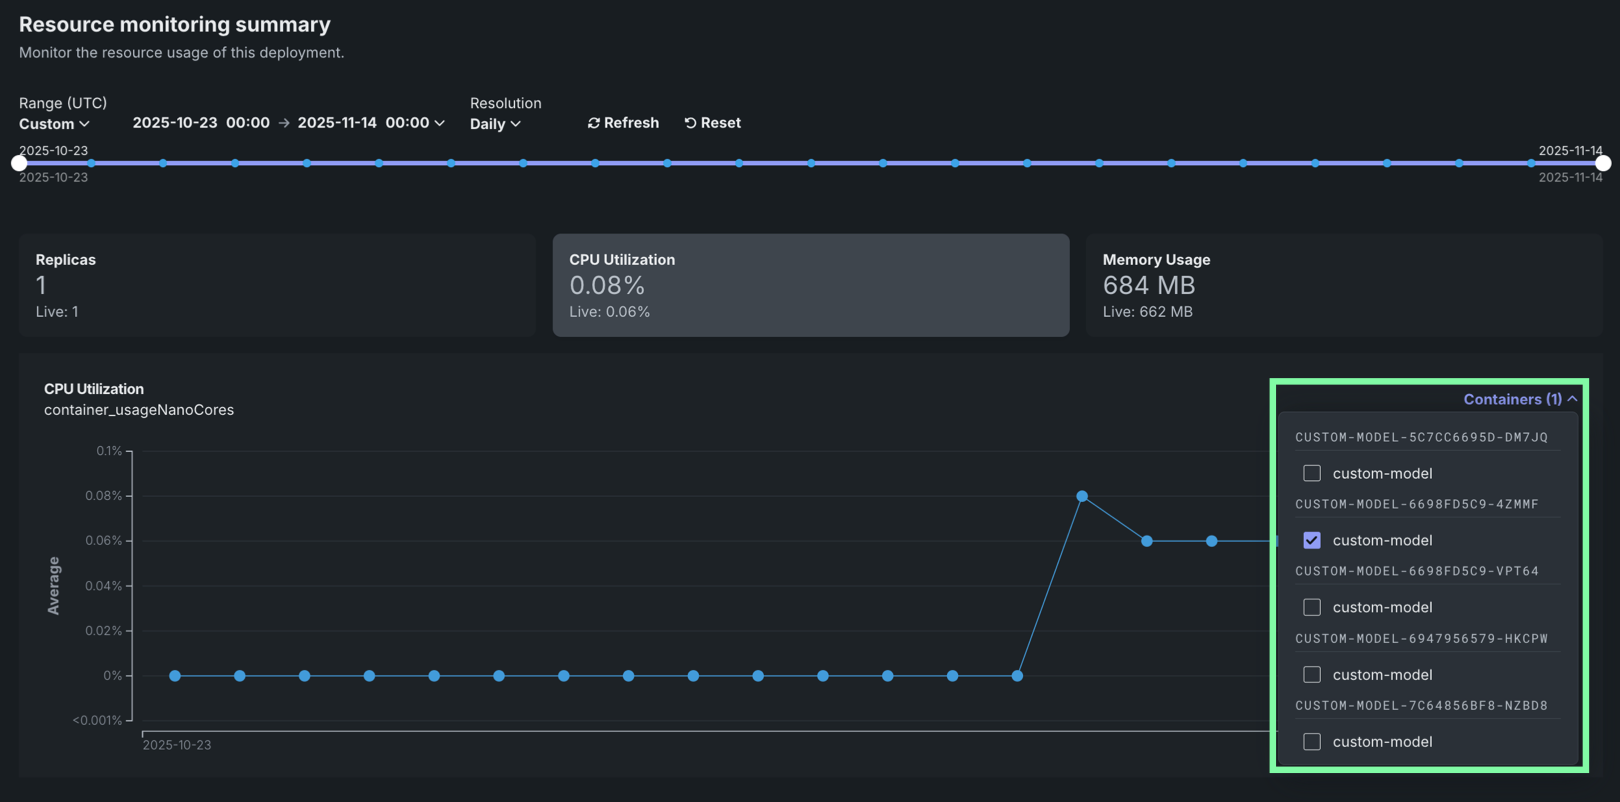
Filter by compute instance
For deployments with multiple compute instances, you can filter resource utilization metrics by specific compute instances. Filtering by compute instance allows you to:
- Identify which instances are experiencing high resource utilization.
- Troubleshoot issues affecting specific instances.
- Understand resource distribution across instances.
To filter by compute instance, use the Containers selector in the dashboard controls. Metrics are grouped by compute instance and are filtered by LRS ID or inference ID.
Compute instance filtering
Compute instance filtering is available for deployments with multiple instances. For single-instance deployments, the filtering selector is not available.
Understanding resource utilization metrics
The following sections provide detailed explanations of each resource utilization metric displayed on the Resource monitoring tab. Understanding these metrics helps you evaluate resource usage, identify bottlenecks, and make informed decisions about resource bundle sizing.
Replicas
The Replicas metric shows the number of active compute instances (replicas) currently running for your deployment, out of the maximum available. This metric helps you:
- Monitor changes in the number of replicas over time to understand scaling behavior.
- Correlate the number of replicas with resource utilization metrics.
- Identify when additional capacity is needed or when resources are underutilized.
For native models, this metric counts prediction server pods. For custom models, this metric counts custom model pods.
CPU utilization
The CPU utilization metric shows the percentage of CPU cores being utilized across all compute instances. This metric helps you:
- Identify CPU bottlenecks that may be affecting model performance.
- Understand CPU usage patterns over time.
- Make informed decisions about CPU resource bundle sizing.
High CPU utilization may indicate that your deployment needs more CPU resources or that the workload is CPU-intensive. Low CPU utilization may suggest that you can reduce the CPU resource bundle size to optimize costs.
Memory usage
The Memory usage metric shows the amount of memory being used across all compute instances. This metric helps you:
- Monitor memory usage to prevent out-of-memory errors.
- Identify memory leaks or excessive memory consumption.
- Make informed decisions about memory resource allocation.
Memory usage is displayed in bytes or appropriate units (KB, MB, GB) based on the scale of usage.