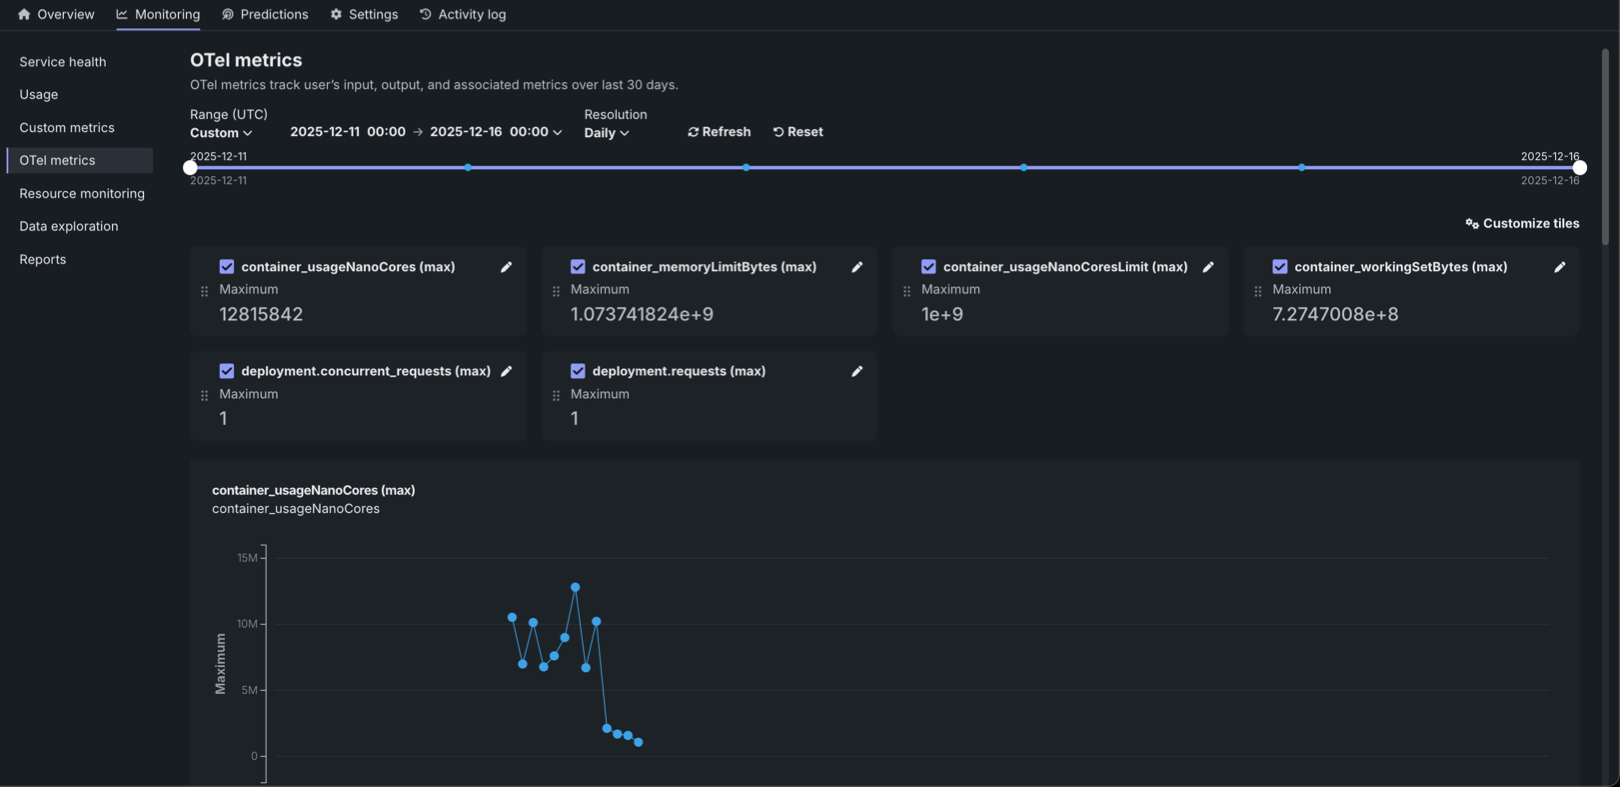
OTel metrics
The OTel metrics tab provides comprehensive OpenTelemetry (OTel) metrics monitoring capabilities for your deployment, enabling centralized observability by visualizing external metrics from your applications and agentic workflows alongside DataRobot's native metrics, all in OTel-compliant format for export to third-party observability tools.
Access and retention
OTel metrics are available for all deployment and target types. Only users with Owner and User roles on a deployment can view and configure these metrics. Metrics data is stored for a retention period of 30 days, after which it is automatically deleted.
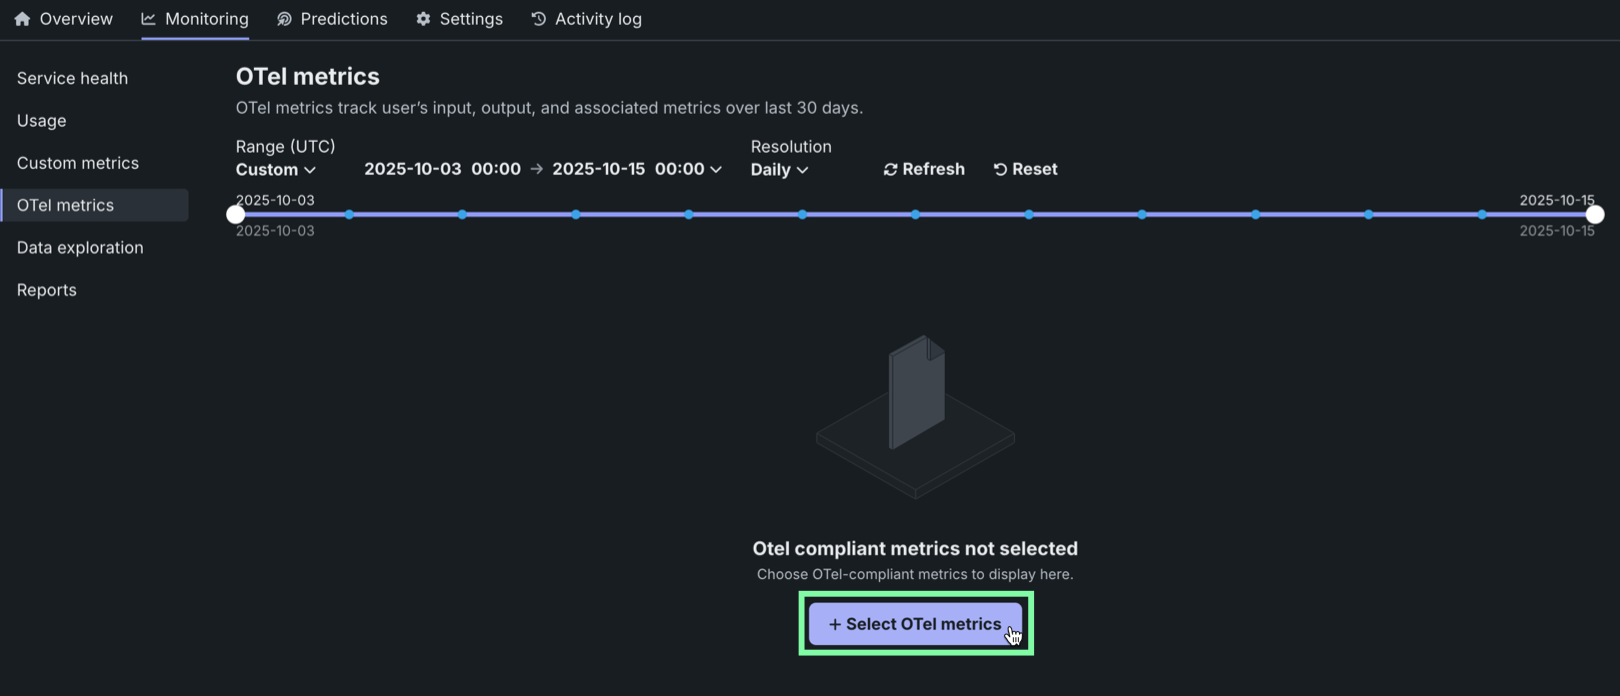
To access OTel metrics for a deployment, on the Deployments tab, locate and click the deployment, click the Monitoring tab, and then click OTel metrics.
Select OTel metrics
The OTel metrics tab can display up to 50 metrics. A customization dialog box displays all available metrics and supports searching by metric name. From this list, select the most important metrics for the dashboard.
To select an OTel metric:
-
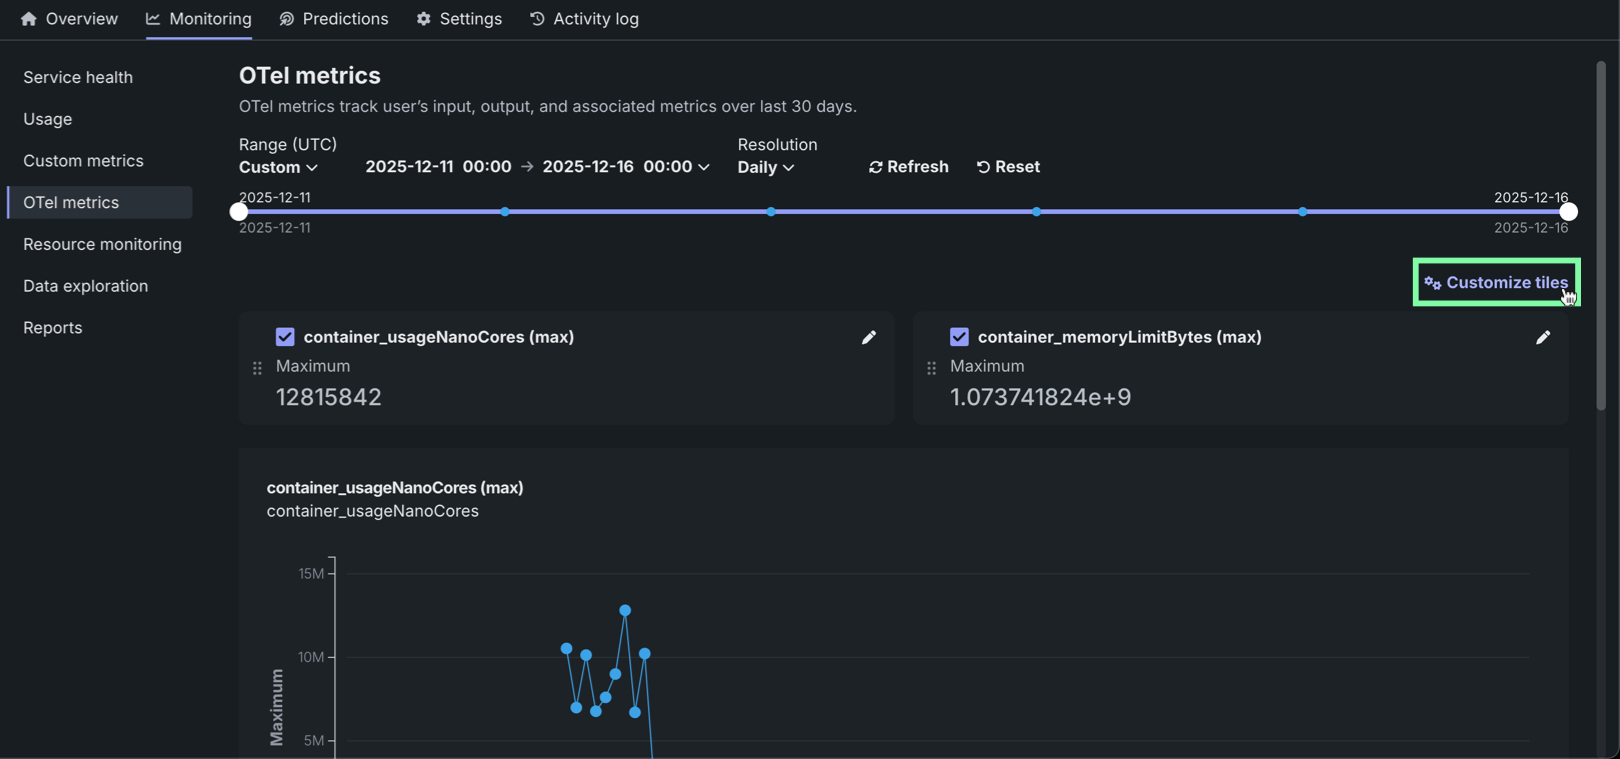
On the Monitoring > OTel metrics tab, click + Select OTel metrics (or Customize tiles if metrics are already added).
-
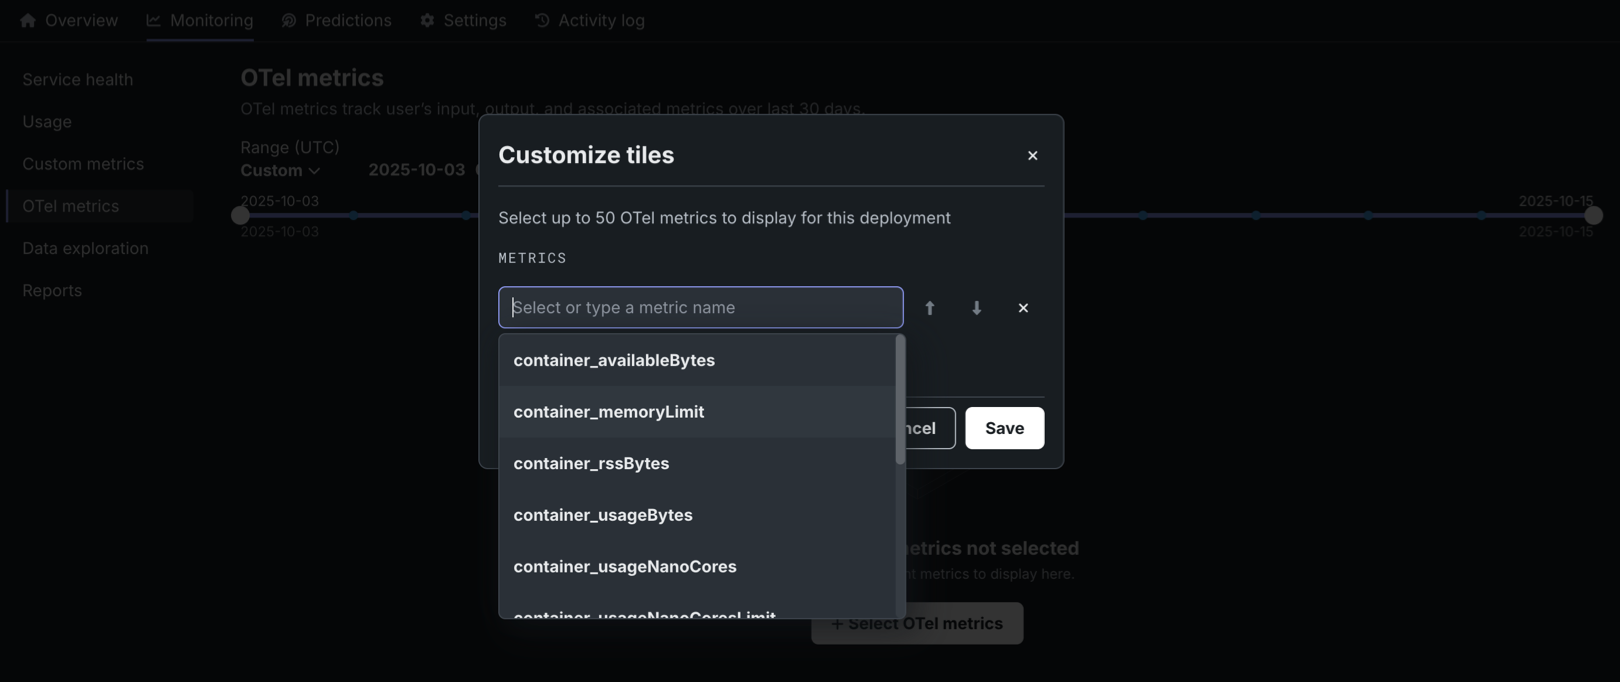
In the Customize tiles dialog box, in the Metrics list, do any of the following:
-
Select a metric from the dropdown list.
-
Search for a metric.
-
Enter a unique name associated with a metric available to the deployment. If data appears for this metric, the metric values are populated on the dashboard.
-
-
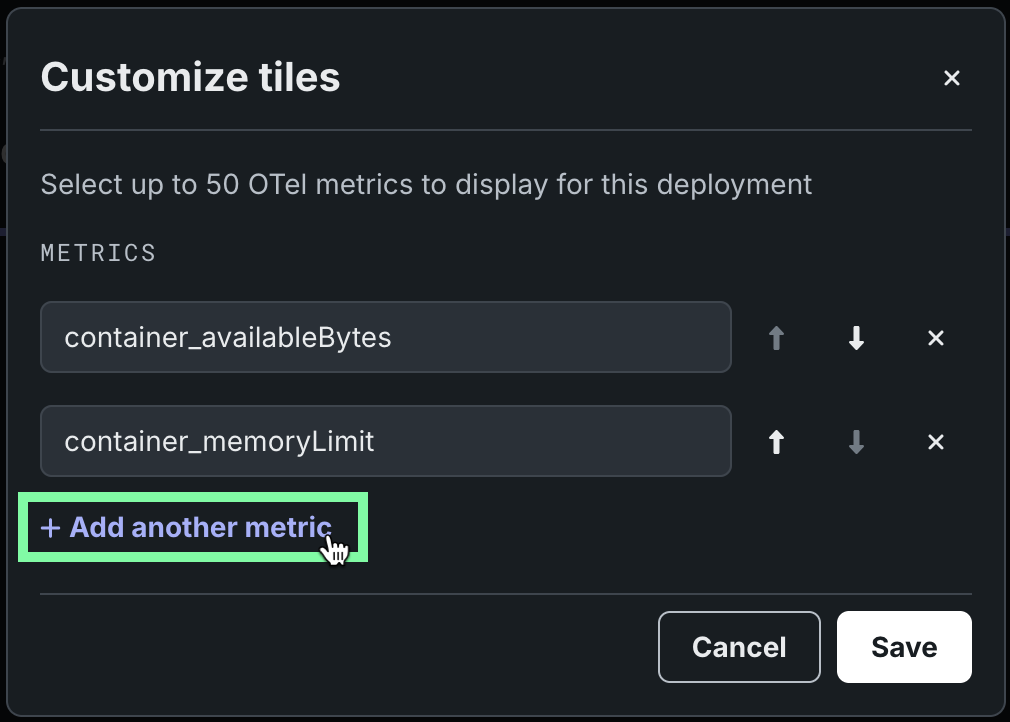
To add more metrics, click + Add another metric and repeat the step above. Select up to 50 OTel metrics to display for the deployment.
Remove and reorder metrics
Click the up arrow and down arrow icons to reorder the metrics on the dashboard. Click the remove icon to remove a metric from the dashboard.
-
Click Save to update the OTel metrics dashboard configuration and review the metric visualizations.
Supported time resolution settings
The supported time resolution settings for OTel metric visualization are minute, hour, or day.
Edit OTel metrics
The OTel metrics tab enables the customization of how individual metrics are displayed and aggregated on your monitoring dashboard. After selecting metrics to monitor, fine-tune their presentation by editing display names, choosing aggregation methods, and toggling between trend charts and summary values.
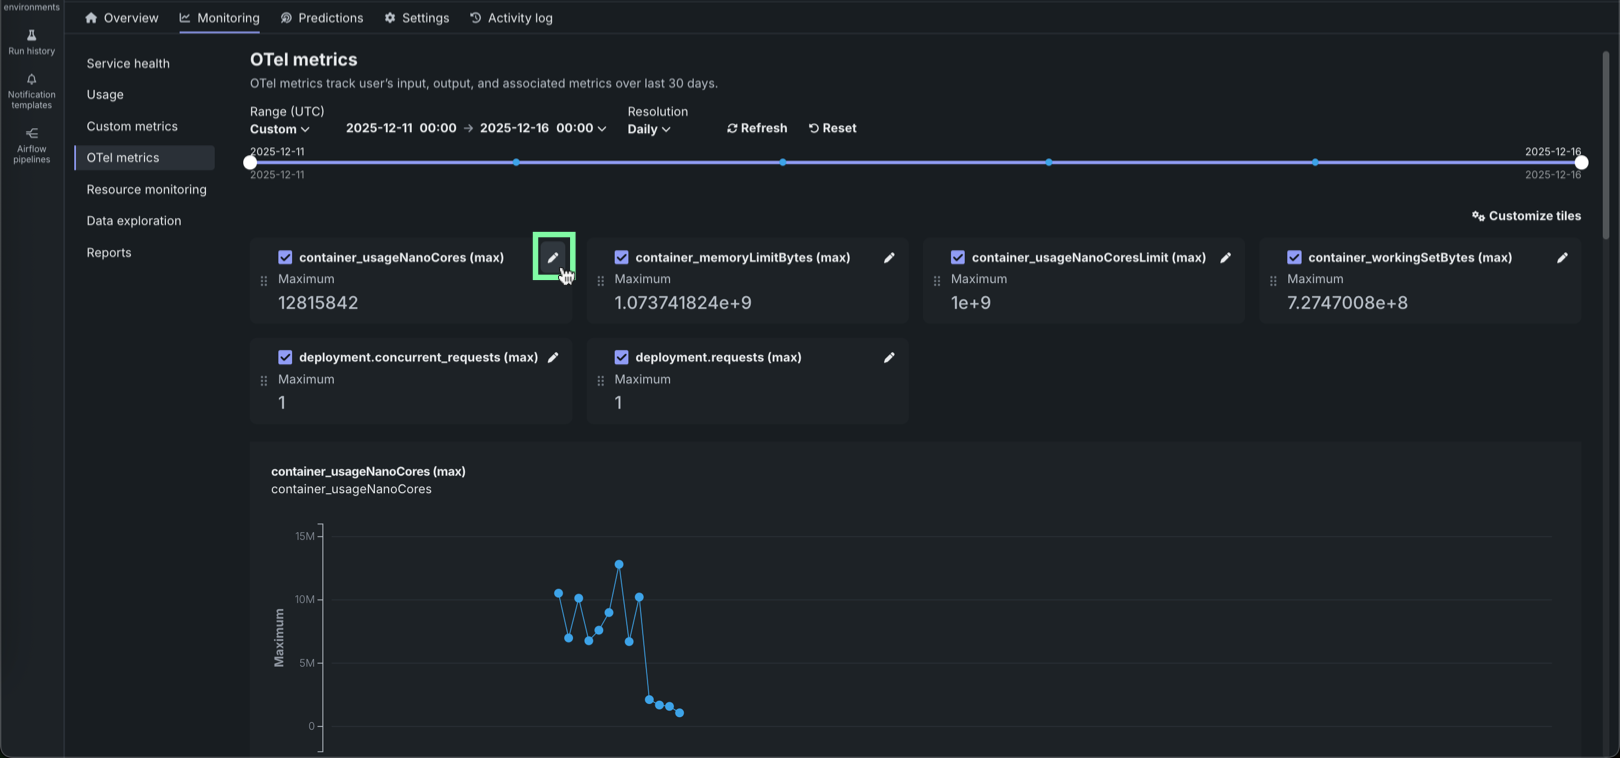
To edit an OTel metric:
-
On the Monitoring > OTel metrics tab, with metrics already added, click the edit icon in the upper-right corner of a tile.
-
In the Edit metric dialog box, configure the following settings:
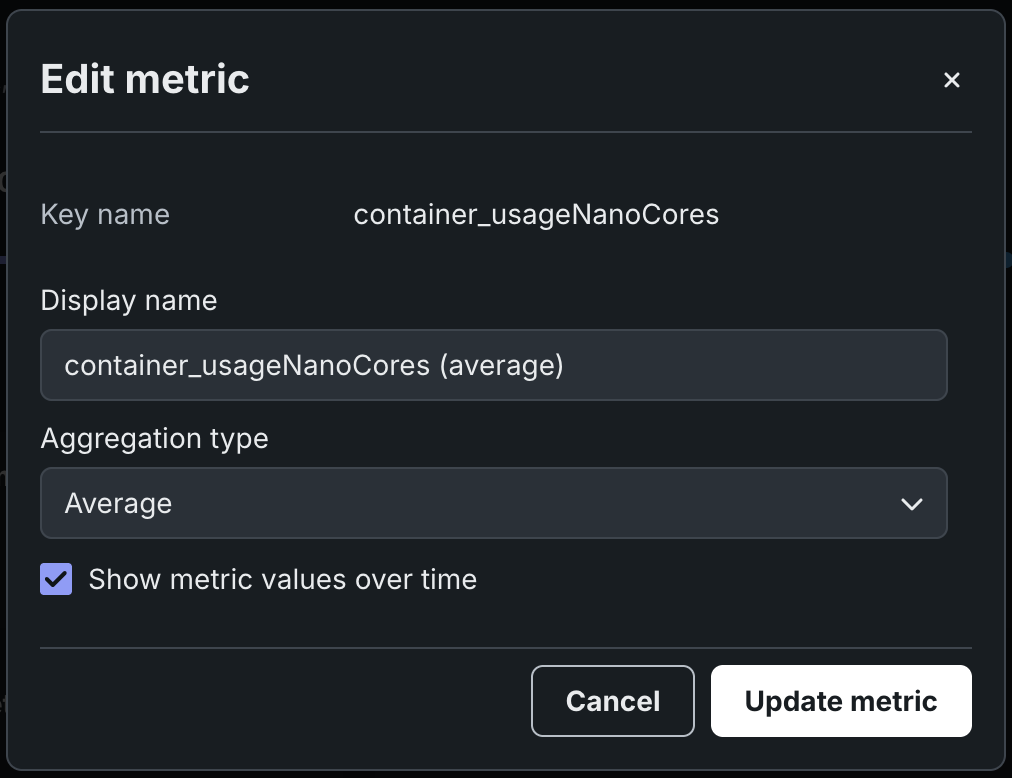
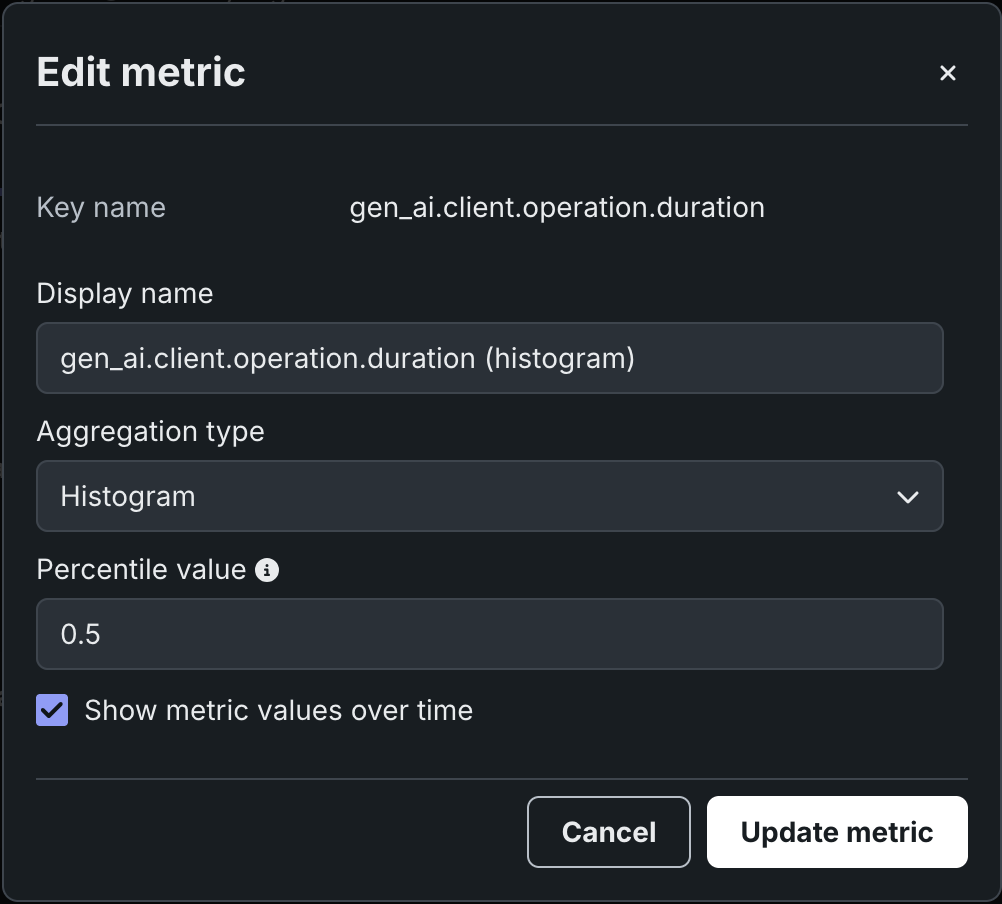
Setting Description Display name Defines the name displayed on the dashboard tile and chart. The original name is preserved as the Key name, or the name defined in the monitored system. Aggregation type Sets the mathematical method for summarizing OTel metric data points across a given time period. The default aggregation depends on the metric type: Histogram (default for histograms) or Average (default for counters/gauges). Available aggregation methods: - Histogram: Displays the distribution of values as a histogram.
- Percentile: Calculates percentile values from the metric data.
- Average: The average of all reported values for the metric within the time period.
- Sum: The total of all reported values for the metric within the time period.
- Minimum: The lowest value reported for the metric within the time period.
- Maximum: The highest value reported for the metric within the time period.
Percentile (Available when Histogram or Percentile aggregation type is selected) Specifies the percentile value to calculate, ranging from 0 to 1. The default value is 0.5 (50th percentile). Show metric values over time Toggle the display of an OTel metric between an "over time" chart for trend analysis and a single, summarized numeric value for an at-a-glance summary. When this setting is disabled, the chart cannot be displayed. -
To save the new metric settings, click Edit.