Deployments dashboard
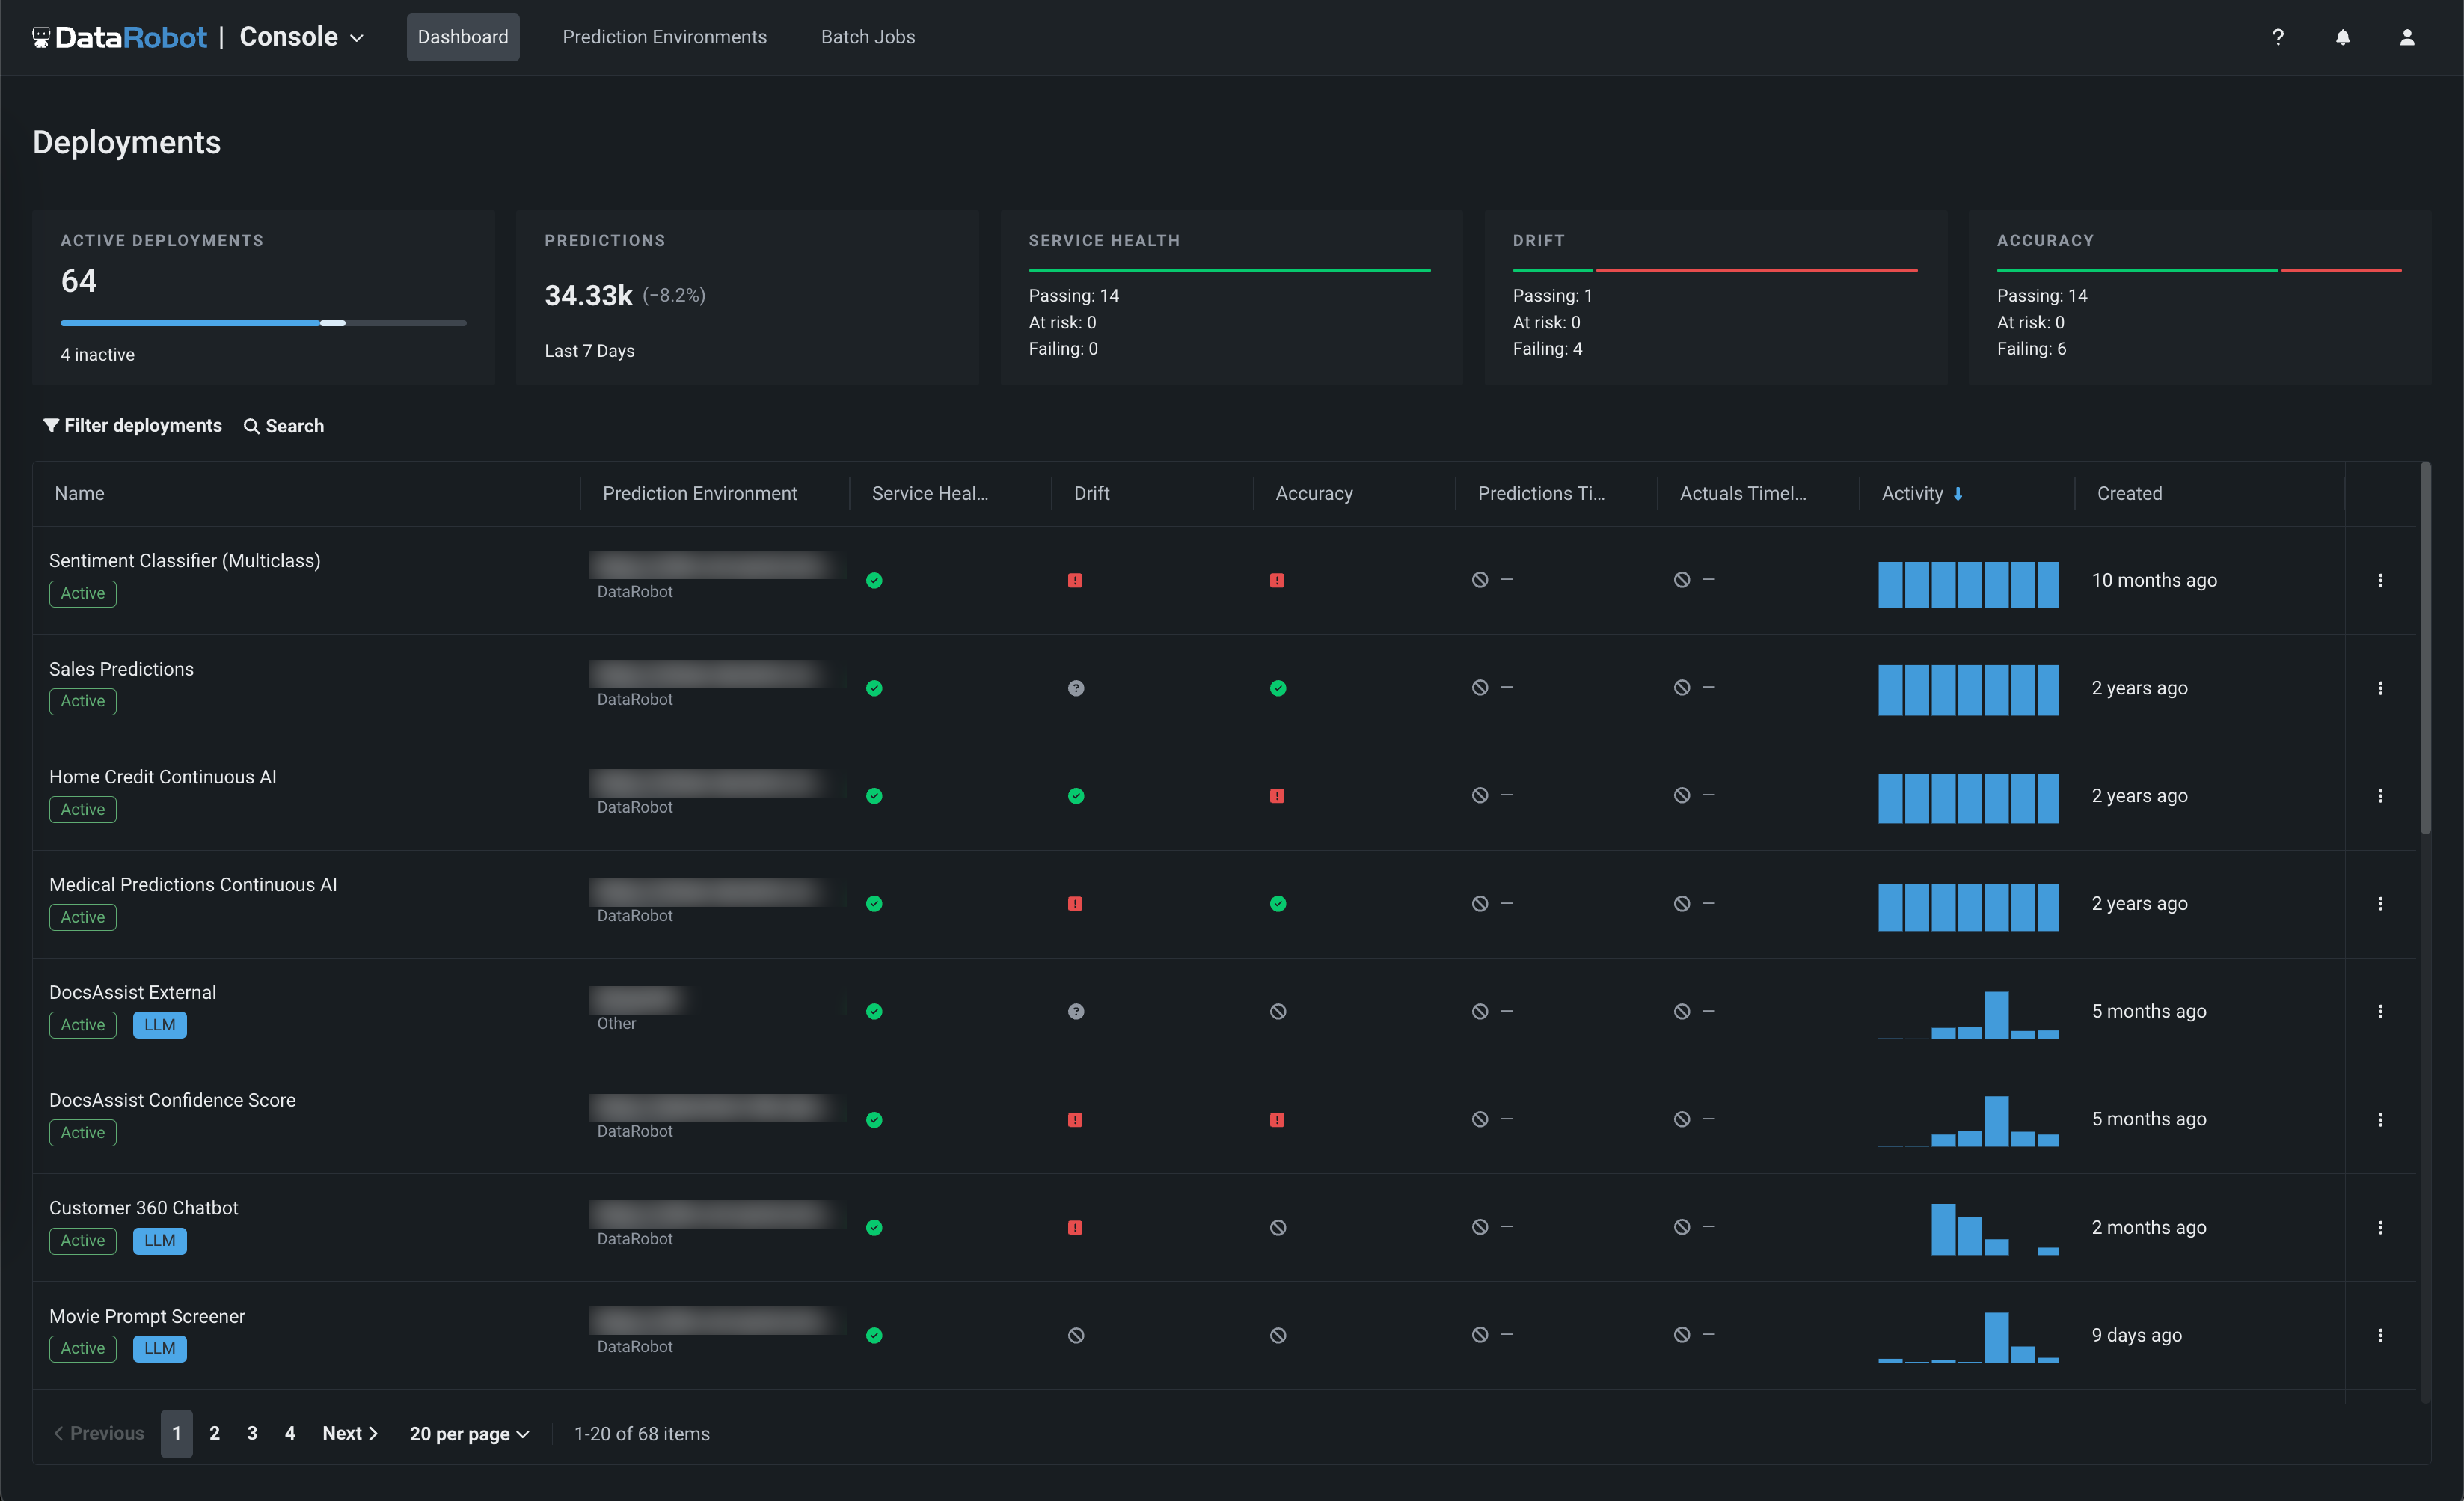
Once models are deployed, the Deployments dashboard is the central hub for deployment management activity. It serves as a coordination point for all stakeholders involved in bringing models into production. From the dashboard, you can monitor deployed model performance and take action as necessary, as it provides an interface to all actively deployed models.
Deployment access
To access a deployment in the table on the Deployments dashboard, you must have User or Owner permissions for that deployment. Consumer access is strictly for making predictions.
In the top row of the Deployments tab, you can review a summary of your entire inventory of deployments at a glance. The tiles in this row summarize the following information:
| Tile | Description |
|---|---|
| Active Deployments | Indicates the number of deployments currently in use. In the progress bar, active deployments are displayed in blue, all other active deployments are displayed in white, and available new deployments are displayed in gray. Inactive deployments are displayed below the progress bar and do not count toward the allocated limit. |
| Predictions | Indicates the number of predictions made since the last refresh. |
| Service Health | Indicates the total number of deployments with each type of health status (passing, at risk, and failing) for service health monitoring. |
| Drift | Indicates the total number of deployments with each type of health status (passing, at risk, and failing) for data drift monitoring. |
| Accuracy | Indicates the total number of deployments with each type of health status (passing, at risk, and failing) for accuracy monitoring. |
Dashboard update frequency
The Deployments dashboard automatically refreshes every 30 seconds, updating the deployment indicators and prediction information.
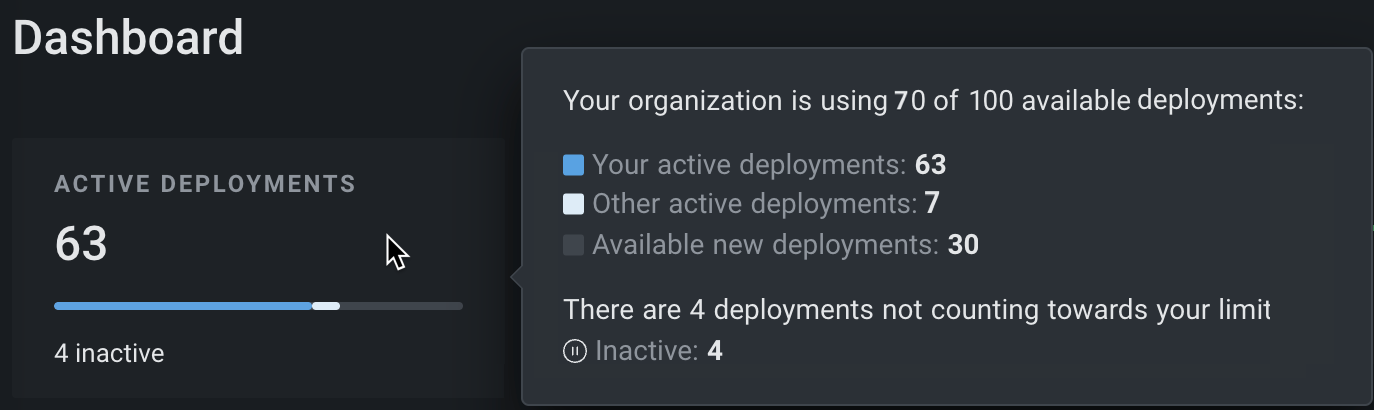
Hover on the Active Deployments tile to get more information about the deployments in the Console. In the example below, the user's organization is allotted 100 deployments. The user has 63 active deployments, and seven other deployments are active in the organization. Users within the organization can create 30 more active deployments before reaching the limit. This organization has two Inactive deployments and two Vector database deployments not counted towards the deployment limit:
Deployments not counted against the deployment limit
The following types of deployments do not count against the deployment limit:
-
Inactive: Inactive deployments do not count toward the deployment limit and do not support predictions, retraining, challengers, or model replacement.
-
Vector database: Vector database deployments, active or inactive, do not count toward the deployment limit.
-
Other organizations: If you're active in multiple organizations, your deployments in Other organizations do not count toward the limit in the current organization.
The Active Deployments tile indicates that inactive and vector database deployments don't count against the deployment limit, as shown in the example above. Under Your active deployments, you can see how many are in This organization versus Other organizations.
Vector database deployments
Vector database deployments are a premium feature and require GenAI experimentation. Contact your DataRobot representative or administrator for information on enabling this feature.
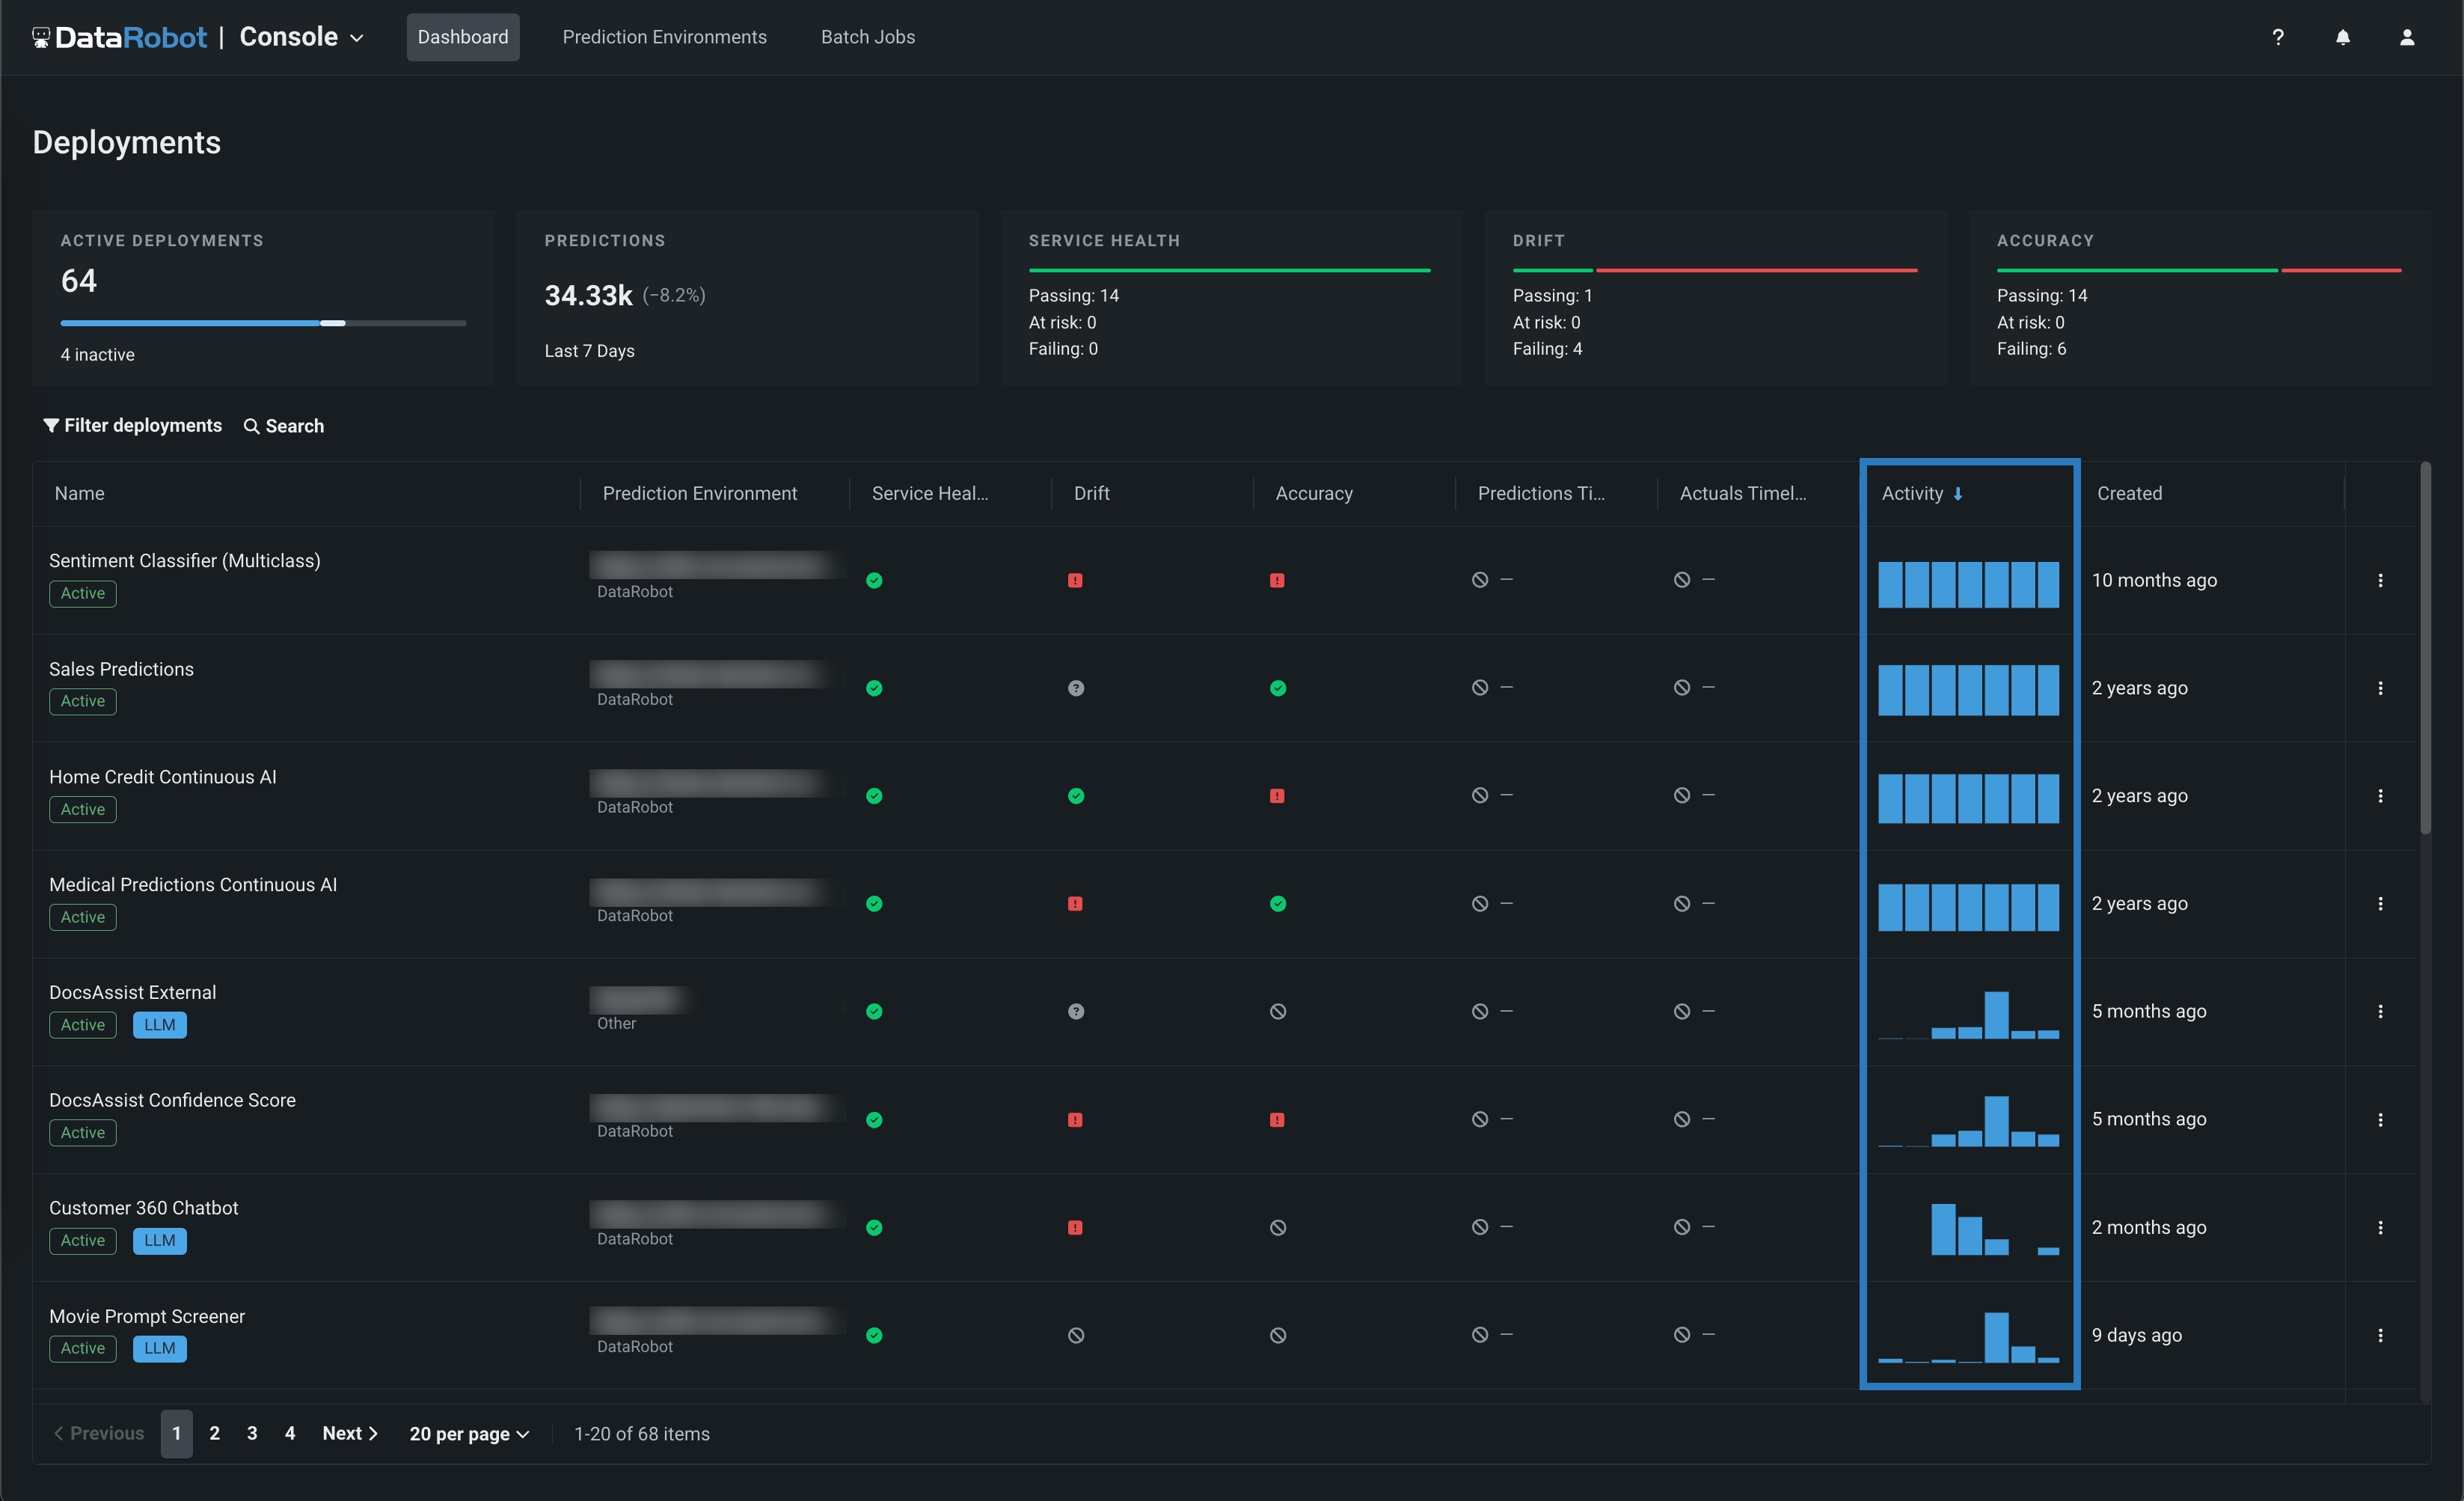
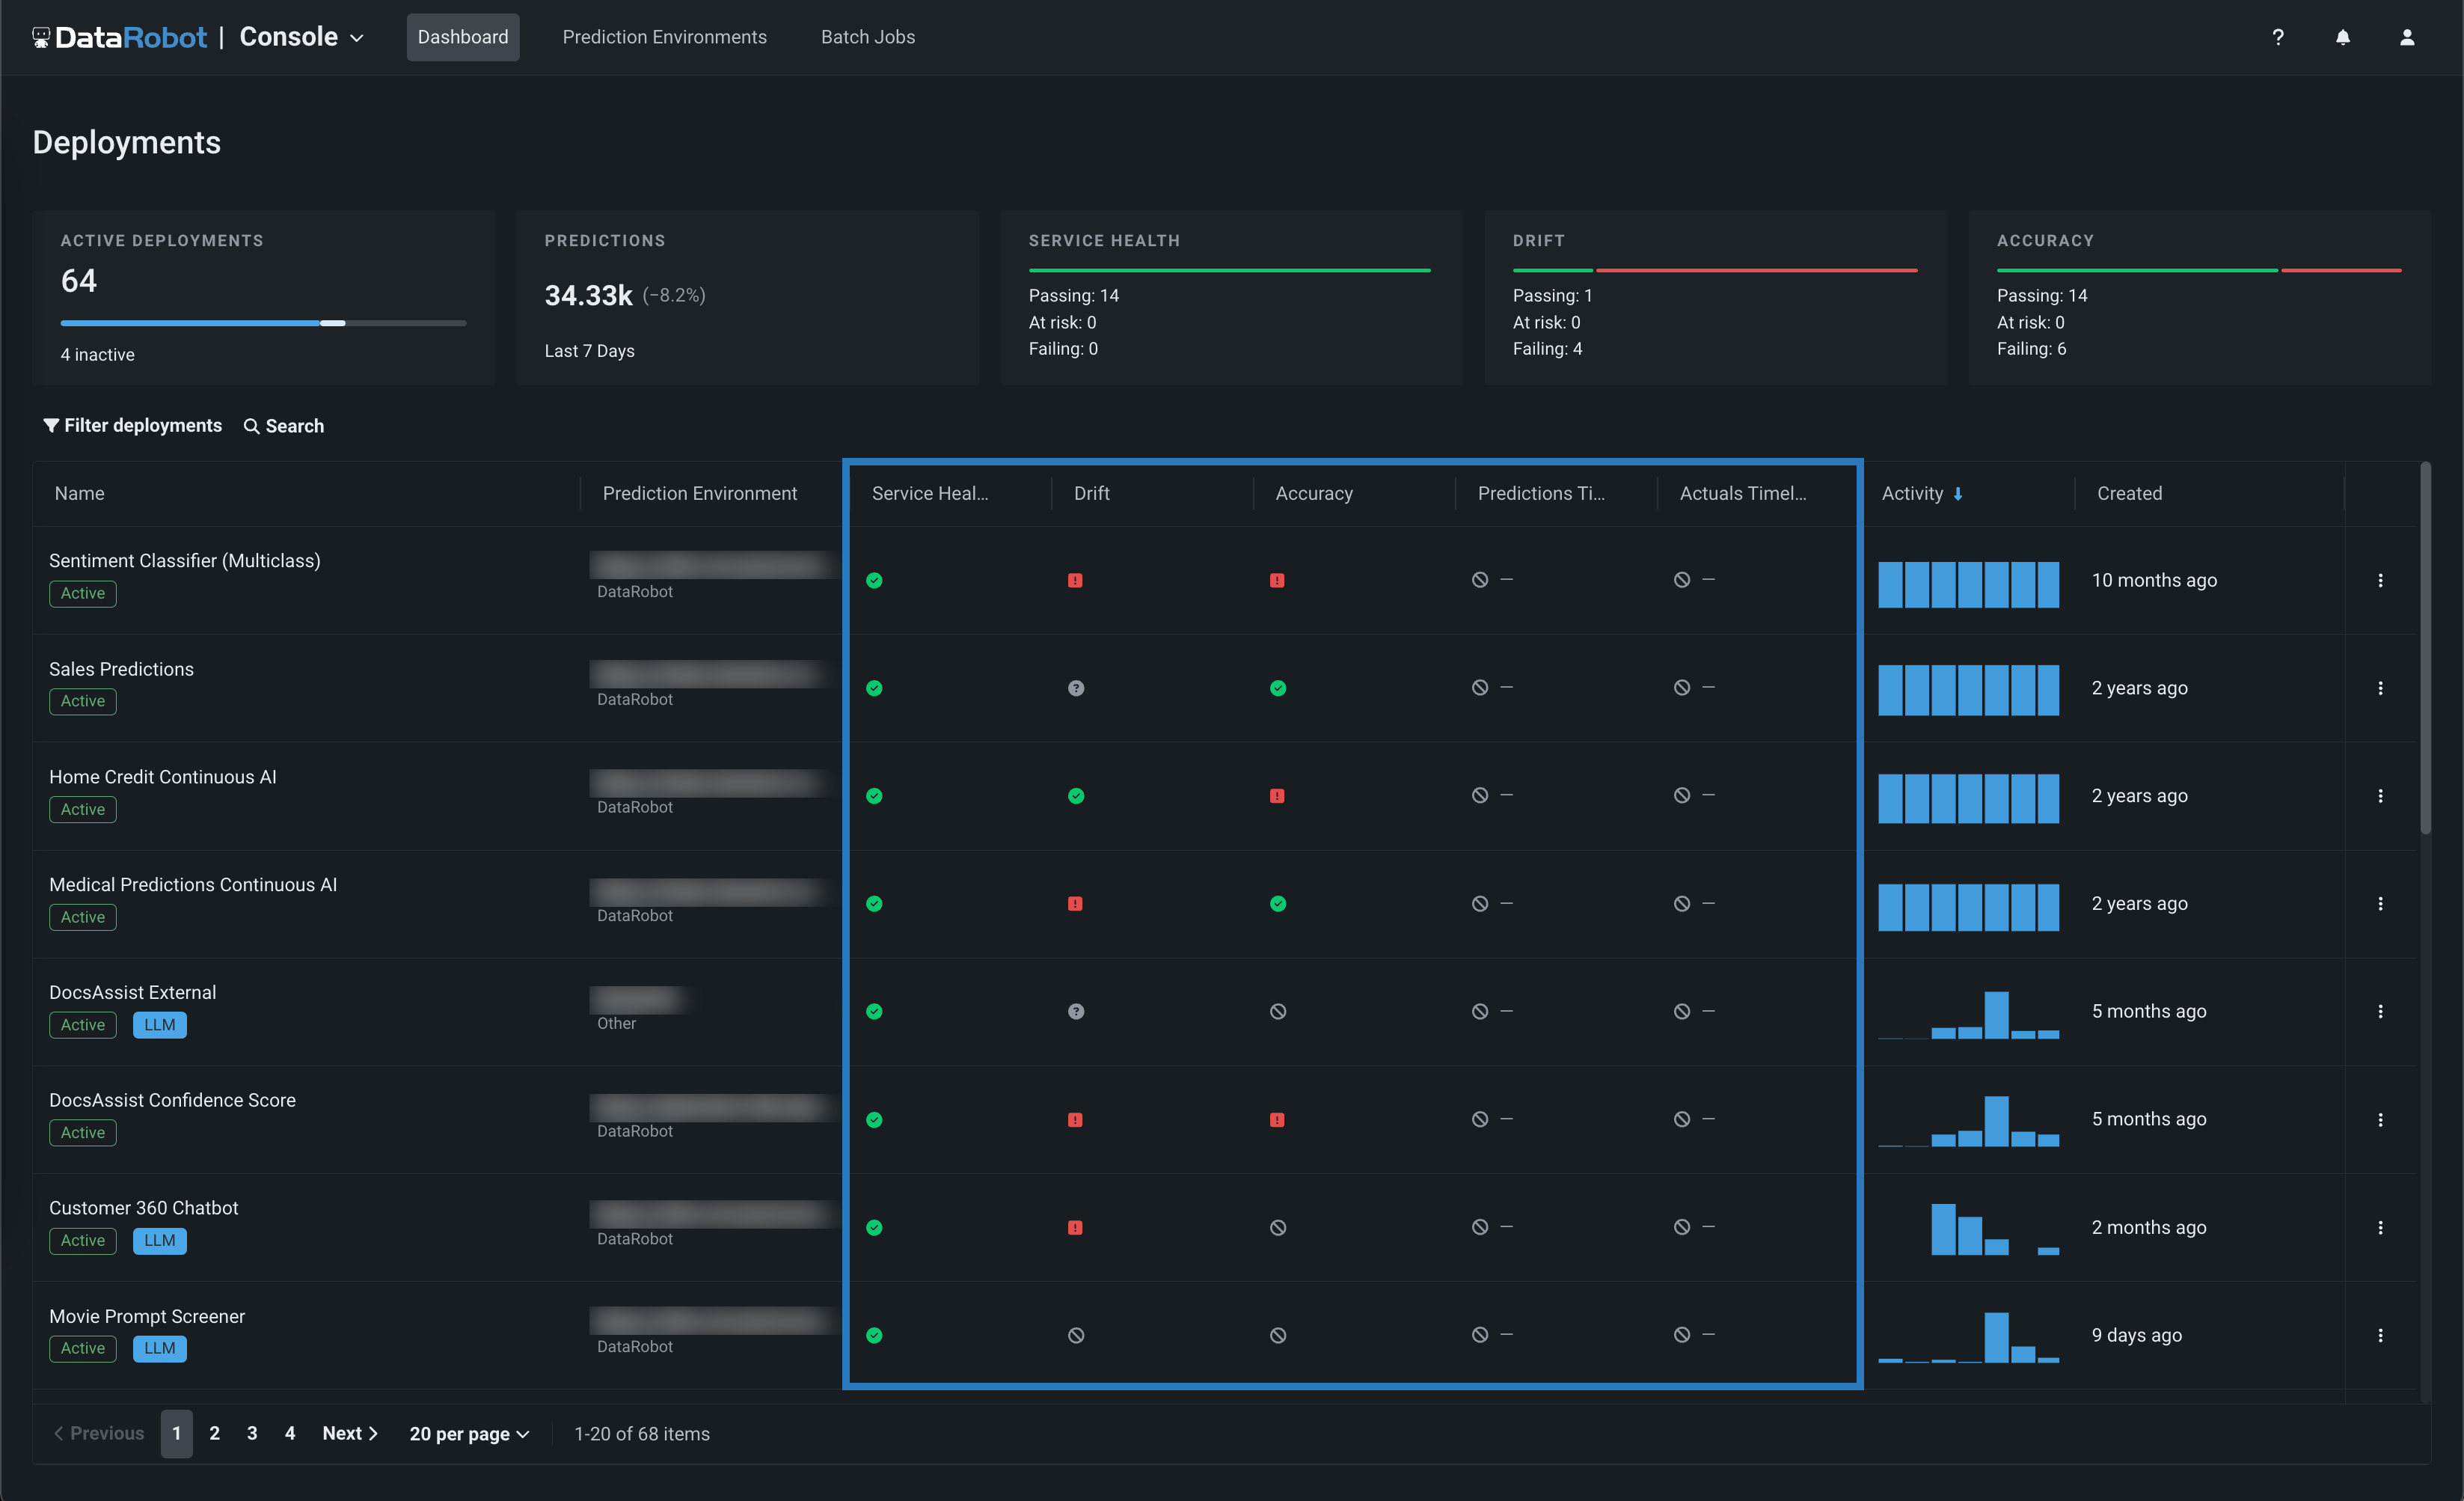
Deployment columns
The deployment inventory contains a variety of deployment information in the table below the summary tiles. This table is initially sorted by the most recent creation date (reported in the Created column). You can click a different column title to sort by that metric instead. A blue arrow appears next to the sort column's title, indicating if the order is ascending or descending.
Sort order persistence
When you sort the deployment inventory, your most recent sort selection persists in your local settings until you clear your browser's local storage data. As a result, the deployment inventory is usually sorted by the column you selected last.
You can sort in ascending or descending order by:
| Column | Sorting method |
|---|---|
| Deployment | In alphabetical order by deployment name. |
| Service health, Drift, Accuracy, Fairness | In order of severity by status (for example, descending order proceeds from failing, to at risk, to passing). |
| Prediction timeliness, Actuals timeliness | In order of severity by status (for example, descending order proceeds from failing to passing). |
| Predictions | In numerical order by the average number of predictions per day. |
| Importance | In order of the deployment's assigned importance level. |
| Created. Model age, Last prediction | In chronological order. |
Secondary sort
The list is sorted secondarily by the time of deployment creation (unless the primary sort is by Created). For example, if you sorted by drift status, all deployments whose status is passing would be ordered from most recent creation to oldest, followed by failing deployments most recent to oldest.
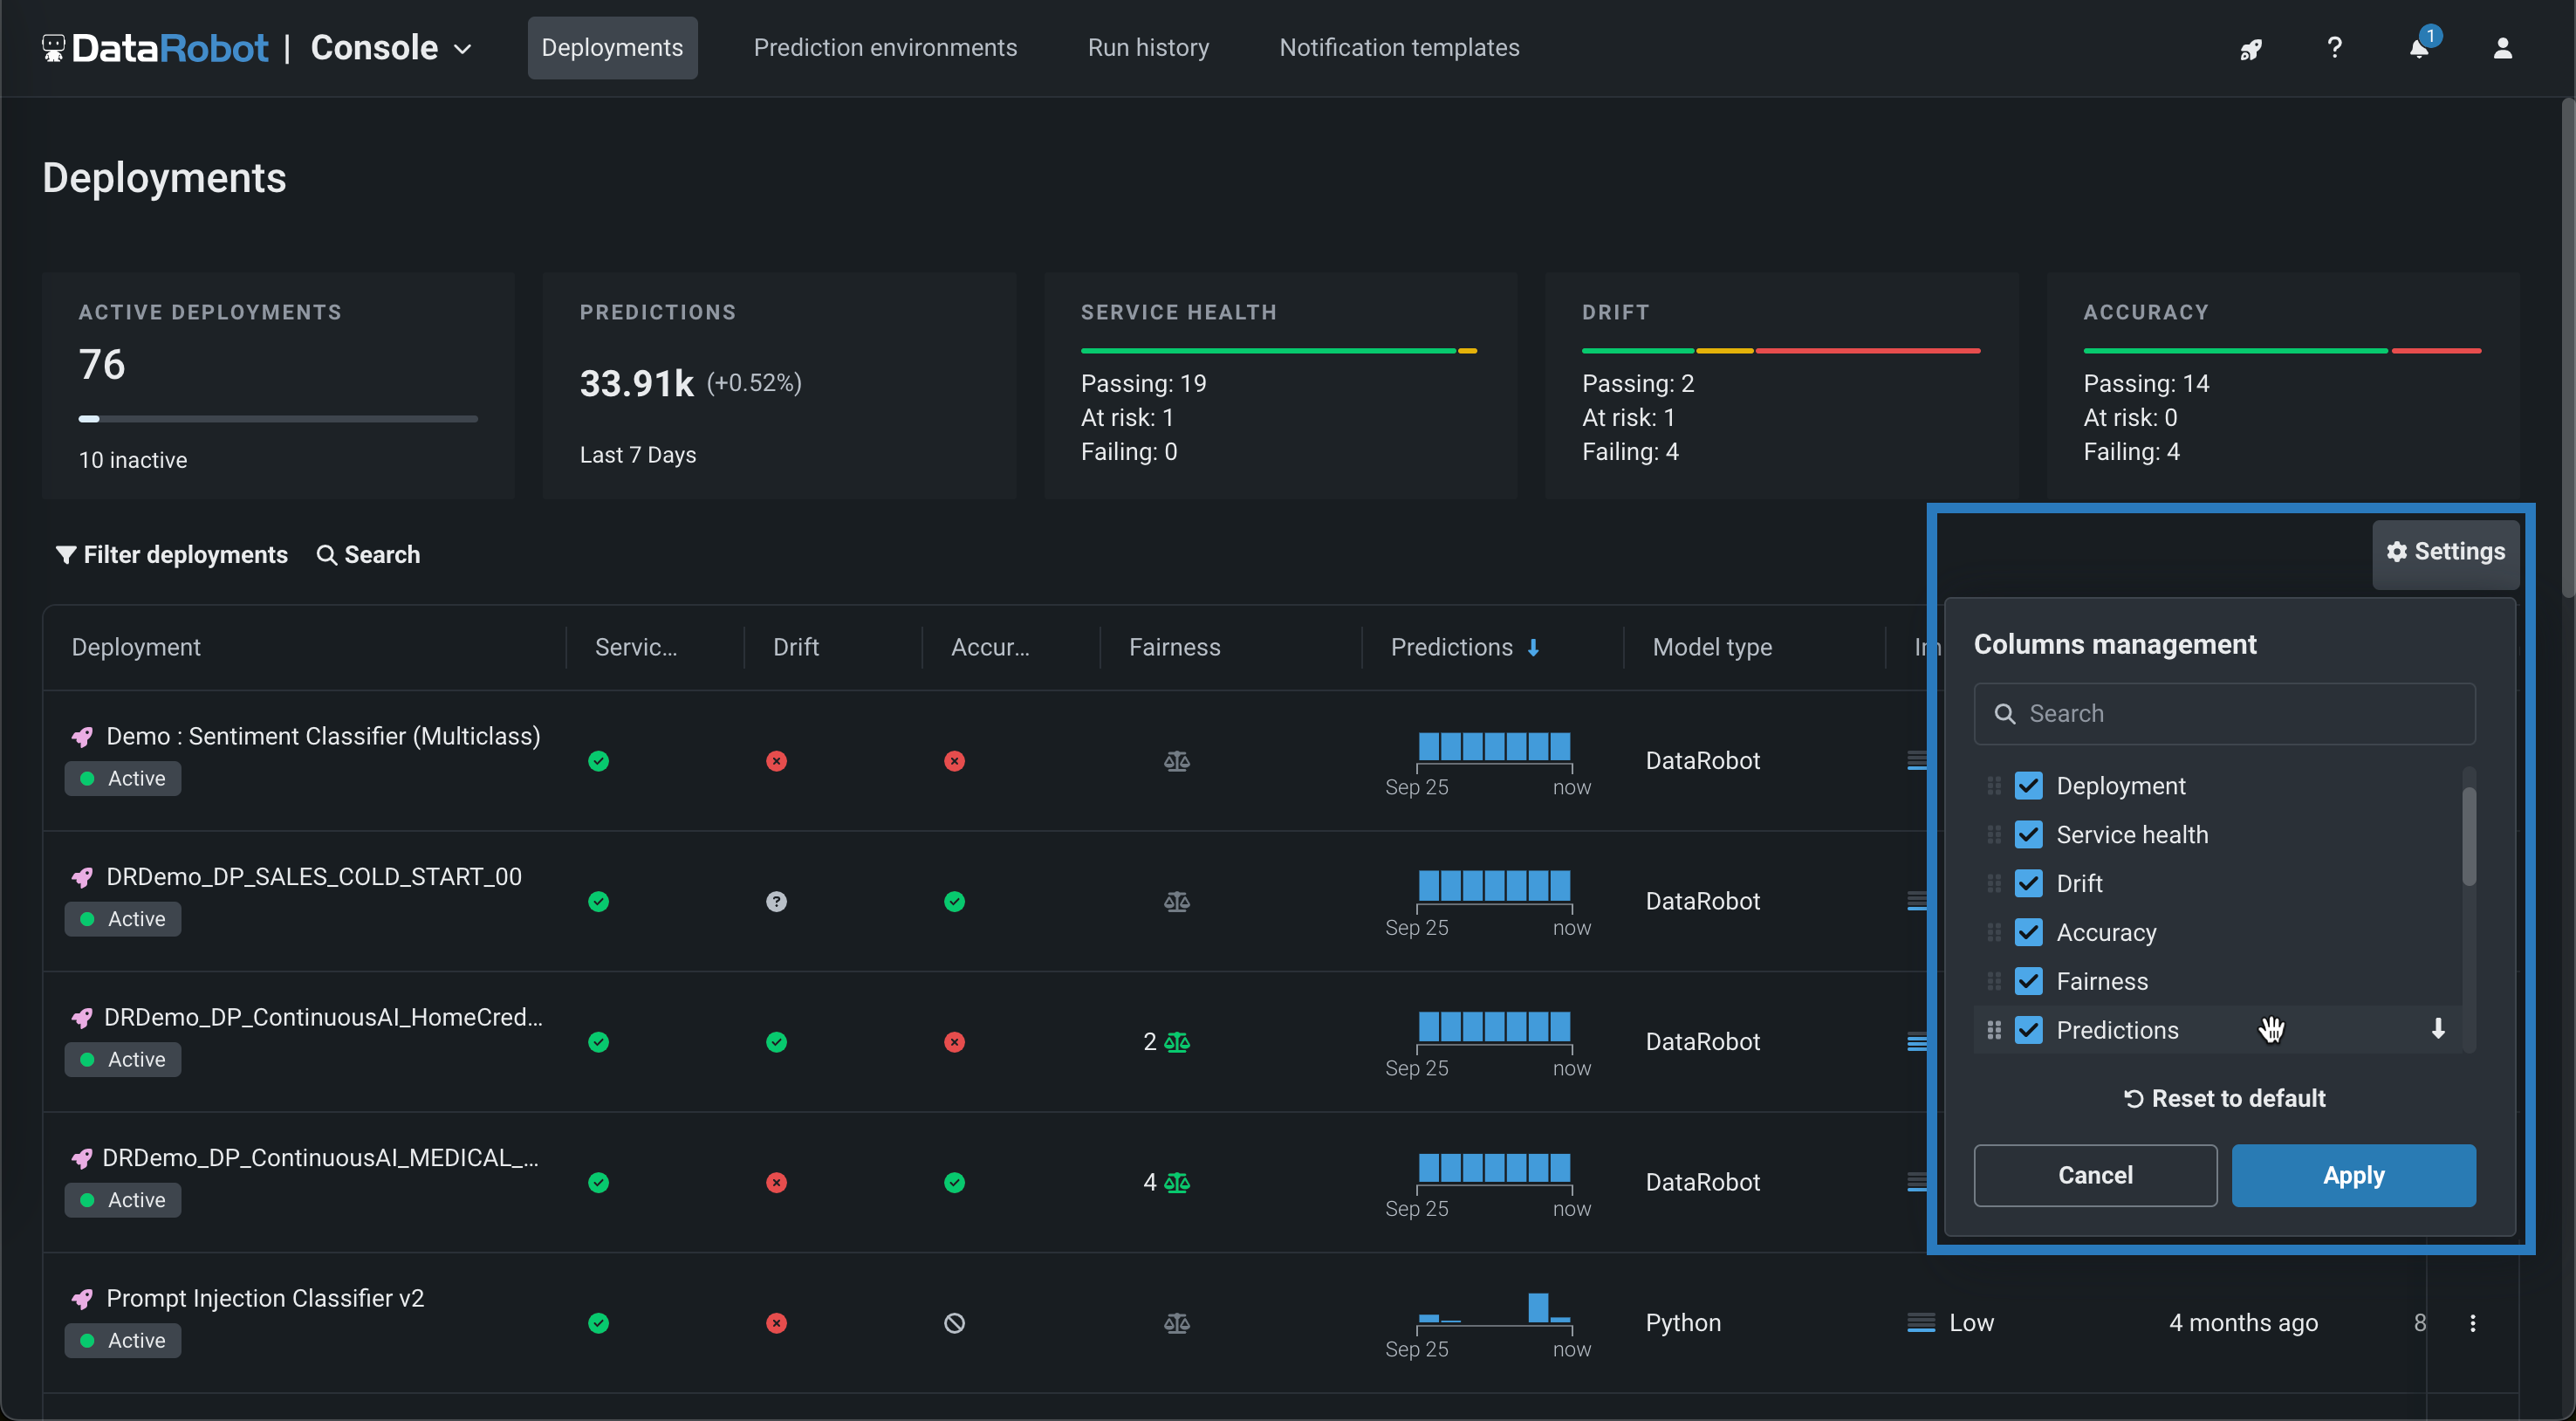
In addition, you can click Settings to configure the information displayed on the Deployments dashboard. In the Columns management menu, you can:
-
Search for a column: Click the Search box and type a column name to locate that column in the settings menu.
-
Display or hide columns: Select the checkbox for a column to show the column on the Deployments dashboard or clear the checkbox to hide a column from the Deployments dashboard.
-
Arrange the displayed columns: Click the icon on the column name (or the column name itself) to drag the row to a new location in the list, rearranging the columns on the Deployments dashboard.
-
Select the default sort order: Click the arrow icon ( / descending or / ascending) to the right of a column name to set the Dashboard's default sort.
-
Reset the Deployments dashboard columns: Click Reset to default to return the Dashboard's column layout to the default configuration.
Health indicators
The Service Health, Data Drift, and Accuracy summaries in the top part of the display provide an at-a-glance indication of health and accuracy for all deployed models. To view this more detailed information for an individual model, click on the model in the inventory list:
What does the Service Health tile report?
The Service Health tile measures the following error types recorded over the last 24 hours for an individual model on the Monitoring > Service health tab:
- 4xx errors indicate problems with the prediction request submission.
- 5xx errors indicate problems with the DataRobot prediction server.
If you've enabled timeliness tracking on the Settings > Usage tab, you can view timeliness indicators in the inventory. Timeliness indicators show if the prediction or actuals upload frequency meets the standards set by your organization.
Use the table below to interpret the color indicators for each deployment health category:
| Color | Service Health | Data Drift | Accuracy | Timeliness | Action |
|---|---|---|---|---|---|
| Green / Passing | Zero 4xx or 5xx errors. | All attributes' distributions have remained similar since the model was deployed. | Accuracy is similar to when the model was deployed. | Prediction and/or actuals timeliness standards met. | No action needed. |
| Yellow / At risk | At least one 4xx error and zero 5xx errors. | At least one lower-importance attribute's distribution has shifted since the model was deployed. | Accuracy has declined since the model was deployed. | N/A | Concerns found but no immediate action needed; monitor. |
| Red / Failing | At least one 5xx error. | At least one higher-importance attribute's distribution has shifted since the model was deployed. | Accuracy has severely declined since the model was deployed. | Prediction and/or actuals timeliness standards not met. | Immediate action needed. |
| Gray / Disabled | Unmonitored deployment. | Data drift tracking disabled. | Accuracy tracking disabled. | Timeliness tracking disabled. | Enable monitoring and make predictions. |
| Gray / Not started | No service health events recorded. | Data drift tracking not started. | Accuracy tracking not started. | Timeliness tracking not started. | Make predictions. |
| Gray / Unknown | No predictions made. | Insufficient predictions made (min. 100 required). | Insufficient predictions made (min. 100 required). | N/A | Make predictions. |
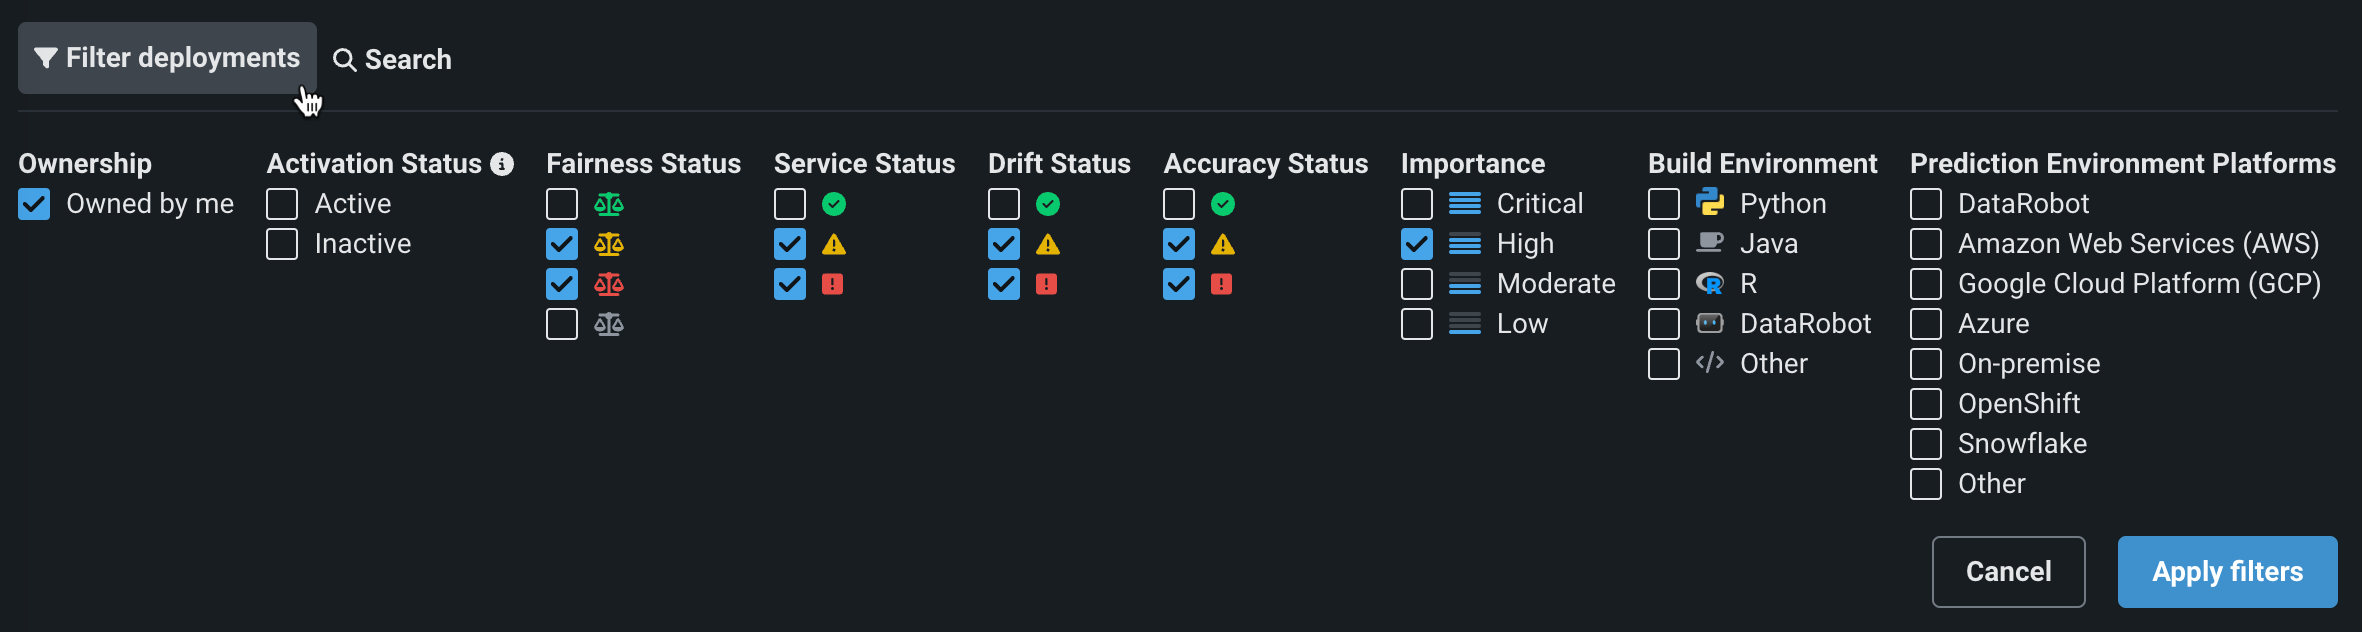
Filter deployments
To filter the deployment inventory, click Filter deployments at the top of the Deployments dashboard. The filter menu opens, allowing you to select one or more criteria to filter the deployment list:
| Filter | Description |
|---|---|
| Ownership | Filters by deployment owner. Select Owned by me to display only those deployments for which you have the owner role. |
| Creation | Filters by deployment creator. Select Created by me to display only the deployments you created. |
| Activation status | Filters by deployment activation status. Active deployments are able to monitor and return new predictions. Inactive deployments can only show insights and statistics about past predictions. |
| Tags | Filters by tags defined on the deployment Overview page |
| Prediction environment tags | Filters by tags on the prediction environment associated with each deployment. This is separate from the Tags filter, which uses deployment-level tags. Autocomplete helps you pick tag keys and values that already exist. When you select multiple tag pairs, deployments are included if their prediction environment matches any of the selected tags, using exact key-value matching. |
| Service health | Filters by deployment service health status. Choose to filter by passing , at risk , failing , unknown , and not started . If a deployment has never had service health enabled, then it will not be included when this filter is applied. |
| Data drift | Filters by deployment data drift status. Choose to filter by passing , at risk , failing , unknown , and not started . If a deployment previously had data drift enabled and reported a status, then the last-reported status is used for filtering, even if you later disabled data drift for that deployment. If a deployment has never had drift enabled, then it will not be included when this filter is applied. |
| Accuracy | Filters by deployment accuracy status. Choose to filter by passing , at risk , failing , unknown , and not started . If a deployment does not have accuracy information available, it is excluded from results when you apply the filter. |
| Fairness | Filters by deployment fairness status. Choose to filter by passing , at risk , failing , unknown , and not started . |
| Predictions timeliness | Filters by predictions timeliness status. Choose to filter by passing , failing , disabled , or not started . |
| Actuals timeliness | Filters by actuals timeliness status. Choose to filter by passing , failing , disabled , or not started . |
| Importance | Filters by the criticality of deployments, based on prediction volume, exposure to regulatory requirements, and financial impact. Choices include Critical, High, Moderate, and Low. |
| Build environment | Filters by the environment in which the model was built: Python, Java, R, DataRobot, or Other. |
| Prediction environment platforms | Filters by the platform the prediction environment runs on: DataRobot, DataRobot Serverless, Amazon Web Services, Google Cloud Platform, Azure, On-premise, OpenShift, Snowflake, SAP AI Core, or Other. |
| Target type | Filters by the target type of the deployed model: Multiclass, Binary, Regression, Multilabel, Nonnegative, Unsupervised, Text Generation, Location, Unsupervised Clustering, Vector Database, Agentic Workflow, or MCP Server. |
| Model type | Filters by model type: DataRobot, External, or Custom Inference. |
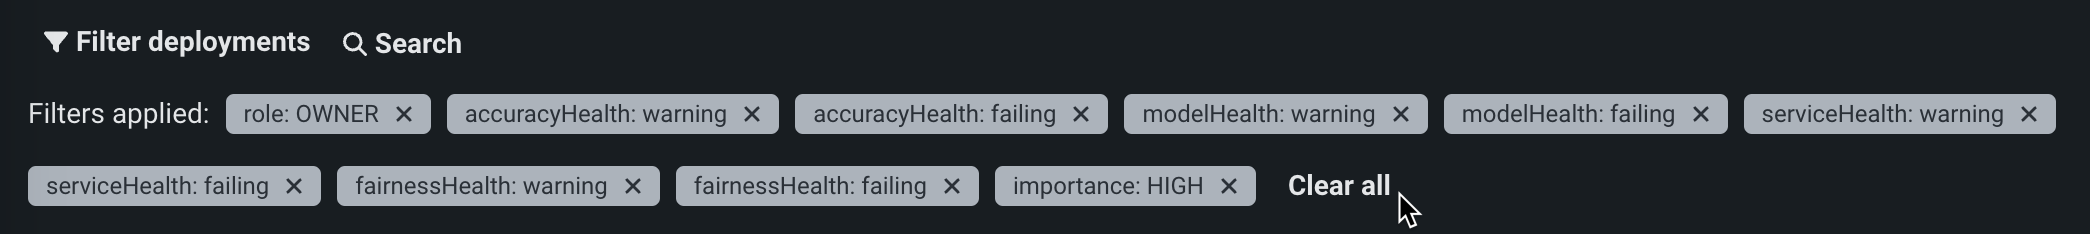
After selecting all desired filters, click Apply filters to update the deployment inventory. The Filter deployments button updates to indicate the number of filters applied. To remove your filters, click the Clear all button, or click x next to the badge for each filter you want to remove:
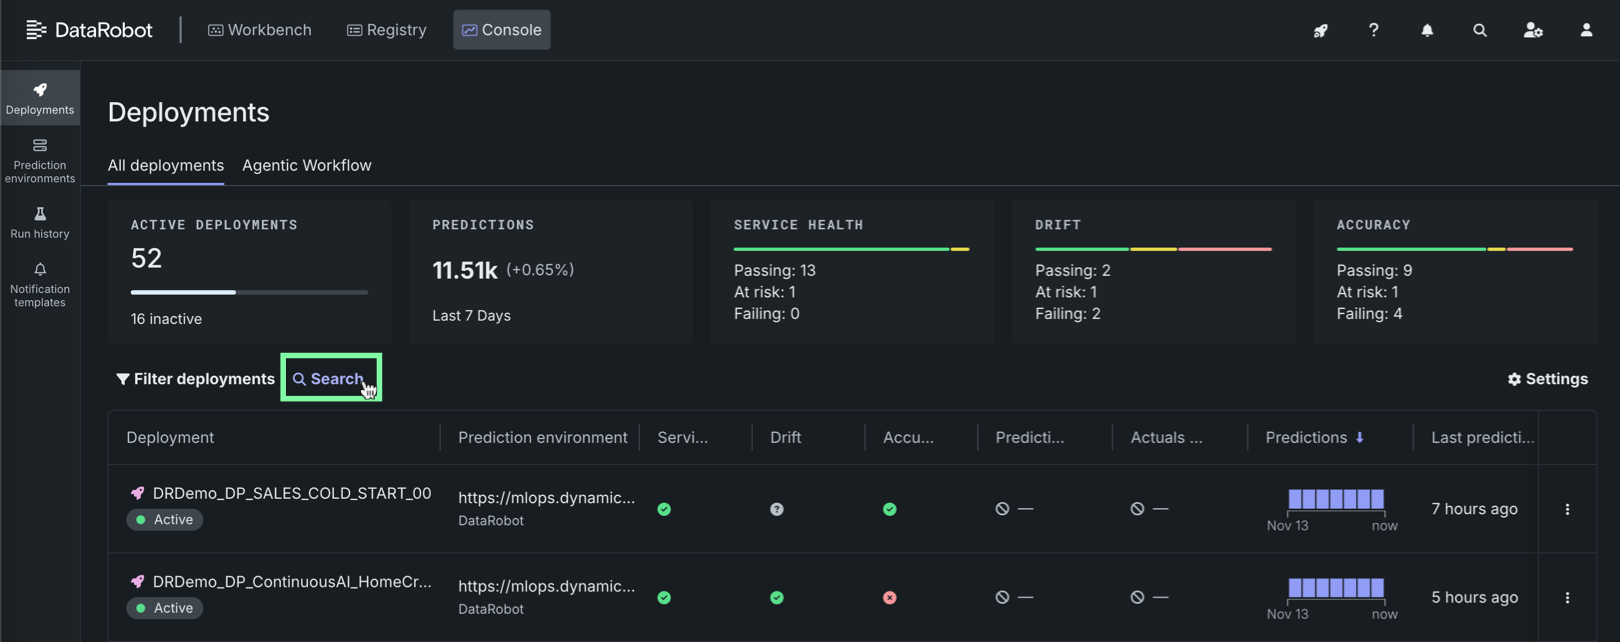
Search deployments
To search the deployment inventory, click Search at the top of the Deployments dashboard and enter a search term to filter the inventory on that term. The Deployments dashboard is searchable by deployment name, description, and ID.
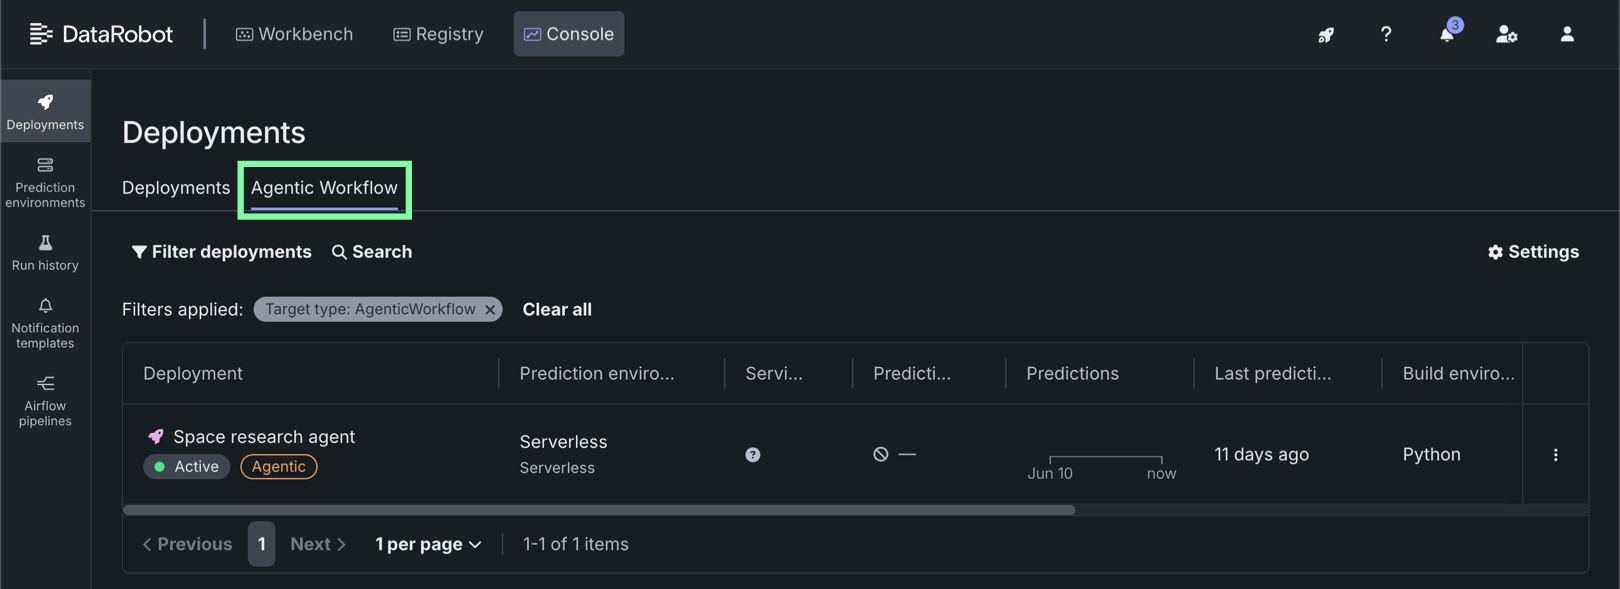
View agentic workflow deployments
Premium
Agentic workflows are a premium feature. Contact your DataRobot representative or administrator for information on enabling the feature.
To view all deployed agentic workflows in the console, on the Console > Deployments page, click the Agentic workflow tab:
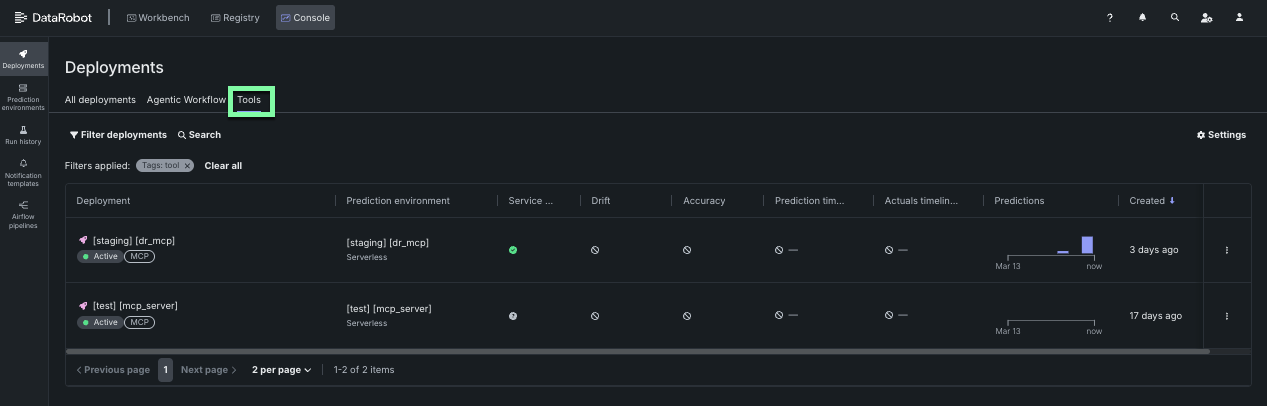
View agentic tools
To view all deployed agentic tools in the console, on the Console > Deployments page, click the Tools tab: