EDA insights
Exploratory Data Analysis (EDA) is DataRobot's approach to analyzing datasets and summarizing their main characteristics. There are two stages of EDA—EDA1 and EDA2. DataRobot runs EDA1 prior to modeling when a dataset is added to the Data Registry for the first time, and as part of EDA, generates summary statistics based on a sample of your data and assesses the All Features list to detect common data quality issues.
The following describes, in general terms, the DataRobot model building process for datasets under 1GB:
- Import a dataset to DataRobot, registering it in the Data Registry.
- DataRobot launches EDA1 (and automatically creates feature transformations if date features are detected).
- For Feature Discovery datasets, DataRobot:
- Loads secondary datasets.
- Discovers features from secondary datasets.
- Generates new features from the discovery.
- For Feature Discovery datasets, DataRobot:
- Upon completion of EDA1, insights are displayed on the Features tab of the data explore page.
Where can I view EDA2 insights?
Because EDA2 is target-aware, insights are only generated after setting up and running an experiment with a dataset. The only exception is the Feature lineage insight for Feature Discovery datasets.
EDA1
DataRobot calculates EDA1 on up to 500MB of your dataset, after any applicable conversion or expansion. If the expanded dataset is under 500MB, it uses the entire dataset; otherwise, it uses a 500MB random sample (meaning it takes a random sampling equaling 500MB when the dataset is over 500MB).
EDA1 returns:
| Analysis type | Analyzes |
|---|---|
| Automatic data schema and data type |
|
| Data visualization |
|
| Data quality checks |
Access insights
Preparing your data is an iterative process. Even if you clean and prep your training data prior to uploading it to DataRobot, you can still improve its quality by assessing features using the insights generated as a result of EDA1. To access these insights:
- In a Use Case, click the Actions menu to the right of a registered dataset and select Explore to open the data explore page. If you select a dynamic dataset, you may need to re-authenticate your credentials for the data connection.
-
Open the Features tile on the left.
-
Click a feature—a panel opens displaying additional summary metrics for the feature at the top, as well as tabs for each available insight.
Available insights
Once a dataset is registered in DataRobot, click on a feature name to view its details. The options available are dependent on variable type:
| Insight | Description | Supported data type |
|---|---|---|
| Histogram | Buckets numeric feature values into equal-sized ranges to show a rough distribution of the variable. | numeric, summarized categorical, multicategorical |
| Frequent Values | Plots the counts of each individual value for the most frequent values of a feature. If there are more than 10 categories, DataRobot displays values that account for 95% of the data; the remaining 5% of values are bucketed into a single "All Other" category. | numeric, categorical, text, boolean |
| Table | Provides a table of feature values and their occurrence counts. Note that if the value displayed contains a leading space, DataRobot includes a tag, leading space, to indicate as much. This is to help clarify why a particular value may show twice in the histogram (for example, 36 months and 36 months are both represented). | numeric, categorical, text, boolean, summarized categorical, multilabel |
| Illustration | Shows how summarized categorical data—features that host a collection of categories—is represented as a feature. See also the summarized categorical insight differences. | summarized categorical |
| Overview | Presents the top 50 most frequent keys for your feature. | summarized categorical |
| Feature lineage | Provides a visual description of how the feature was derived and the datasets that were involved in the feature derivation process. | Feature Discovery datasets only |
Data Quality Assessment
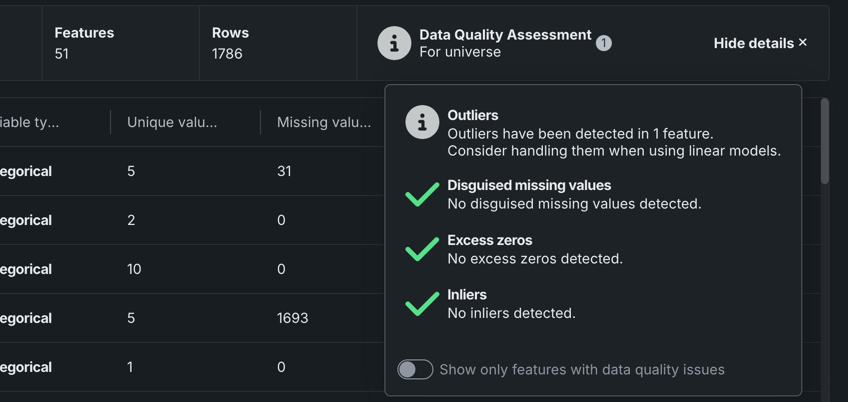
As part of EDA1, DataRobot automatically detects and surfaces common data quality issues and, often, handles them with minimal or no action on the part of the user. The assessment not only saves time finding and addressing issues, but provides transparency into automated data processing (you can see the automated processing that has been applied). Note that these checks are only run on features that don’t require date/time or target information (see the table above for a full list of data quality checks).
You can access the Data Quality Assessment by clicking Show Summary (unless it is already open, then the button displays Hide summary) on either the Data Preview or Features tile.
Then, click Show details to open a detailed report.
Each data quality check provides issue status flags, a short description of the issue, and a recommendation message, if appropriate:
| Status | Description |
|---|---|
| Warning | Attention or action required |
| Informational | No action required |
| Passing | No issue detected |
Data quality checks
To check individual features for data quality issues:
- After registration is complete, select the dataset to open the data explore page.
-
Open the Features tab on the left. The Data quality column indicates if DataRobot detected a data quality issue with the feature.
-
Hover over the icon to learn which check failed, and then you can use the exploratory data insights to correct them.


