Image Embeddings
| Tab | Description |
|---|---|
| Explanations | Shows projections of images in two dimensions to see visual similarity between a subset of images and help identify outliers. |
Image Embeddings displays up to 100 images from the validation set, projected onto a two-dimensional plane (using a technique that preserves similarity among images). This visualization answers the questions: What does the featurizer consider to be similar? Does this match human intuition? Is the featurizer missing something obvious?
Filtering
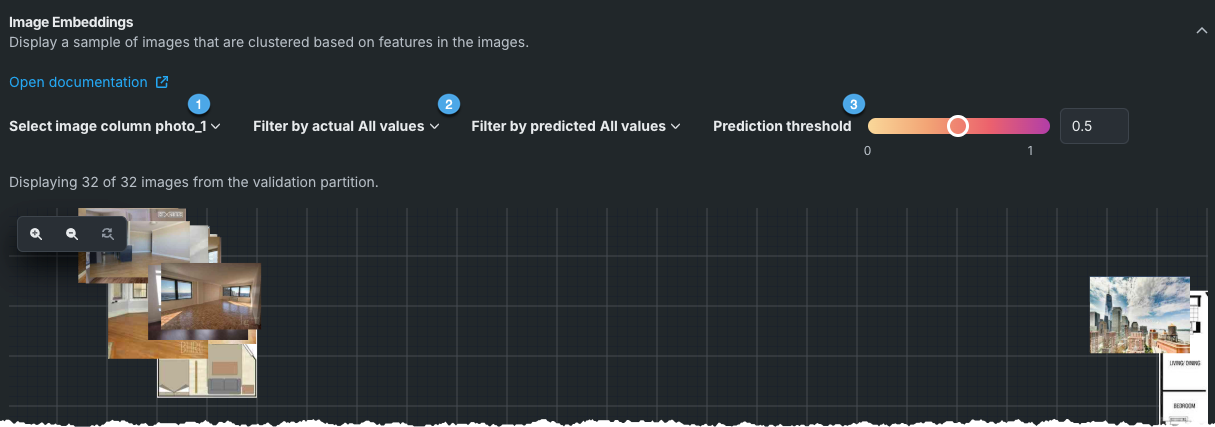
Use filters to limit the display by specific classes, actual values, predicted values, and for supported experiment types, values that fall within a prediction threshold:
| Element | Description | |
|---|---|---|
| 1 | Select image column | For datasets with more than one image feature, use the dropdown to display clusters based on the selected image. If the dataset contains only a single column, the dropdown is not present. |
| 2 | Filter by actual or predicted | Narrows the display based on the predicted and actual class values. |
| 3 | Prediction threshold | For supported experiment types,shown in the table below,filters the display to show values that fall within a specified threshold. |
Image Embeddings filter options differs depending on the project type. The options are described in the following table:
| Element | Description | Project type |
|---|---|---|
| Filter by actual (dropdown) | Displays images whose actual values belong to the selected class. All classes display by default. | Binary classification, multiclass, multilabel |
| Filter by actual (slider) | Displays images whose actual values fall within a custom range. | Regression |
| Filter by predicted (dropdown) | Displays images whose predicted values belong to the selected class. Modifying the prediction threshold (not applicable to multiclass) changes the output. | Binary classification, multiclass, multilabel, anomaly detection, clustering |
| Filter by predicted (slider) | Displays images whose predicted value falls within the selected range. | Regression |
| Prediction threshold | Helps visualize how predictions would change if you adjust the probability threshold. As the threshold moves, the predicted outcome changes and the canvas (border colors) update. In other words, changing the threshold may change predicted label for an image. For anomaly detection projects, use the threshold to see what becomes an anomaly as the threshold changes. | Binary classification, multilabel, anomaly detection |
| Select image column | If the dataset has multiple image columns, displays embeddings only for those images matching the column. | Multilabel |
Interpret the display
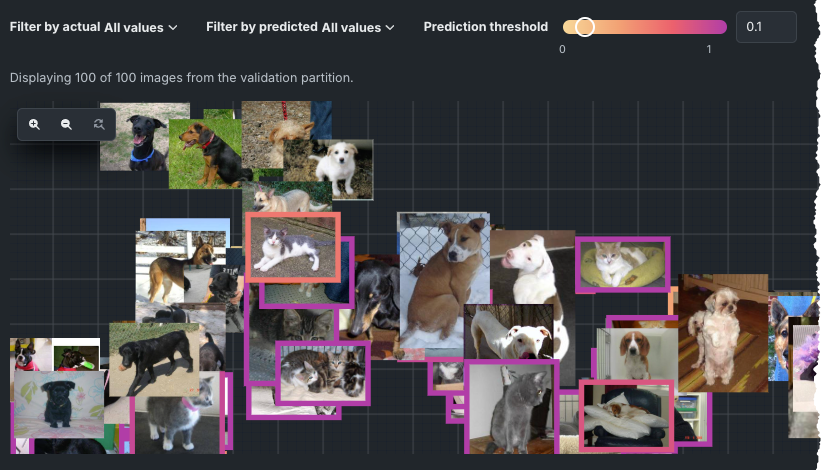
The border color on an image indicates its prediction probability. All images with a probability higher than the prediction threshold have colored borders. Note that colors may take some time to appear as the predictions compute.
Images with a predicted probability below the threshold don't have any border and can also be filtered out to disappear from the canvas entirely. In clustering projects, the frame of each image displays in a color that represents the cluster containing the image. Hover over an image to view the probability of the image belonging to each cluster.
Work with the canvas
The Image Embeddings canvas displays projections of images in two dimensions to help you visualize similarities between groups of images and to identify outliers. You can use controls to get a more granular view of the images. The following controls are available:
-
Use zoom controls to get access to all images:
Enlarge, reduce, or reset the space between images on the canvas so that you can more easily see details between the images or get access to an image otherwise hidden behind another image. This action can also be achieved with your mouse (CMD + scroll for Macs and SHIFT + scroll for Windows).
-
Click and drag to move areas of the display into focus.
-
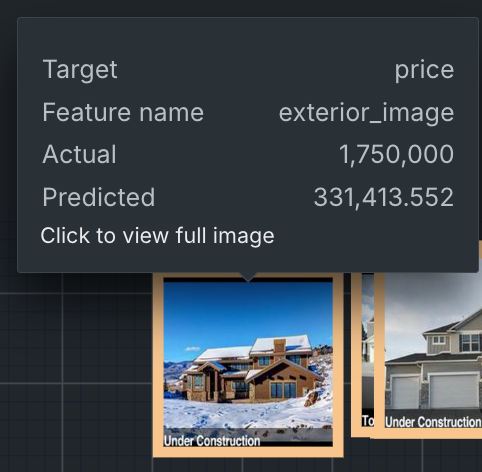
Hover on an image to see details, including the actual and predicted class information. Use these tooltips to compare images to see whether DataRobot is grouping images as you would expect:
-
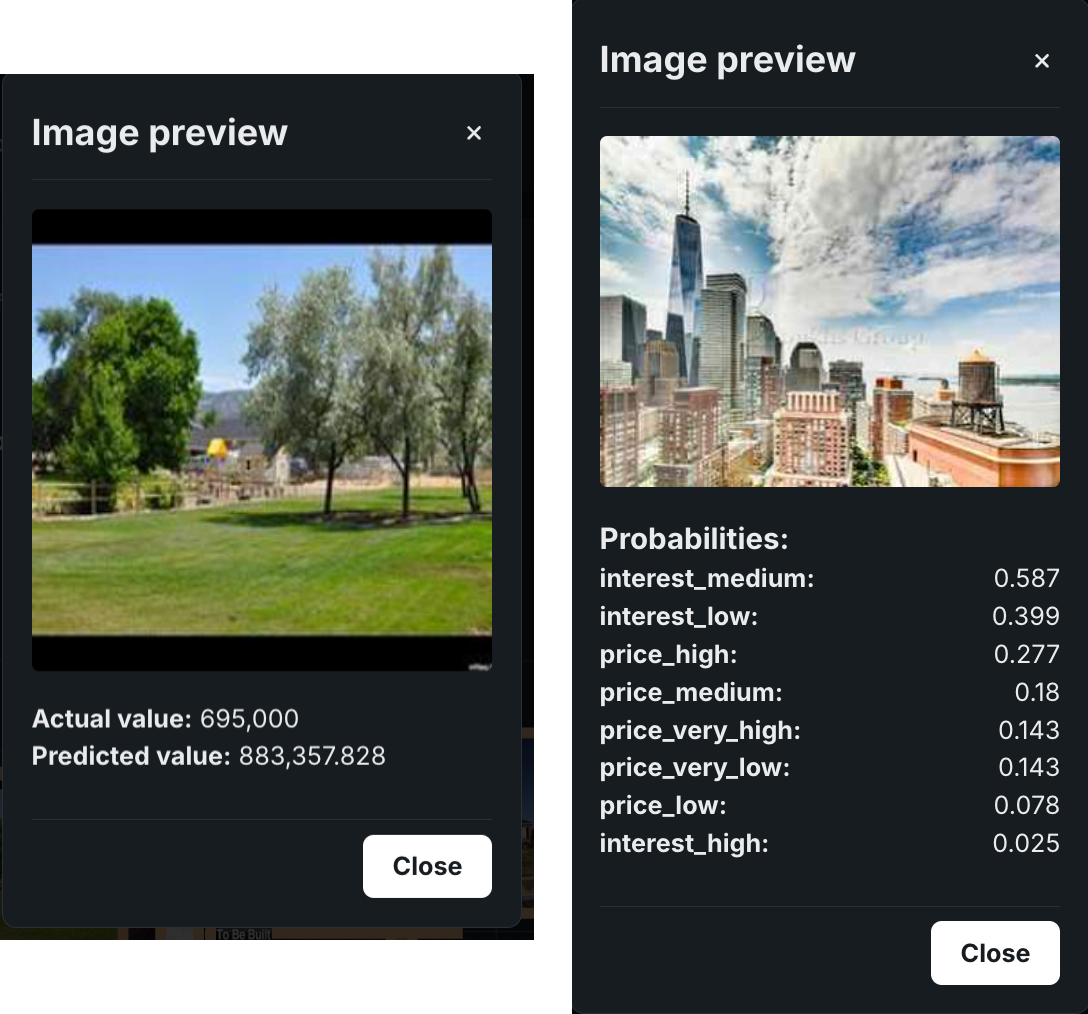
Click an image to see prediction probabilities for that image. The output is dependent on the project type. For example, compare a binary classification to a multilabel project:
The predicted values displayed in the preview are updated with any changes you make to the prediction threshold.


