Attention Maps
| Tab | Description |
|---|---|
| Explanations | Highlights regions of an image according to its importance to a model's prediction, highlighting areas of high and low attention. |
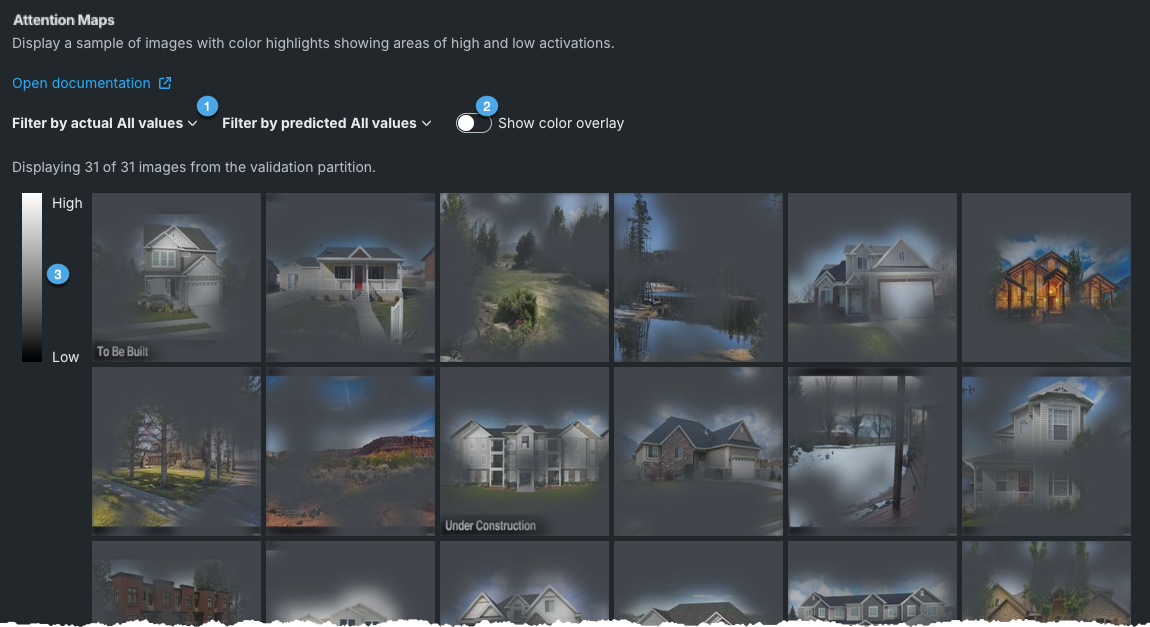
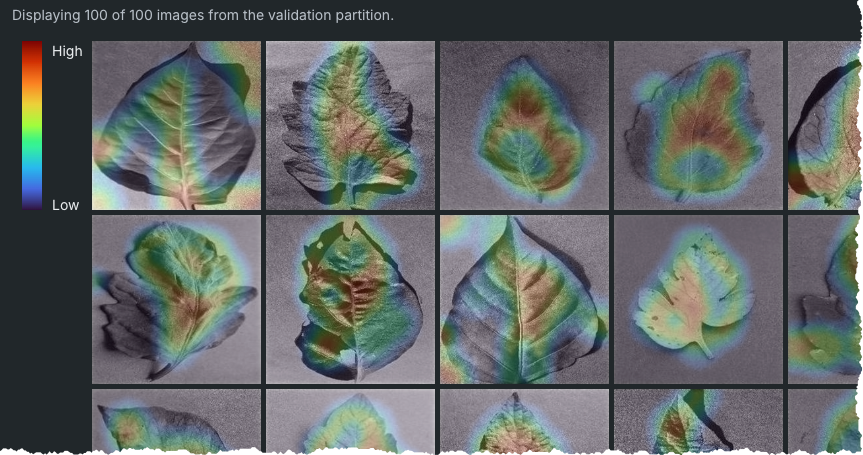
Attention Maps show which image areas the model is using when making predictions—which parts of the images are driving the algorithm's prediction decision. With clustering experiments, use the insight to help understand how best to cluster the data.
An attention map can indicate whether your model is looking at the foreground or background of an image or whether it is focusing on the right areas. For example, is it looking only at “healthy” areas of a plant when there is disease and because it does not use the whole leaf, classifying it as "no disease"? Is there a problem with overfitting or target leakage? These maps help to determine whether the model would be more effective if the augmentation settings were tuned.
DataRobot previews up to 100 sample images from the project's validation set. Use the following filters to modify the display:
| Element | Description | |
|---|---|---|
| 1 | Filter by predicted or actual | Narrows the display based on the predicted and actual class values. See Filters for details. |
| 2 | Show color overlay | Sets whether to set the display to show only what the model deemed "important" for predictions or whether to show the important area in context of the whole image. See Color overlay for details. |
| 3 | Attention scale | Shows the extent to which a region is influencing the prediction. See Attention scale for details. |
Filters
Filters allow you to narrow the display based on the predicted and the actual class values. The initial display shows the full sample (i.e., both filters are set to all). You can instead set the display to filter by specific classes, limiting the display.
If you choose a value from the dropdown but it returns zero results, it indicates that there was a row in that range or with that value, but it wasn't in the sample from the validation set. Target ranges are extracted from the initial training partition, which might not overlap with the validation partition.
Consider some examples from a plant health dataset:
| "Predicted" filter | "Actual" filter | Display results |
|---|---|---|
| All | All | All (up to 100) samples from the validation set. |
| Tomato Leaf Mold | All | All samples in which the predicted class was Tomato Leaf Mold. |
| Tomato Leaf Mold | Tomato Leaf Mold | All samples in which both the predicted and actual class were Tomato Leaf Mold. |
| Tomato Leaf Mold | Potato Blight | Any sample in which DataRobot predicted Tomato Leaf Mold but the actual class was potato blight. |
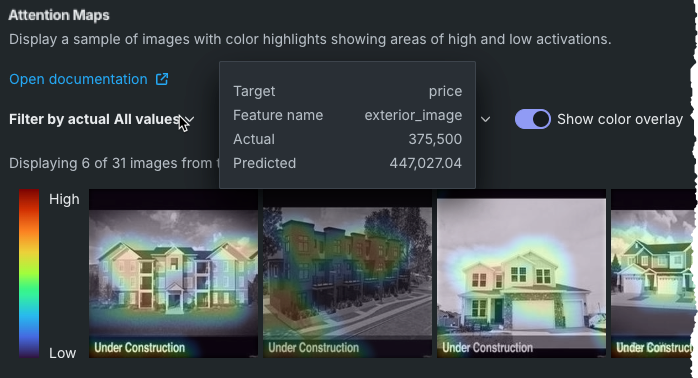
Hover over an image to see details:
WIth clustering projects, hover over an image to see which cluster the image was assigned to.
Color overlay
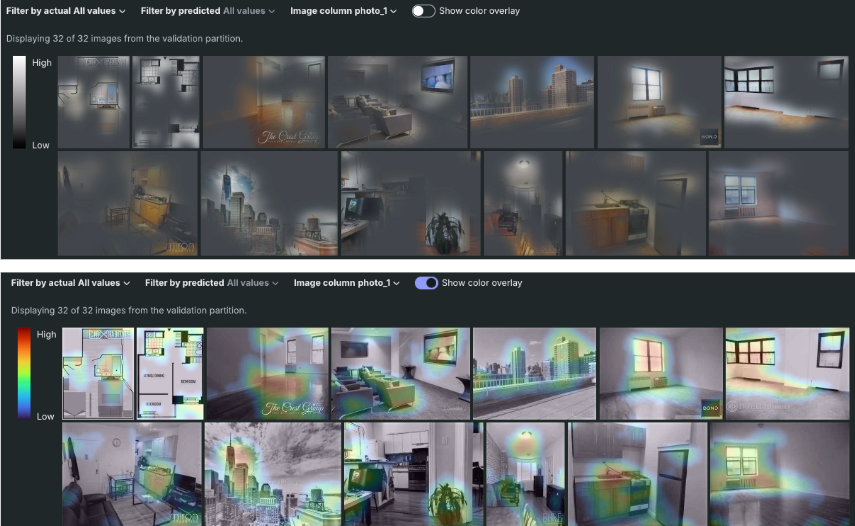
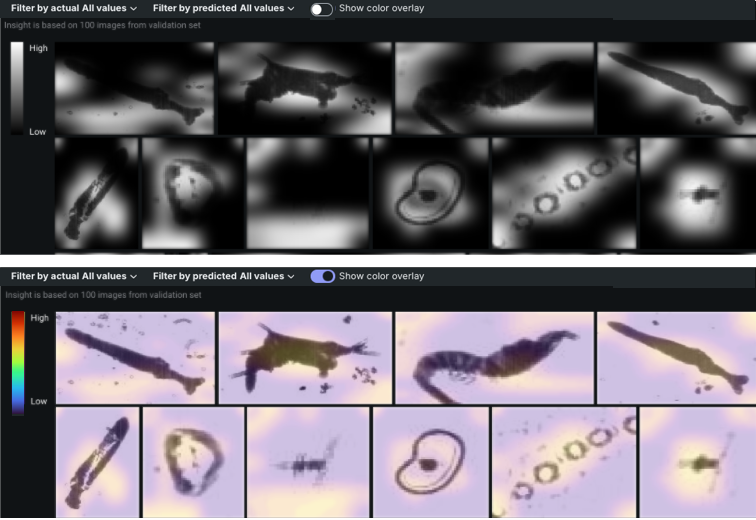
DataRobot provides two different views of the attention maps, one with and one without a color overlay. Choices are controlled by the Show color overlay toggle.
- When disabled (toggle off), the map shows only the more important areas of each image, covering the rest in opaque bland and white coloring.
- When enabled, the map shows the entire image with the important areas highlighted in color.
Use this option to check whether the model is working as expected—is it using the 'right' areas of the image to make a prediction or is it focusing on random areas that don't fit the use case? This insight can be thought of as the image equivalent of feature importance in tabular datasets.
Select the option that provides the clearest contrast. For example, for black and white datasets, the alternative color overlay may make attention areas more obvious (instead of using a black-to-transparent scale). Toggle Show color overlay to compare.
Attention scale
The high-to-low attention scale indicates how much of an image region is influencing the prediction. Areas that colored higher on the scale have a higher predictive influence—the model used something that was there (or not there, but should have been) to make the prediction. Some examples might include the presence or absence of yellow discoloration on a leaf, a shadow under a leaf, or an edge of a leaf that curls in a certain way.
Another way to think of scale is that it reflects how much the model "is excited by" a particular region of the image. It’s a kind of prediction explanation—why did the model predict what it did? The map shows that the reason is because the algorithm saw x in this region, which activated the filters sensitive to visual information like x.
