Analyze data insights
Note
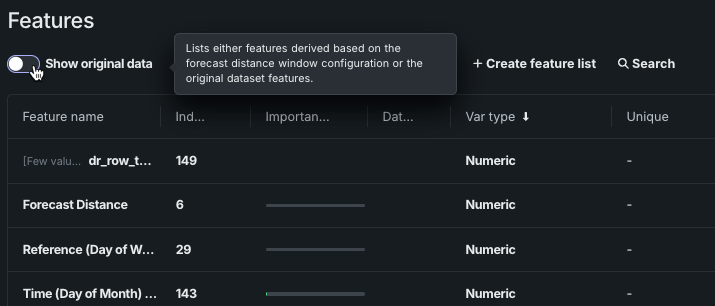
For time-aware experiments, the Data preview, Features, and Feature lists tiles have a toggle that controls whether the display is derived data only or derived and original data.
Data preview tile
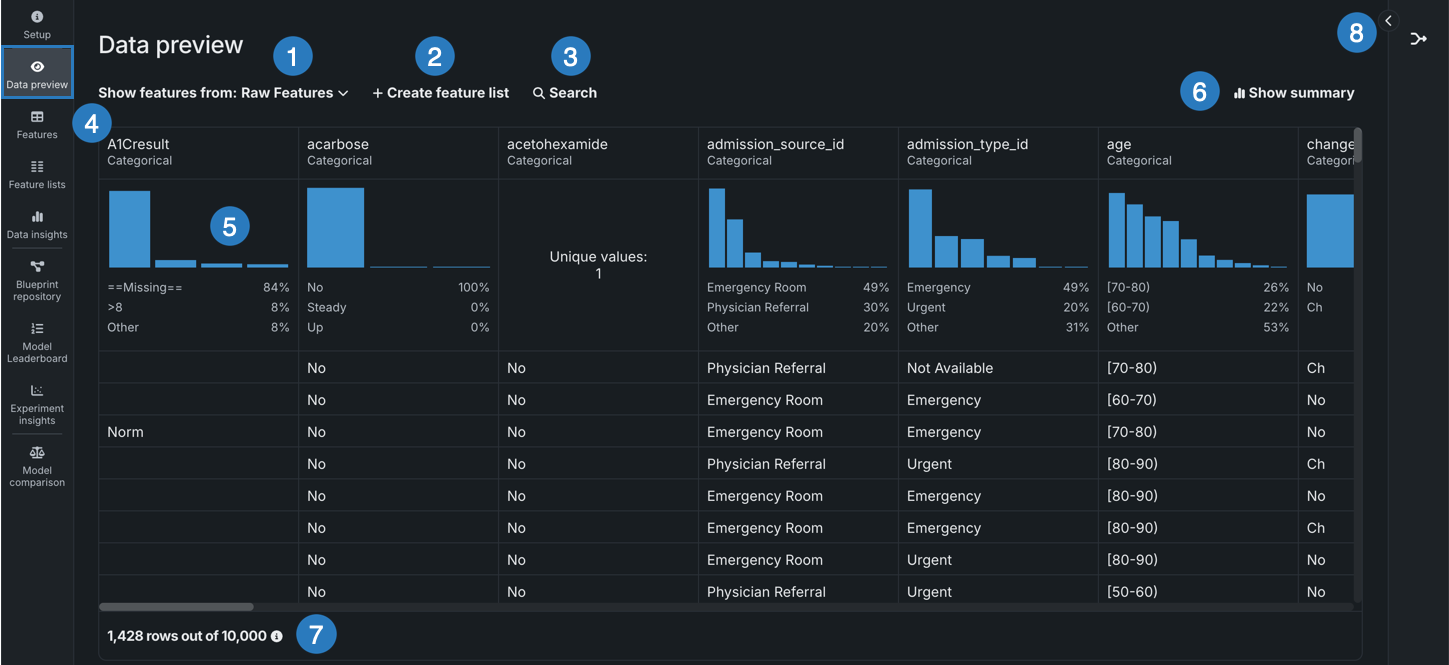
The Data preview tile provides a simplified, visual representation of the features in your dataset.
| Element | Description | |
|---|---|---|
| 1 | Show features from dropdown | Allows you to view features from a specific feature list. |
| 2 | + Create feature list | Creates a new feature list. |
| 3 | Search | Searches for a specific feature in the dataset or feature list you're currently viewing. |
| 4 | Features | Displays each feature row and column for the selected feature list. |
| 5 | Frequent values chart | Plots the counts of each individual value for the most frequent values of a feature. |
| 6 | Show summary | Displays the following summary information for the dataset:
|
| 7 | Preview sample | Displays the number of rows used to generate the preview out of the total number of rows in the dataset. |
| 8 | Wrangling recipe | Allows you to view the wrangling recipe, if applicable, associated with the dataset, as well as continue wrangling the dataset. |
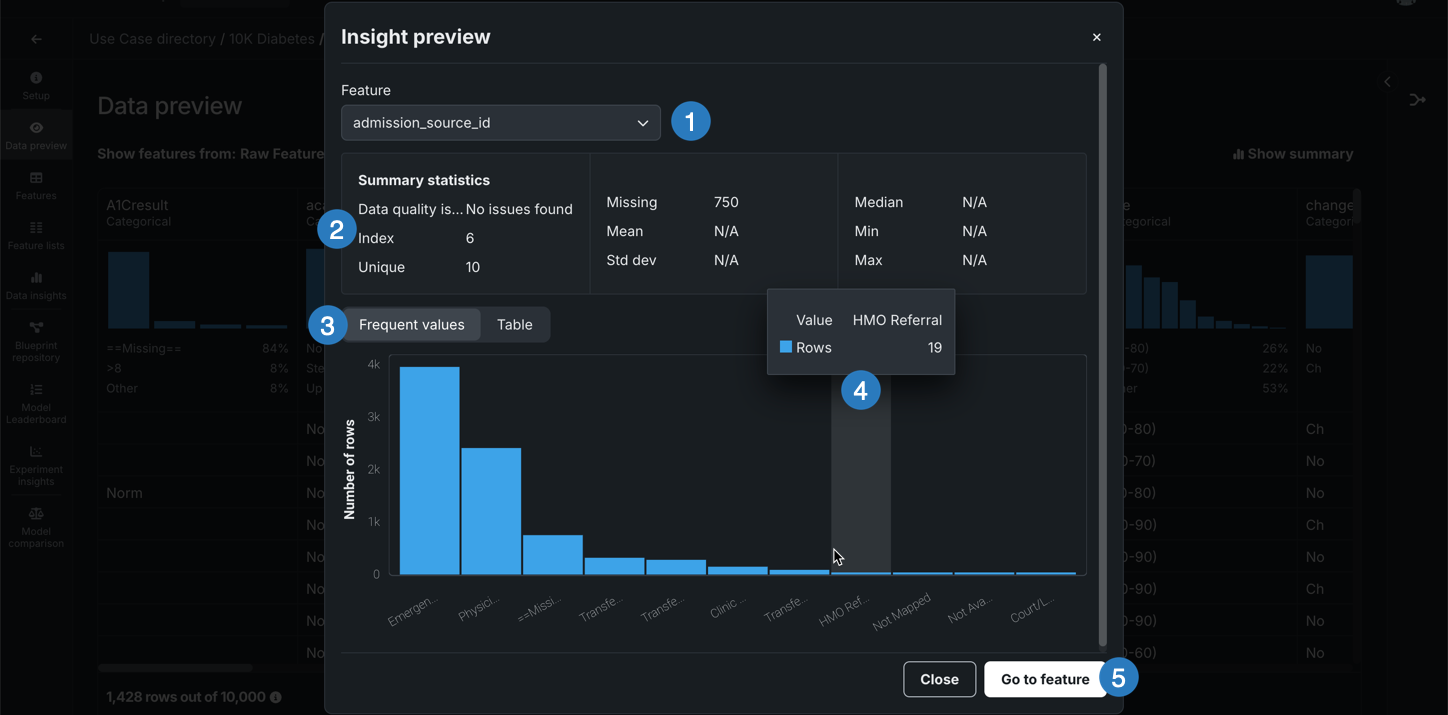
Select a feature to view additional summary statistics and insights.
| Element | Description | |
|---|---|---|
| 1 | Feature dropdown | Allows you to change the feature you're currently viewing. |
| 2 | Summary statistics | Displays summary statistics for the feature, including data quality issues and unique values. |
| 3 | Insights | Allows you to view available insights for the variable type of the feature. |
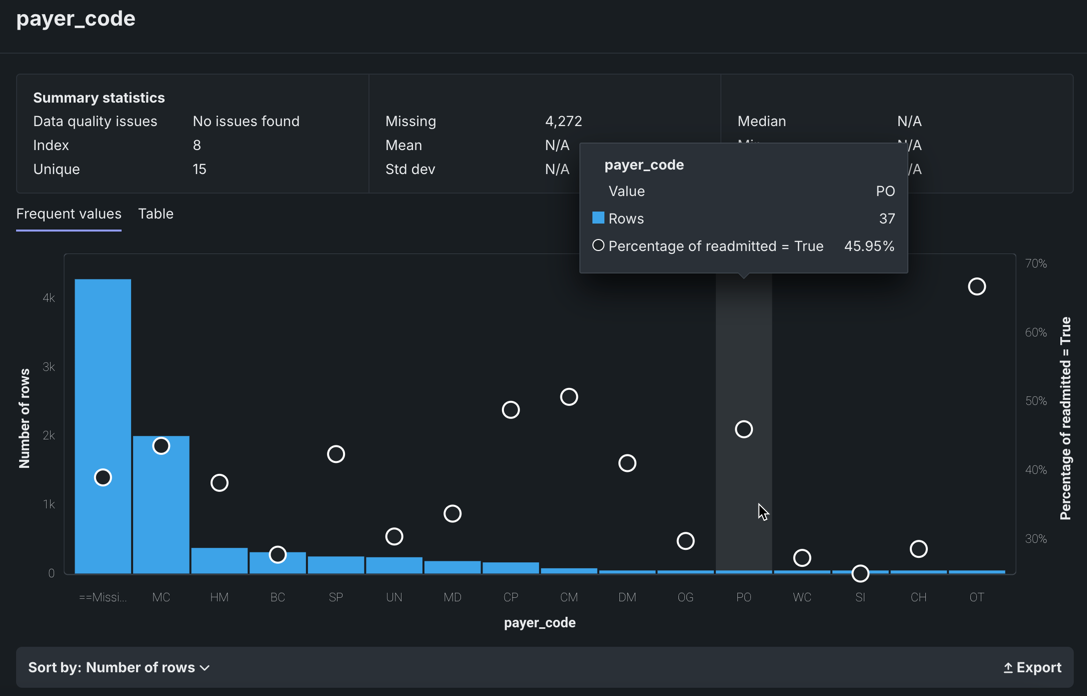
| 4 | Hover details | Displays additional information when you hover on the chart. |
| 5 | Go to feature | Opens the Features tile and expands the feature you were viewing. |
Features tile
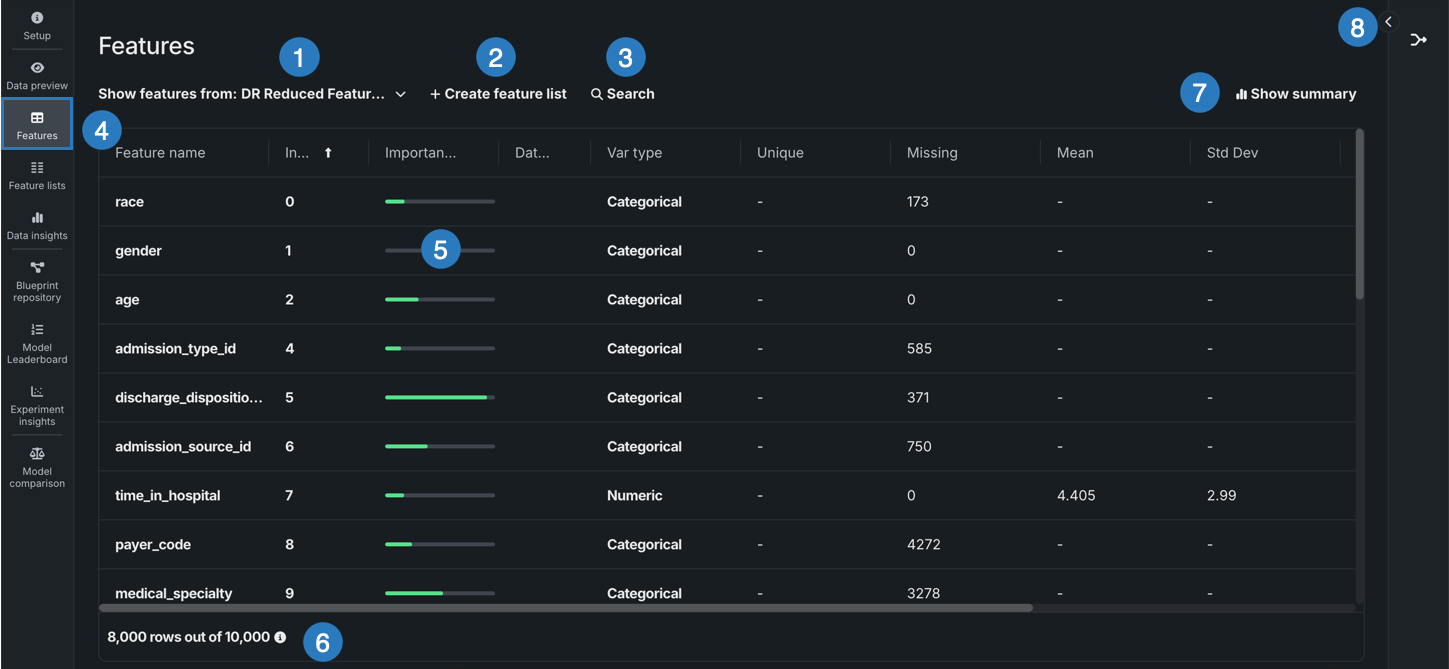
The Features tile displays the features in your dataset alongside summary statistics, and also allows you to view additional insights and information to help you better understand your data.
| Element | Description | |
|---|---|---|
| 1 | Show features from dropdown | Allows you to view features from a specific feature list. |
| 2 | + Create feature list | Creates a new feature list. |
| 3 | Search | Searches for a specific feature in the dataset or feature list you're currently viewing. |
| 4 | Features | Displays each feature, as well as summary statstics for each feature, in the selected feature list . |
| 5 | Importance column | Displays green bars in the Importance column which are a measure of how much a feature, by itself, is correlated with the target variable feature importance. |
| 6 | Preview sample | Displays the number of rows used to generate the preview out of the total number of rows in the dataset. |
| 7 | Show summary | Displays the following summary information for the dataset:
|
| 8 | Wrangling recipe | Allows you to view the wrangling recipe, if applicable, associated with the dataset, as well as continue wrangling the dataset. |
| 9 | Create feature transformation | Allows you create a new feature by transforming an existing feature in the dataset. |
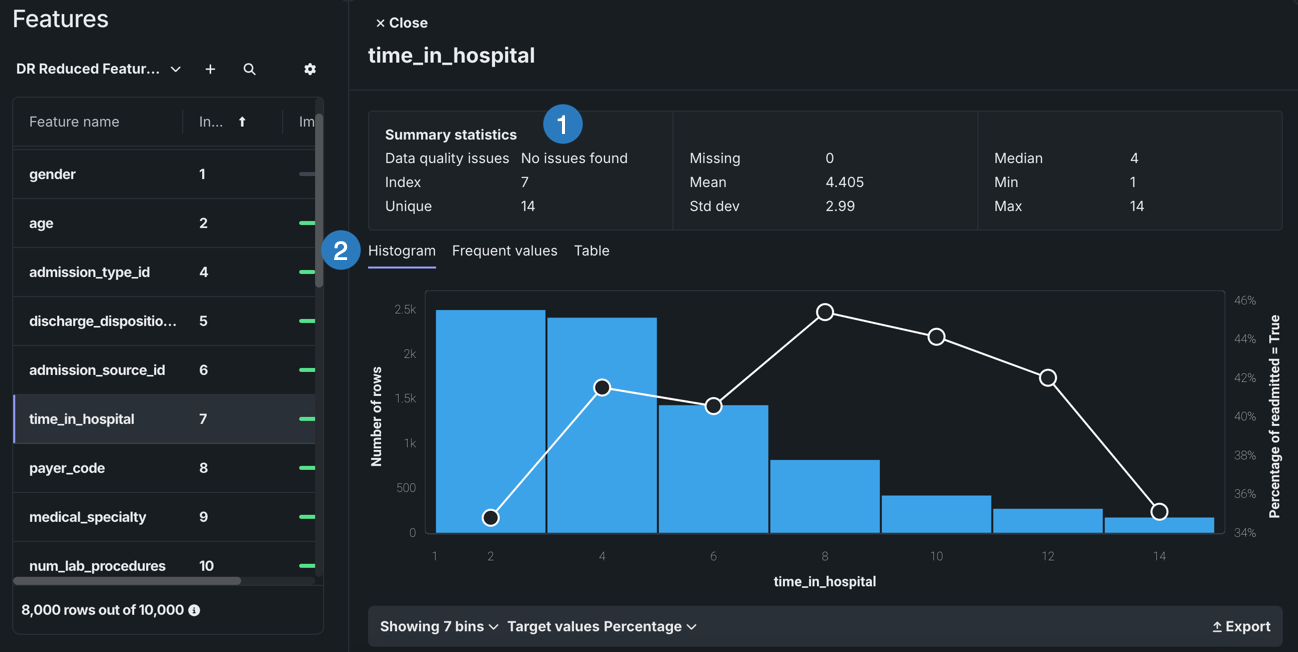
Select a feature to view additional summary statistics and insights:
| Element | Description | |
|---|---|---|
| 1 | Summary statistics | Displays summary statistics for the feature, including data quality issues and unique values. |
| 2 | Insights | Allows you to view available insights for the variable type of the feature. |
| 3 | Create feature transform | Allows you create a new feature by transforming an existing feature in the dataset. |
Feature lists tile
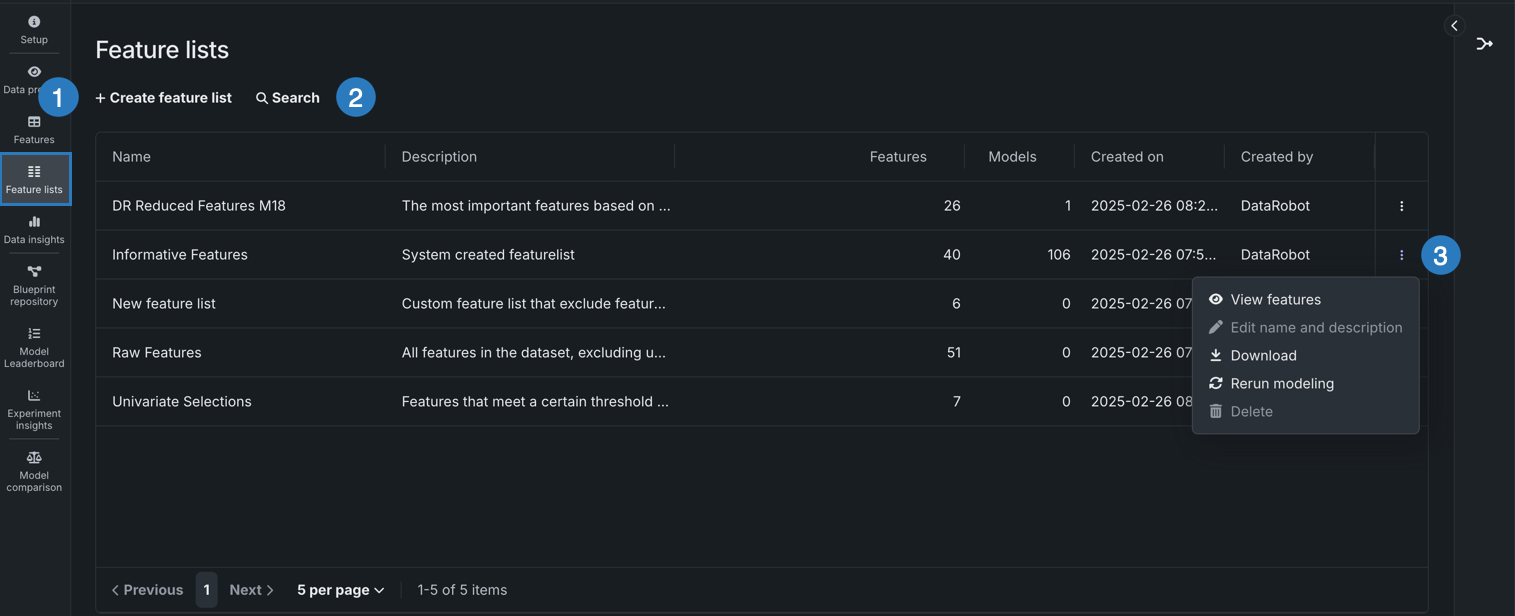
The Feature lists tile displays all feature lists associated with the experiment. Feature lists control the subset of features that DataRobot uses to build models and make predictions.
When you select the Feature lists tile, the display shows both DataRobot's automatically created lists and any custom feature lists. Custom feature lists can be created prior to modeling from the data explore page or after modeling from Data preview, Features, or this tile.
For information on feature lists and creating custom feature lists, see the Feature lists reference page.
| Element | Description | |
|---|---|---|
| 1 | + Create feature list | Allows you to create a custom feature list. For more information, see Create a feature list. |
| 2 | Search | Filters existing feature lists based on the key words entered in the search bar. |
| 3 | Actions menu | Opens the Actions menu for a specific feature list. |
The following actions are available for feature lists from the Actions menu :
| Action | Description |
|---|---|
| View features | Explore insights for a feature list. This selection opens the Features tab with the filter set to the selected list. |
| Edit name and description | (Custom lists only) Opens a dialog to change the list name and change or add a description. |
| Download | Downloads the features contained in that list as a .csv file. |
| Rerun modeling | Opens the Rerun modeling modal to allow selecting a new feature list, training with GPU workers, and restarting Autopilot. |
| Delete | (Custom lists only) Permanently deletes the selected list from the experiment. |
Data insights tile
Displays the Feature Associations insight to help you track and visualize associations within your data.
Available insights
Once modeling is complete, you can click a feature name to view its details and also (in some cases) modify its type. The options available are dependent on variable type:
| Insight | Description | Variable Type |
|---|---|---|
| Histogram | Buckets numeric feature values into equal-sized ranges to show a rough distribution of the variable. | numeric, summarized categorical, multicategorical |
| Frequent Values | Plots the counts of each individual value for the most frequent values of a feature. If there are more than 10 categories, DataRobot displays values that account for 95% of the data; the remaining 5% of values are bucketed into a single "All Other" category. | numeric, categorical, text, boolean |
| Table | Provides a table of feature values and their occurrence counts. Note that if the value displayed contains a leading space, DataRobot includes a tag, leading space, to indicate as much. This is to help clarify why a particular value may show twice in the histogram (for example, 36 months and 36 months are both represented). | numeric, categorical, text, boolean, summarized categorical, multilabel |
| Illustration | Shows how summarized categorical data—features that host a collection of categories—is represented as a feature. See also the summarized categorical tab differences for information on Overview and Histogram. | summarized categorical |
| Category Cloud | After EDA2 completes, displays the keys most relevant to their corresponding feature in Word Cloud format. This is the same Word Cloud that is available from the Category Cloud on the Insights page. | summarized categorical |
| Feature Statistics | Reports overall multilabel dataset characteristics, as well as pairwise statistics for pairs of labels and the occurrence percentage of each label in the dataset. | multilabel |
| Over Time (time-aware only) | Identifies trends and potential gaps in data by displaying, for both the original modeling data and the derived data, how a feature changes over the primary date/time feature. | numeric, categorical, text, boolean |
| Feature Lineage (time series) or (Feature Discovery) | Provides a visual description of how a derived feature was created. | numeric, categorical, text, boolean |
| Feature Associations | Available only from the Data insights tile. Provides a matrix using the Importance score to help you track and visualize associations within your data. It lists up to the top 50 features, sorted by cluster, on both the X and Y axes. | n/a |
| Data Quality Assessment | Detects and surfaces common data quality issues and, often, handles them with minimal or no action on the part of the user. | n/a |
Note
The values and displays for a feature may differ between EDA1 (viewed from Data assets) and EDA2 (Viewed from an Experiments). For EDA1, the charts represent data straight from the dataset. After you have selected a target and built models, the data calculations may have fewer rows due to, for example, holdout or missing values. Additionally, after EDA2 DataRobot displays average target values which are not yet calculated for EDA1.
Histogram
The Histogram chart is the default display for numeric features. It "buckets" numeric feature values into equal-sized ranges to show frequency distribution of the variable—the target observation (left Y-axis) plotted against the frequency of the value (X-axis). The height of each bar represents the number of rows with values in that range.
After EDA2 completes, the histogram also displays an average target value overlay.
For more information, see the documentation on Feature details and the Histogram chart.
Frequent Values
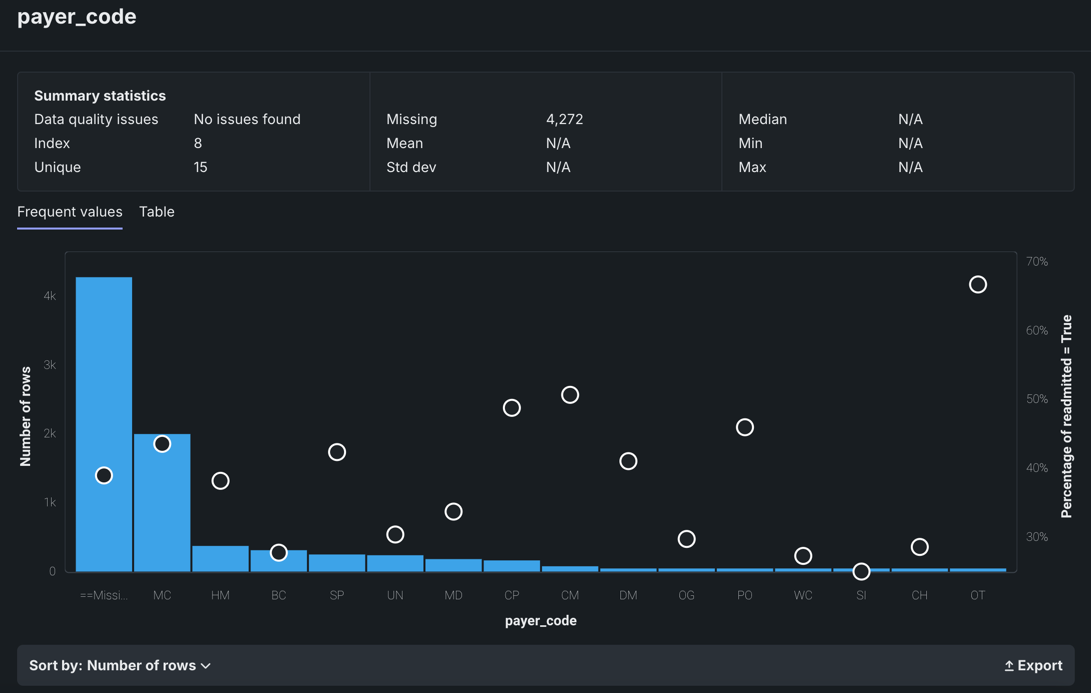
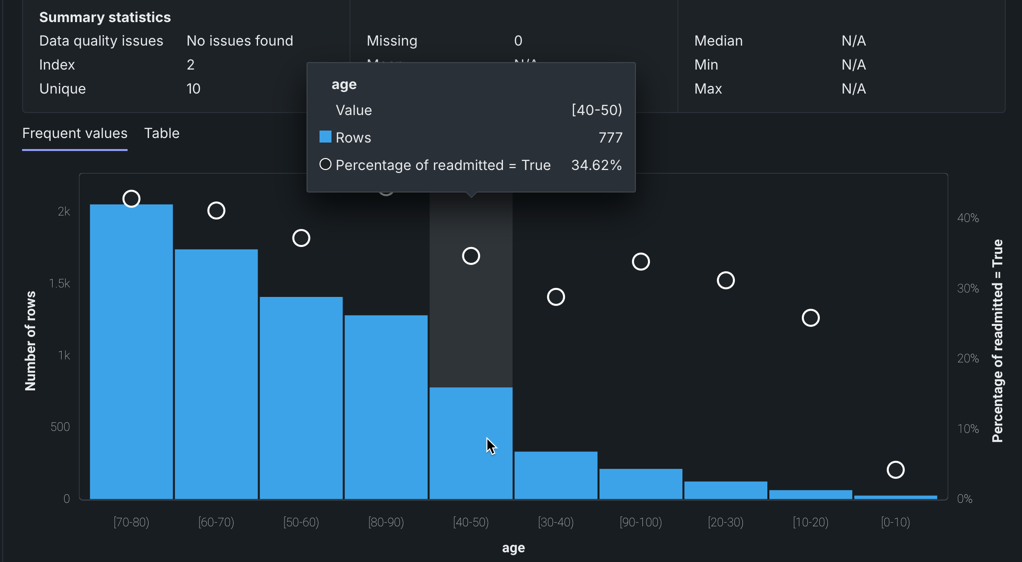
The Frequent Values chart is a histogram that in addition to showing the number of rows containing each value of a feature and the percentage of rows for each value of the target, also reports inliers, disguised missing values, and excess zeros.
The Frequent Values chart is the default display for categorical, text, and boolean features, although it is also available to other feature types. The display is dependent on the results of the data quality check. For some features like categorical and boolean features, the Frequent Values insight is the default.
After EDA2 completes, the Frequent Values chart also displays an average target value overlay.
The Feature Values chart displays each value that appears in the dataset for the feature and the number of rows with that value. With no data quality issues:
In many cases, you can change the display using the Sort by dropdown. By default, DataRobot sorts by frequency (Number of rows), from highest to lowest. You can also sort by <feature_name>, which displays either alphabetically or, in the case of numerics, from low to high. The Export link allows you to download an image of the Frequent Values chart as a PNG file.
Notice the white circles that overlay the histogram. The circles indicate the average target value for a bin.
Feature Lineage
The Feature Lineage insight—available for Feature Discovery and time series experiments—provides a visual description of how the feature was derived as well as the datasets that were involved in the feature derivation process. It visualizes the steps followed to generate the features (on the right) from the original dataset (on the left). Each element represents an action or a JOIN.
For more information, see the documentation on Feature Discovery and time series.
Over Time
The Over time chart helps you identify trends and potential gaps in your data by displaying, for both the original modeling data and the derived data, how a feature changes over the primary date/time feature. It is available for all time-aware experiments (OTV, single series, and multiseries). For time series, it is available for each user-configured forecast distance.
For more information, see Understand a feature's Over Time chart.
Feature Associations
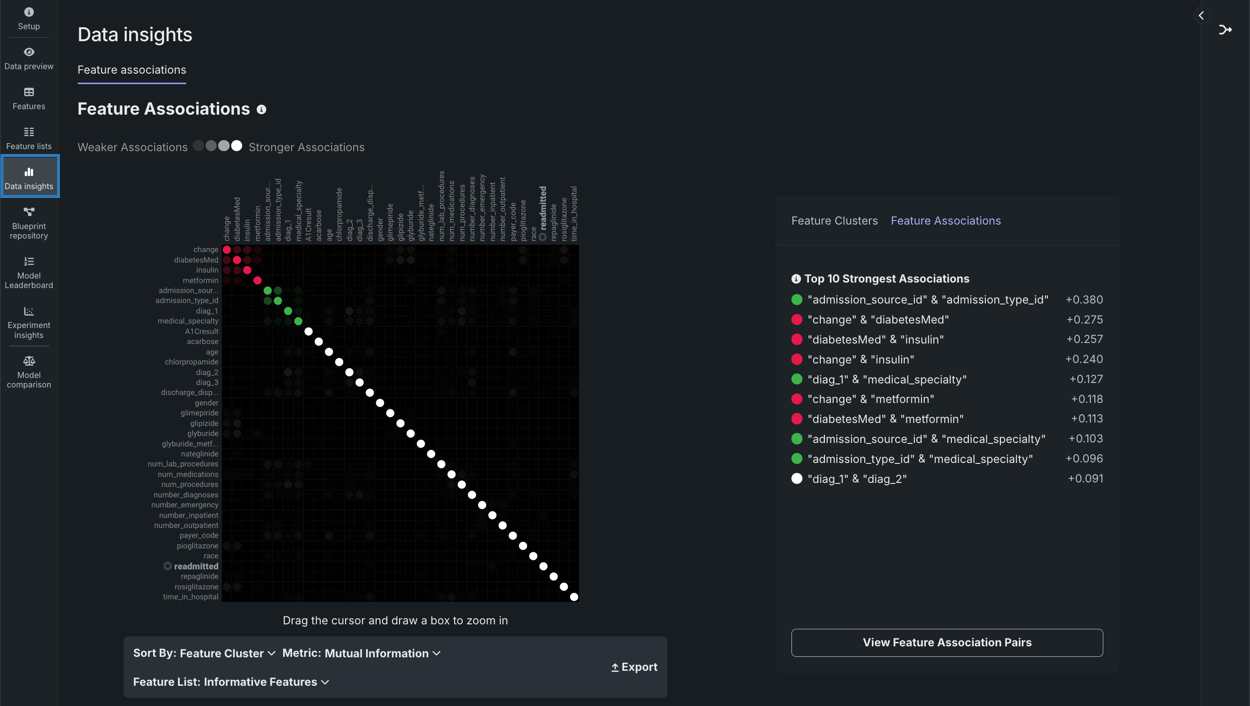
Accessed from the Data insights tile, the Feature Associations insight provides a matrix to help you track and visualize associations within your data. This information is derived from different metrics that:
- Help to determine the extent to which features depend on each other.
- Provide a protocol that partitions features into separate clusters or "families."
The matrix is:
- Created during EDA2 using the feature importance score.
- Based on numeric and categorical features found in the Informative Features feature list.
To use the matrix, within an experiment, click the Data insights tile.
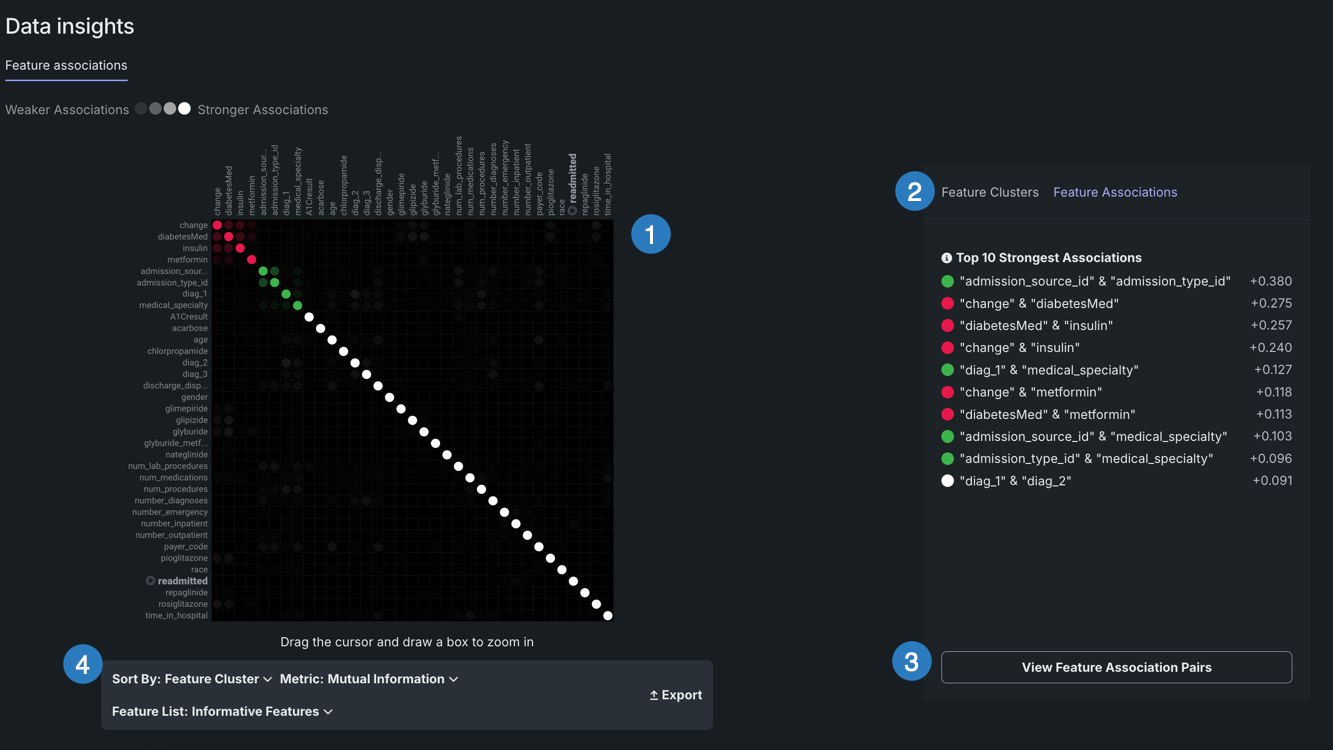
| Element | Description | |
|---|---|---|
| 1 | Matrix | Lists up to the top 50 features, sorted by cluster, on both the X and Y axes. |
| 2 | Details pane | Displays more specific information on clusters, general associations, and association pairs. |
| 3 | Feature pairs | Displays associations and relationships between specific feature pairs. |
| 4 | Matrix controls | Allows you to modify the view. |
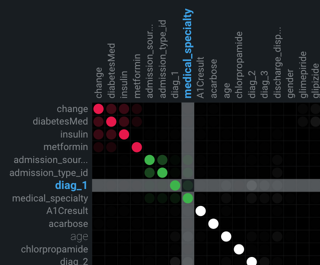
The Feature Associations matrix provides information on association strength between pairs of numeric and categorical features (that is, num/cat, num/num, cat/cat) and feature clusters. Clusters, families of features denoted by color on the matrix, are features partitioned into groups based on their similarity. With the matrix's intuitive visualizations you can:
- Quickly perform association analysis and better understand your data.
- Gain understanding of the strength and nature of associations.
- Detect families of pairwise association clusters.
- Identify clusters of high-association features prior to model building (for example, to choose one feature in each group for model input while differencing the others).
View the matrix
Once EDA2 completes, the matrix becomes available. It lists up to the top 50 features, sorted by cluster, on both the X and Y axes. Look at the intersection of a feature pair for an indication of their level of co-occurrence. By default, the matrix displays by the Mutual Information values.
The following are some general takeaways from looking at the default matrix:
- The target feature is bolded in white.
- Each dot represents the association between two features (a feature pair).
- Each cluster is represented by a different color.
- The opacity of color indicates the level of co-occurrence (association or dependence) 0 to 1, between the feature pair. Levels are measured by the set metric, either mutual information or Cramer's V.
- Shaded gray dots indicate that the two features, while showing some dependence, are not in the same cluster.
- White dots represent features that were not categorized into a cluster.
- The "Weaker ... Stronger" associations legend is a reminder that the opacity of the dots in the metric represent the strength of the metric score.
Clicking points in the matrix updates the detail pane to the right. To reset to the default view, click again in the selected cell. Use the controls beneath the matrix to change the display criteria.
You can also filter the matrix by importance, which instead ranks your top 50 features by ACE (importance) score for binary classification, regression, and multiclass experiments.
Click on any point in the matrix to highlight the association between the two features:
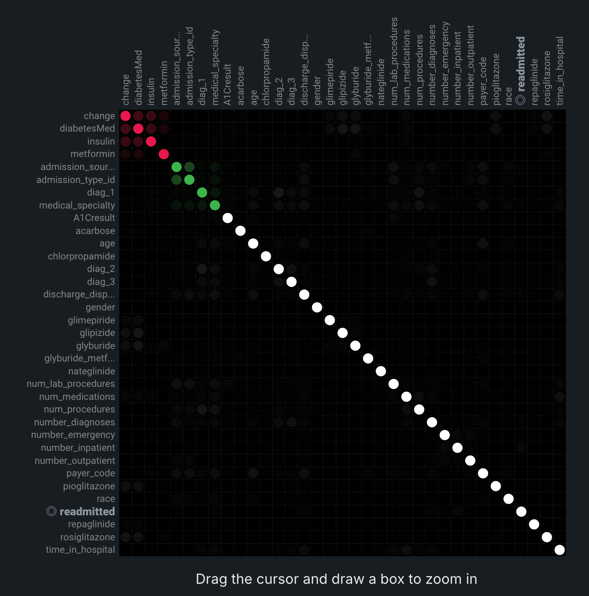
Drag the cursor to outline any section of the matrix. DataRobot zooms the matrix to display only those points within your drawn boundary. To return to the full matrix view, click Reset Zoom below the matrix.
You can modify the matrix view by changing the sort criteria or the metric used to calculate the association. These controls are available below the matrix:
| Element | Description | |
|---|---|---|
| 1 | Sort by dropdown | Allows you to sort by:
|
| 2 | Feature list dropdown | Allows you to compute feature association for any of the experiments's feature lists. If you select a list, the page refreshes and displays the matrix for the selected feature list. |
| 3 | Metric dropdown | Determines how DataRobot calculates the association between feature pairs, using either the Mutual Information or Cramer's V correlation algorithms. |
| 4 | Reset zoom | Returns to the full matrix view if you previously highlighted a section of the matrix for closer observation. |
| 5 | Export | Exports either the full or zoomed matrix. |
Details pane
By default, with no matrix cells selected, the details pane:
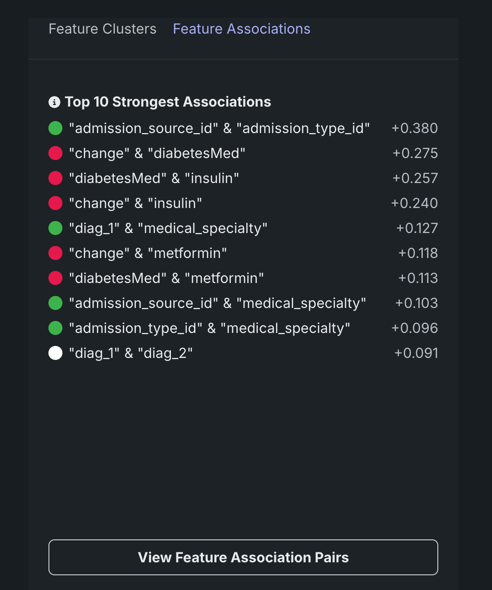
- Displays the strongest associations (Feature Associations tab) found, ranked by association metric score.
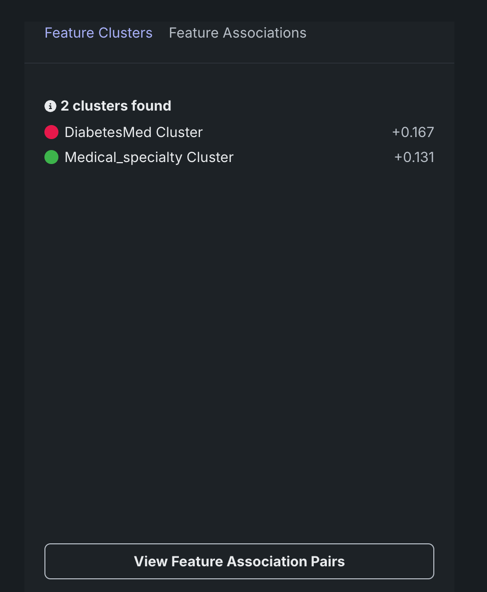
- Displays a list of all identified clusters (Feature Clusters tab) and their average metric score.
- Provides access to charting of feature pair association details.
The listings are based on internal calculations DataRobot runs when creating the matrix.
Once a cell is selected in the matrix, the Feature Associations tab updates to reflect information specific to the selected feature pair:
The table below describes the fields:
| Category | Description |
|---|---|
| "feature_1" & "feature_2" | |
| Cluster | The cluster that both features of the pair belong to, or if from different clusters, displays "None." |
| Metric name | A measure of the dependence features have on each other. The value is dependent on the metric set, either Mutual Information or Cramer's V. |
| Details for "feature_1" Details for "feature_2" |
|
| Importance | The normalized importance score, rounded to three digits, indicating a feature's importance to the target. |
| Type | The feature's data type, either numeric or categorical. |
| Mean | The mean of the feature value. |
| Min/Max | The minimum and maximum values of the feature. |
| Strong associations with "feature_1" | |
| feature_1 | When you select a feature's intersection with itself on the matrix, a list of the five most strongly associated features, based on metric score. |
By default DataRobot displays all found clusters, ranked by the average metric score. These rankings illustrate the clusters with the strongest dependence on each other. The displayed name is based on the feature in the cluster with the highest importance score relative to the target. Clicking on a point in the matrix changes the Feature Clusters tab display to report:
- Score details for the cluster.
- A list of all member features.
Feature association pairs
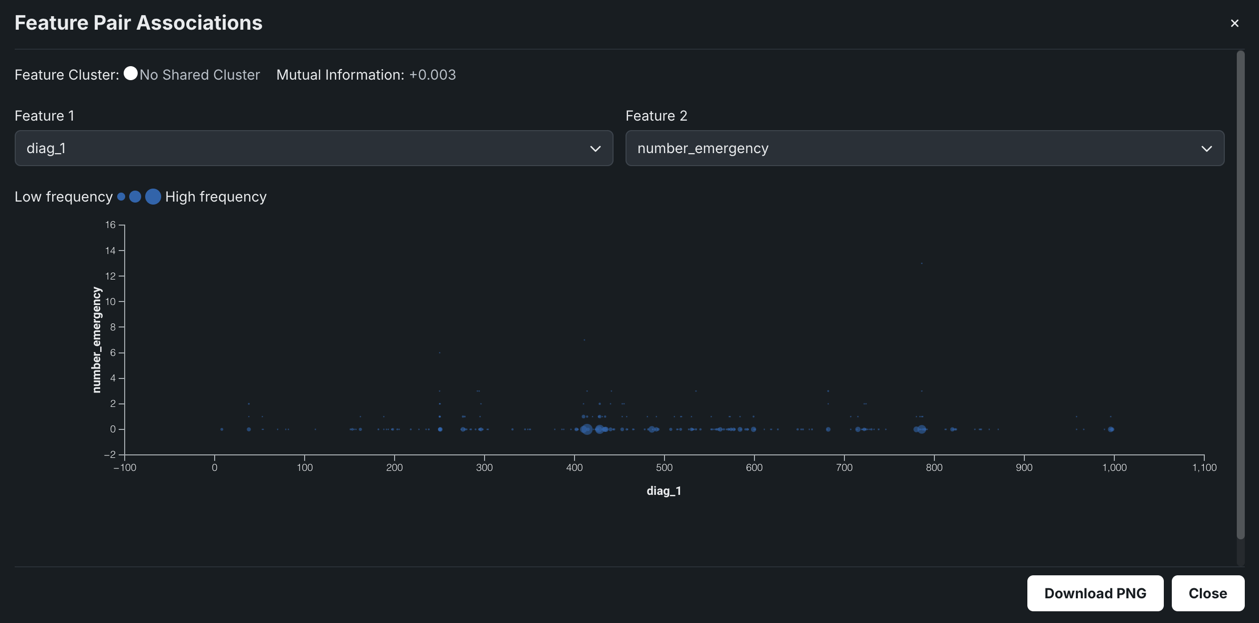
Click View Feature Association Pairs to open a modal that displays plots of the individual association between the two features of a feature pair. From the resulting insights, you can see the values that are impacting the calculation, the "metrics of association." Initially, the plots auto-populate to the points selected in the matrix (which are also those highlighted in the details pane). For each display, DataRobot displays the cluster that the feature with the highest metric score belongs to as well as the metric association score for the feature pair. You can change features directly from the modal (and the cluster and score update):
The insight is the same whether accessed from the Feature Clusters or the Feature Associations tab. Once displayed, click Download PNG to save the insight.
There are three types of plots that display, type being dependent on the data type:
- Scatter plots for numeric vs. numeric features.
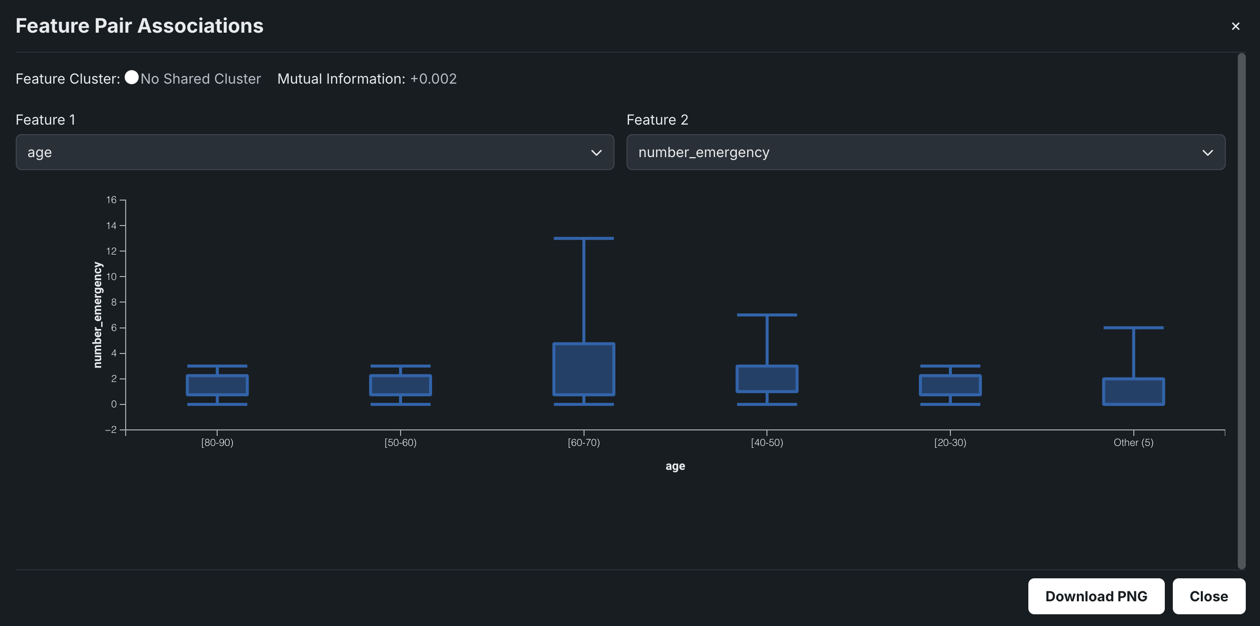
- Box and whisker plots for numeric vs. categorical features.
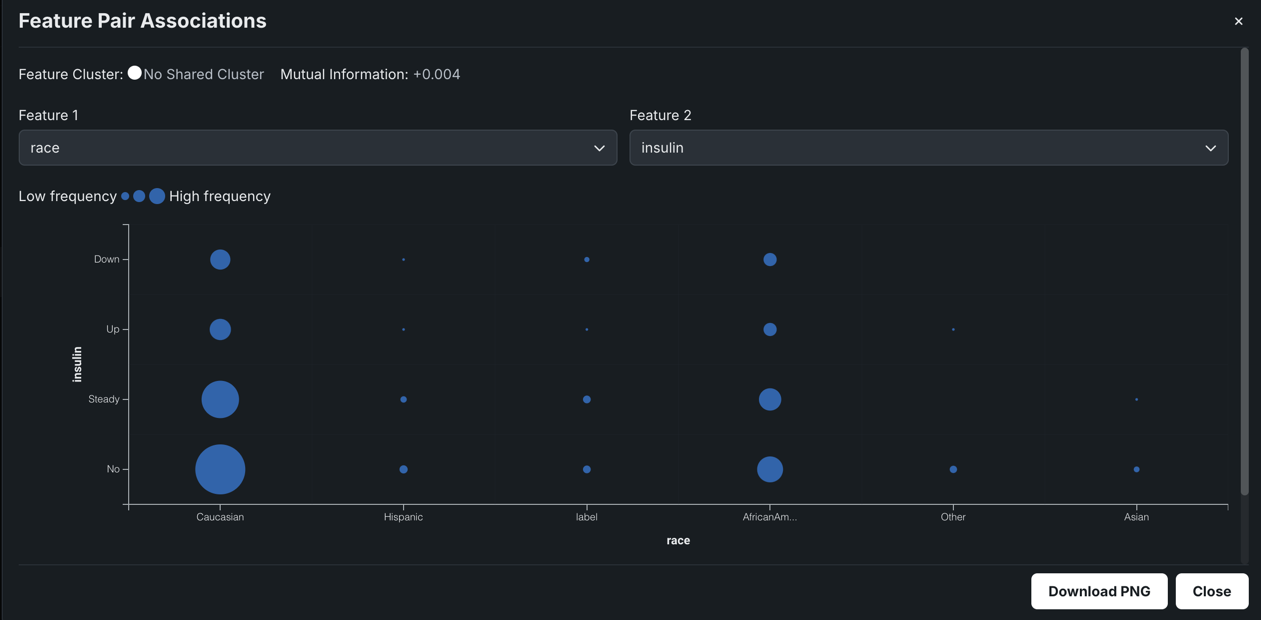
- Contingency tables for categorical vs. categorical features.
The following shows an example of each type, with a brief "reading" of what you can learn from the insight.
When comparing numeric features against each other, a scatter plot results with the X axis spanning the range of results. The dot size, or overlapping dots, represents the frequency of the value.
For example, in the chart above you might assume there's no discernible dependence of 12m_interest on reviews_seasonal, and as a result, the mutual information they share is very low.
Box and whisker plots graphically display upper and lower quartiles for a group of data. It is useful for helping to determine whether a distribution is skewed and/or whether the dataset contains a problematic number of outliers. Depending on the which feature sets the X or Y axis, the plot may rise vertically or lay horizontally. In either case, the end points represent the upper and lower extremes, with the box illustrating the highest occurrence of a value. DataRobot uses box and whisker plots to create insights for numeric and categorical feature pairs.
In the example above, the plot shows most of the variation of the online_sites feature occurs in the E1 locality. Among the other localities, there is very little dispersion.
When both features are categorical, DataRobot creates a contingency table which shows a frequency distribution of values for the selected features. The table can contain up to six bins, each representing a unique feature value. For features with more than five unique values, the top five are displayed with the rest accumulated in a bin named Other.
Read the table as follows: The dots are all bigger in the 12 month bucket because there are more total reviews than in the 9 month bucket. Since there is not a lot of variation in the dot sizes across the reviews_department buckets, knowledge about the last_response doesn't improve knowledge about reviews_department. The result is a low metric score.
Importance scores
On the Features tile, the green bars displayed in the Importance column are a measure of how much a feature, by itself, is correlated with the target variable. Hover on the bar to see the exact value.
What is importance?
The Importance bars show the degree to which a feature is correlated with the target. These bars are based on "Alternating Conditional Expectations" (ACE) scores. ACE scores are capable of detecting non-linear relationships with the target, but as they are univariate, they are unable to detect interaction effects between features. Importance is calculated using an algorithm that measures the information content of the variable; this calculation is done independently for each feature in the dataset. The importance score has two components—Value and Normalized Value:
Value: This shows the metric score you should expect (more or less) if you build a model using only that variable. For Multiclass,Valueis calculated as the weighted average from the binary univariate models for each class. For binary classification and regression,Valueis calculated from a univariate model evaluated on the validation set using the selected project metric.Normalized Value:Valuenormalized; scores up to 1 (higher scores are better). 0 means accuracy is the same as predicting the training target mean. Scores of less than 0 mean the ACE model prediction is worse than the target mean model (overfitting).
These scores represent a measure of predictive power for a simple model using only that variable to predict the target. (The score is adjusted by exposure if you set the Exposure parameter.) Scores are measured using the project's accuracy metric.
Features are ranked from most important to least important. The length of the green bar next to each feature indicates its relative importance—the amount of green in the bar compared to the total length of the bar, which shows the maximum potential feature importance (and is proportional to the Normalized Value)—the more green in the bar, the more important the feature. Hovering on the green bar shows both scores. These numbers represent the score in relation to the project metric for a model that uses only that feature (the metric selected when the project was run). Changing the metric on the Leaderboard has no effect on the tooltip scores.
Data Quality Assessment
The Data Quality Assessment capability automatically detects and surfaces common data quality issues and, often, handles them with minimal or no action on the part of the user. The assessment not only saves time finding and addressing issues, but provides transparency into automated data processing (you can see the automated processing that has been applied). It includes a warning level to help determine issue severity.
See the associated considerations for important additional information.
As part of EDA1, DataRobot runs checks on features that don’t require date/time and/or target information. Once EDA2 starts, DataRobot runs:
DataRobot always runs the following baseline data quality checks:
- Outliers
- Multicategorical format errors
- Inliers
- Excess zeros
- Disguised missing values
- Target leakage
- Missing images (Visual AI experiments)
Time series experiments run all the baseline data quality checks as well as checks for:
The Visual AI experiments Data Quality Assessment runs the same baseline checks and an additional missing image check:
Once model building completes, you can view the Data Quality Handling Report for additional imputation information.
Identify target leakage
When EDA2 is calculated, DataRobot checks for target leakage, which refers to a feature whose value cannot be known at the time of prediction, leading to overly optimistic models. A badge is displayed next to these features so that you can easily identify and exclude them from any new feature lists.
Related reading
To learn more about the topics discussed on this page, see:
Explore the assessment
The Data Quality Assessment provides information about data quality issues that are relevant to your stage of model building. Initially run as part of EDA1 (data ingest), the results report on the All Features list. It runs again and updates after EDA2, displaying information for the selected feature list (or, by default, All Features). For checks that are not applicable to individual features (for example, Inconsistent Gaps), the report provides a general summary.
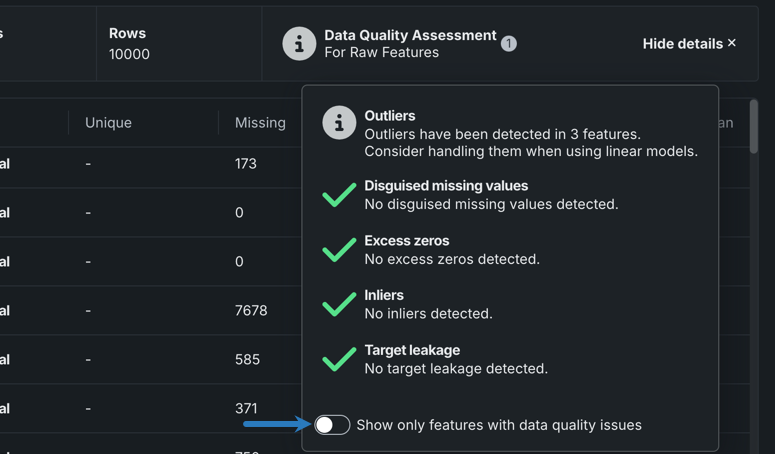
You can access the Data Quality Assessment by clicking Show Summary (unless already open, then the button displays Hide summary) on either the Data Preview or Features tile.
Then, click Show details to open a detailed report.
Each data quality check provides issue status flags, a short description of the issue, and a recommendation message, if appropriate:
| Status | Description |
|---|---|
| Warning | Attention or action required |
| Informational | No action required |
| Passing | No issue detected |
Because the results are feature-list based, it is possible that if you change the selected feature list, new checks will appear or current checks will disappear from the assessment. For example, if feature list List 1 contains a feature problem, which contains outliers, the outliers check will show in the assessment. If you change lists to List 2 which does not include problem (or any other feature with outliers), the outliers check will report "no issue" .
From within the assessment modal, you can filter by issue type to see which features triggered the checks. Toggle on Show only affected features and check boxes next to the check names to select which checks to display:
DataRobot then displays only features violating the selected data quality checks, and within the selected feature list. You can hover on an icon for more detail.
For multilabel and Visual AI experiments, Preview Log displays at the top if the assessment detects multicategorical format errors or missing images in the dataset. Click Preview Log to open a window with a detailed view of each error, so you can more easily find and fix them in the dataset.
Summarized categorical features
The summarized categorical variable type is used for features that host a collection of categories (for example, the count of a product by category or department). If your original dataset does not have features of this type, DataRobot creates them (where appropriate as described below) as part of EDA2. The summarized categorical variable type offers unique feature details in its Overview, Histogram, Category Cloud, Illustration, and Table insights.
Note
You cannot use summarized categorical features as your target for modeling.
Required dataset formatting
For features to be detected as the summarized categorical variable type (shown in the Var Type column on the Data tab), the column in your dataset must be a valid JSON-formatted dictionary:
"Key1": Value1, "Key2": Value2, "Key3": Value3, ...
"Key":must be a string.Valuemust be numeric (an integer or floating point value) and greater than 0.- Each key requires a corresponding value. If there is no value for a given key, the data will not be usable.
- The column must be JSON-serializable.
The following is an example of a valid summarized categorical column:
{“Book1”: 100, “Book2”: 13}
An invalid summarized categorical column can look like any of the following examples:
-
{‘Book1’: 100, ‘Book2’: 12}- The key is not in quotation marks (not JSON-serializable).
-
{‘Book1’: ‘rate’,‘Book2’: ‘rate1’}- These values are strings instead of positive numeric values.
-
{“Book1”, “Book2”}- This example is not in JSON dictionary format.
Average target values
After EDA2, DataRobot displays orange circles as graph overlays on the Histogram and Frequent Values charts. The circles indicate the average target value for a bin. (These circles are connected for numeric features and not for categorical, since the ordering of categorical variables is arbitrary and histograms display a continuous range of values.)
For example, consider the feature num_lab_procedures:
In this example, there are 846 people who had between 44-49.999999 lab procedures. The average target value represented by the circle (in this case, the percent readmitted) is 37.23%. (The orange dots correspond to the right axis of the histogram.)
How Exposure changes output
If you used the Exposure parameter when building models for the experiment, the Histogram and Frequent values tabs display the graphs adjusted to exposure. In this case:
- The number of rows in each bin.
- The sum of exposure in each bin. That is, the sum of the weights for all rows weighted by exposure.
- The sum of target value divided by the sum of the exposure in a bin.
How Weight changes output
If you set the Weight parameter for an experiment, DataRobot weights the number of rows and average target values by weight.
