How-to: Execute a use case in DataRobot Notebooks
This walkthrough shows you how to execute a code-first use case using an AI accelerator with DataRobot Notebooks. You will:
- Access and download an AI accelerator.
- Create a Use Case in Workbench.
- Upload the AI accelerator as a notebook in the Use Case.
- Execute the accelerator in DataRobot Notebooks.
Prerequisites
Before proceeding with the workflow:
- Review the [API quickstart guide]api-quickstart{ target=_blank } to get familiar with common API tasks and configuration.
- Review the use case summary here.
1. Access the AI accelerator
This walkthrough leverages the DataRobot API to quickly build multiple models that work together to predict common fantasy baseball metrics for each player. After reviewing the use case summary from the link in the prerequisites, download a copy of the accelerator on GitHub to your machine.
2. Create a Use Case in Workbench
From the Workbench directory, click Create Use Case in the upper right.
Read more: Use Cases
3. Upload the accelerator
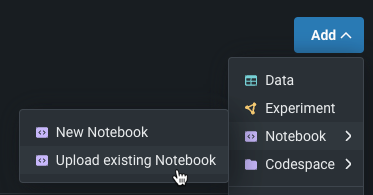
In the newly created Use Case, upload the AI accelerator as a notebook to work with it in DataRobot. Select Add > Notebook > Upload existing notebook. Select the local copy of the AI accelerator that you previously downloaded, then click Upload. When uploading completes, select Import.
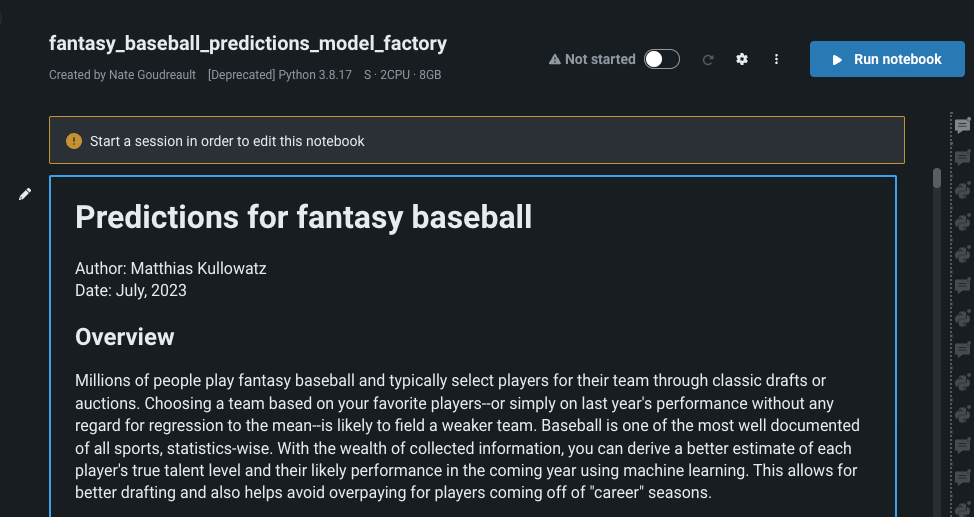
Once uploaded, the accelerator will open in DataRobot Notebooks as part of the Use Case.
Read more: Add notebooks
4. Configure the notebook environment
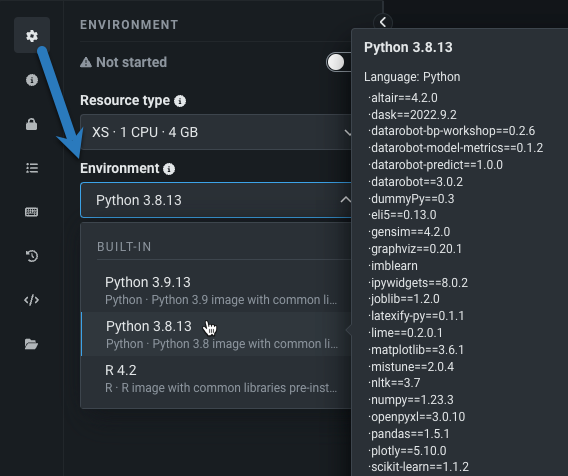
To edit, create, or run the code in the accelerator, you must first configure and then run the notebook environment. The environment image determines the coding language, dependencies, and open-source libraries used in the notebook. To see the list of all packages available in the image, hover over it in the Environment tab:
Review the available environments, and, for this walkthrough, select the Python 3.9.18 image and select the default environment settings.
Read more: Environment management
5. Run the environment
To begin working with the accelerator, start the environment by toggling it on in the toolbar.
Wait a moment for the environment to initialize, and once it displays the Started status, you can begin coding, editing, and executing code.
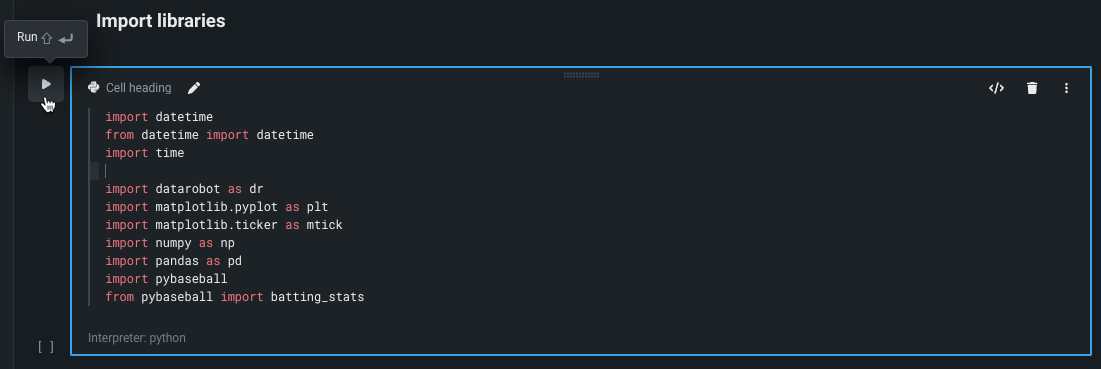
Read through the use case and execute the code cells as you go. To execute code, select the play button next to a cell.
Read more: Create and execute cells
6. Install and import libraries
To install the pybaseball library, edit the cell to uncomment the pip install command, then run the cell.
Run the cell that follows, which imports the notebook's required libraries.
7. Import data
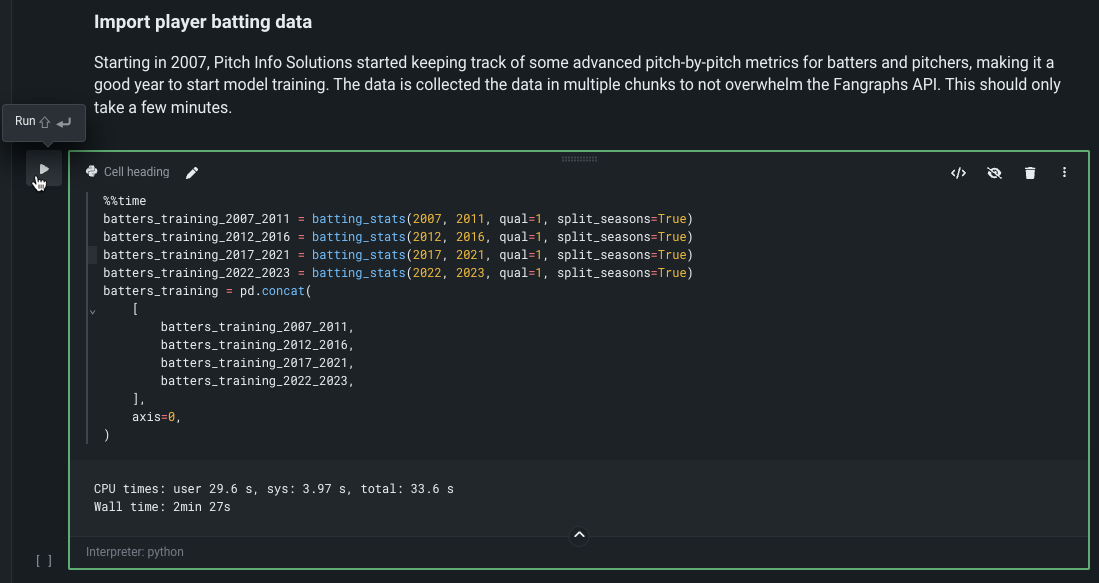
Run the "Import player batting data" cell to get the data used in this accelerator. The cells that follow structure and prepare the data for modeling.
8. Build models
After preparing the data, the accelerator creates a DataRobot experiment to train many models against the assembled dataset. This accelerator leverages Feature Discovery, an automated feature engineering tool in DataRobot that uses the secondary dataset in previous steps to derive rolling, time-aware features about baseball players' recent performance history. Follow the cells to begin the modeling process.
Read more: Feature Discovery
9. Make predictions
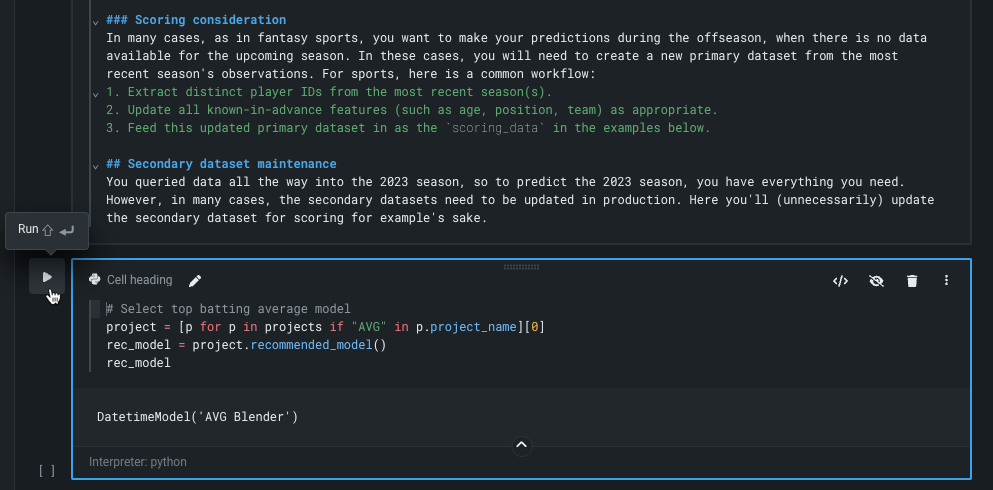
After successfully building models, the accelerator points you to the Leaderboard to evaluate them. Select one of the top-performing models to test that it can successfully make predictions with test data. For this walkthrough, DataRobot recommends the AVG Blender model. Before making predictions, review the considerations, options, and maintenance for scoring baseball player data (detailed in the screenshot below), then execute the code.
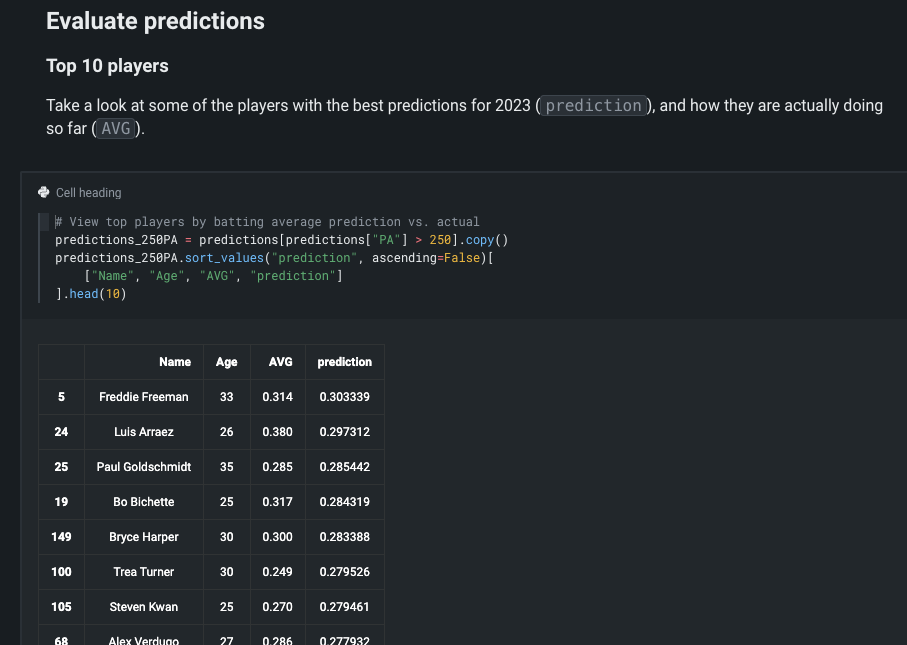
When predictions are returned, you can evaluate the top ten players' predicted batting averages.
Read more: DataRobot Prediction API
10. Plot a Lift Chart
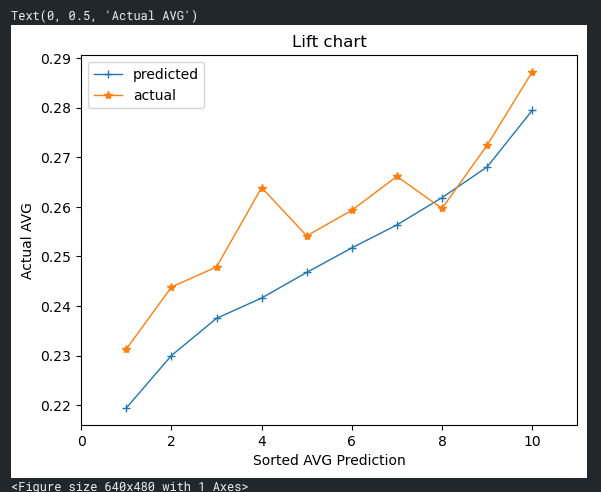
Lastly, use the code to create a Lift Chart that compares predicted batting averages to actual batting averages (actuals). The fact that the actual batting averages are running higher than the predicted batting averages is due to sampling biases. For example, only players with at least 250 plate appearances through mid-July are evaluated—the players likely being selected because they are playing better. Additionally, with only half a season of data, the volatility of outcomes is greater than had the model trained on a full season, inflating the highest batting averages in the chart.
Read more: Lift Chart


