How-to:「データと会話する」エージェントの構築
データと会話するエージェントでは、任意のデータソースから未処理のデータをアップロードして質問することができます。 エージェントはビジネス分析を提案し、結果の解釈に役立つチャート、表、およびコードを生成します。 DataRobot Youtubeチャンネルでは、基本ステップに関する動画を視聴できます。
この基本ステップでは、次のことを行います。
- アプリケーションテンプレートギャラリーから、データと会話するエージェントのテンプレートを選択します。
- Codespaceでアプリケーションテンプレートを設定します。
- Pulumiスタックを構築し、アプリケーションを開きます。
- データをロードし、データディクショナリを自動的に生成します。
- エージェントと対話し、自然言語クエリーをSQL/Pythonコードに変換して、データが示す内容、パターンが存在する理由、推奨される次のステップを説明します。
スケーラビリティ
大規模なデータセットを扱う場合、SnowflakeまたはBigQueryに接続すると、SQLを使ってクラウド上で直接分析を実行できます。 これは、クラウドコンピューティングを利用してデータをクラウドに保持するため、大規模なデータセットに最適です。
データ品質
AIエージェントは、さまざまなデータセットを統合されているかのように扱って、明示的な指示なしに、その都度結合やマージを実行できます。 また、エージェントは取り込み時に、データの不整合、特殊文字の問題、フォーマットの問題など、一般的なデータ品質の問題を事前に解決します。
ダウンロードするアセット
この基本ステップで図示した内容を再現するには、以下のCSVファイルをダウンロードします。
前提条件
アプリケーションテンプレートギャラリーから、データと会話するエージェントアプリケーションを構築するには、以下のものが必要です。
- DataRobotのGenAIおよびMLOps機能へのアクセス権
- DataRobot APIトークン。
- DataRobotのエンドポイント
-
次のいずれかの大規模言語モデル(LLM)の認証情報:
- Azure OpenAI
- VertexAI
- Amazon Web Services(AWS)のAnthropic
1. データと会話するエージェントのテンプレートを開く
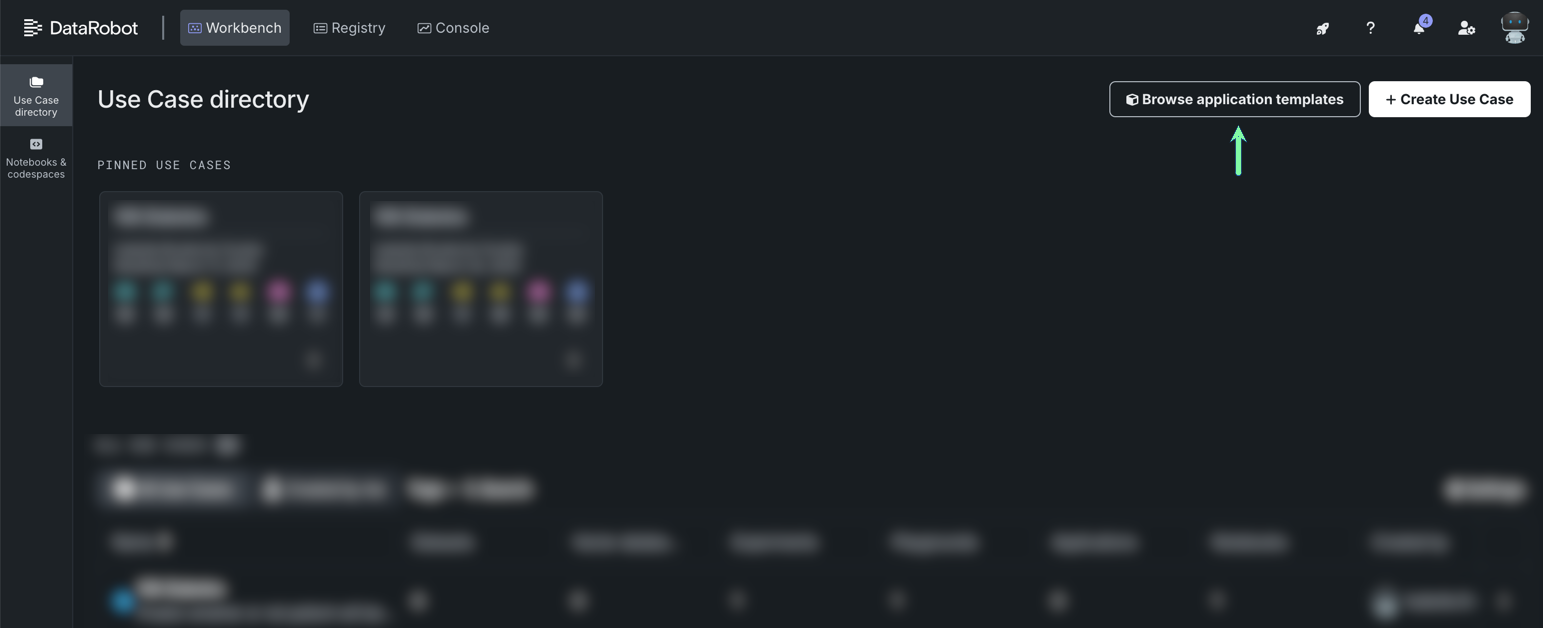
ワークベンチのユースケースディレクトリで、アプリケーションテンプレートを参照をクリックします。
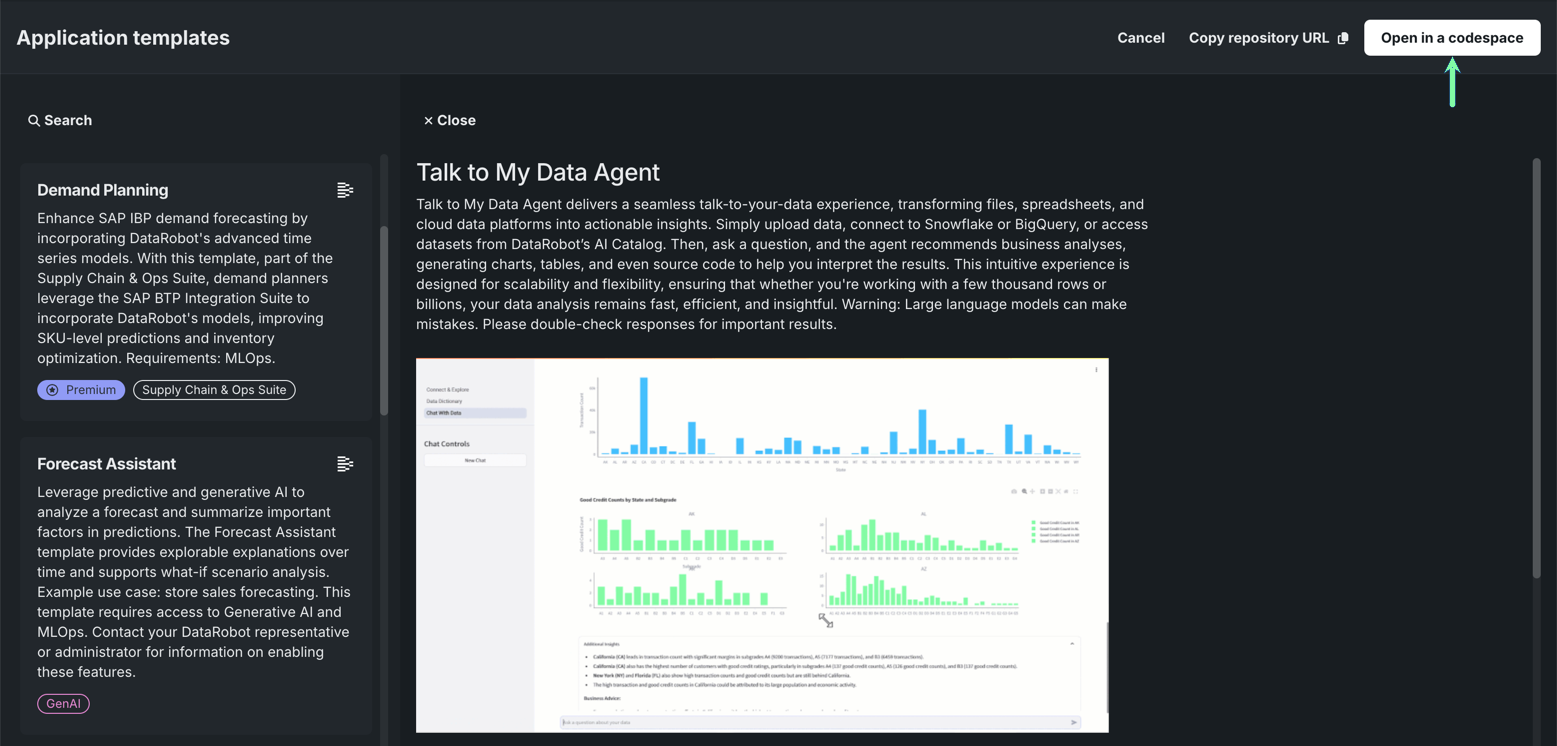
データと会話するエージェントを選択し、右上隅にあるCodespaceで開くをクリックします。
この基本ステップでは、codespaceでのアプリケーションテンプレートの操作に重点を置いていますが、リポジトリのURLをコピーをクリックし、そのURLをブラウザーに貼り付けると、GitHubでテンプレートを開くことができます。
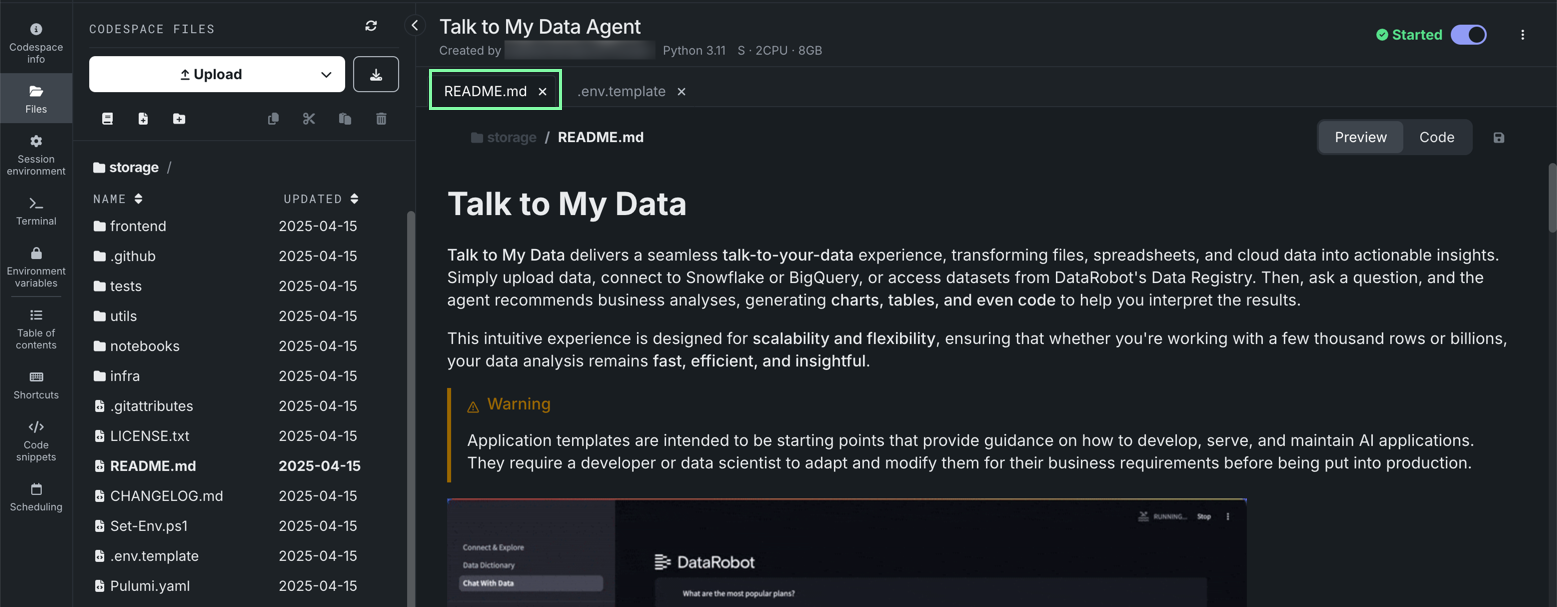
DataRobotが開き、codespaceの初期化が開始されます。 セッションが開始されると、テンプレートファイルが左側に表示され、中央にREADMEが開きます。 Codespaceインターフェイスの詳細については、Codespaceセッションを参照してください。
ヒント
ユースケースが自動的に作成されるため、今後はユースケースディレクトリからこのcodespace(および生成されたアセット)にアクセスできます。
2. Codespaceの設定
READMEファイルに含まれる指示に従ってください。
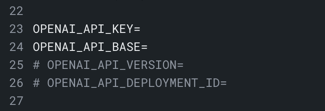
左側のファイルブラウザーからアクセスできる.envファイルでは、以下のフィールドが必須です。
DATAROBOT_API_TOKEN:DataRobotのユーザー設定 > APIのキーとツールから取得します。DATAROBOT_ENDPOINT:DataRobotのユーザー設定 > APIのキーとツールから取得します。PULUMI_CONFIG_PASSPHRASE:自分で選んだ英数字のパスフレーズ。- LLM認証情報。 すべてのアプリケーションテンプレートは生成AIを利用しているため、DataRobotでは、Azure OpenAI、VertexAI(Google Cloud)、AWS上のAnthropicをすぐに使用できます。
3. Pulumiスタックを実行し、アプリケーションを開く
左側のパネルでターミナルタイルをクリックします。
表示されたターミナルペインでpython quickstart.py YOUR_PROJECT_NAMEを実行し、YOUR_PROJECT_NAMEを一意の名前に置き換えます。 その後、Enterを押します。
Pulumiスタックの実行には数分かかる場合があります。 完了すると、ターミナル内の結果の最後にURLが表示されます。 デプロイされたアプリケーションを表示するには、URLをコピーしてブラウザーに貼り付けます。
ヒント
レジストリにもアプリケーションが作成されます。 このアプリケーションに再度アクセスするには、レジストリ > アプリケーションに移動します。
4. データのロードと探索
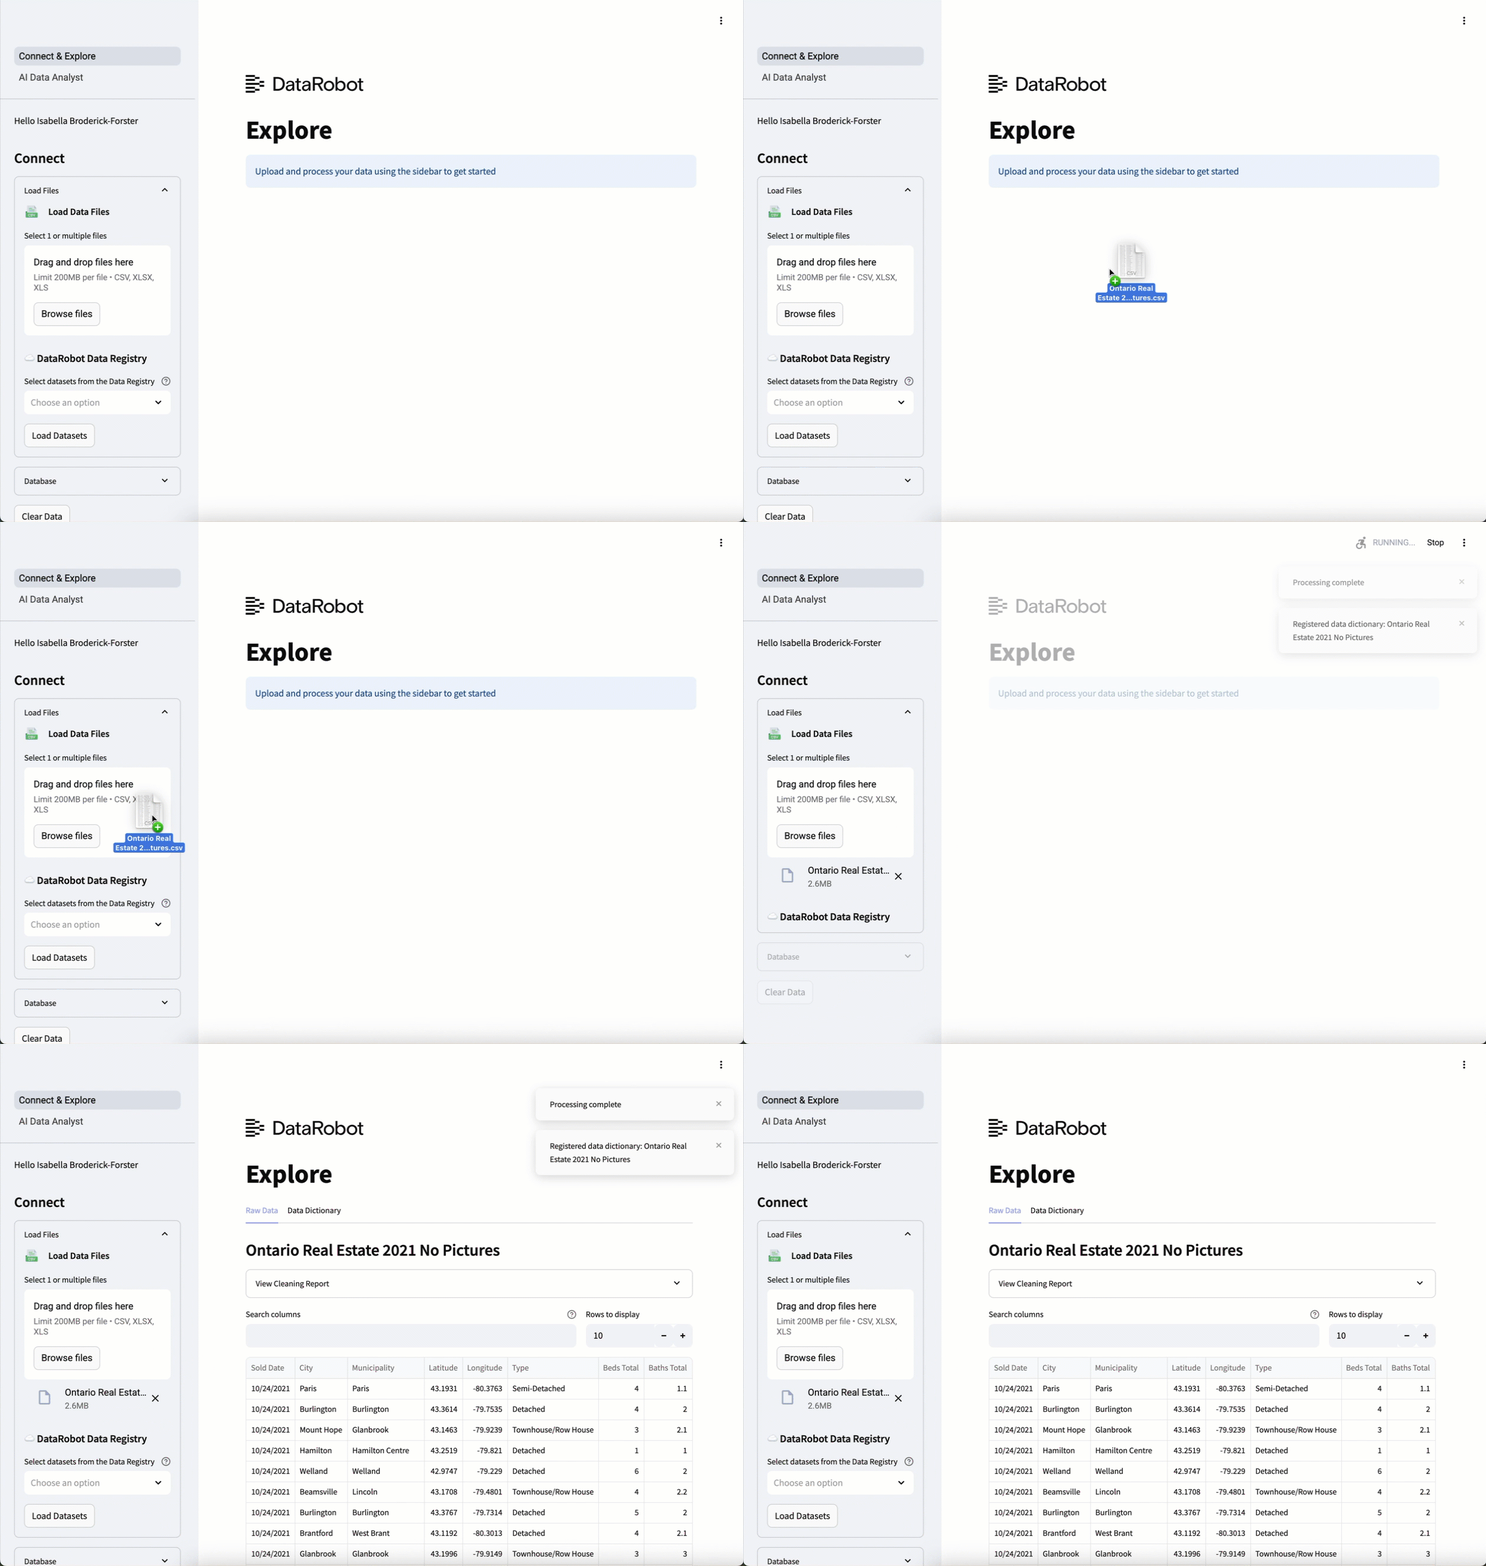
.csvまたは複数タブのExcelファイルから1つ以上のデータセットをアップロードするか、Snowflake、BigQuery、DataRobotのAIカタログなどのデータソースに直接接続します。 取り込まれると、AIエージェントはデータを結合してクリーニングし、即座に分析できるようにデータディクショナリを自動的に生成して開きます。
ディクショナリはAIによって生成され、明確な列の定義とメタデータを提供します。 列を編集して独自のビジネス視点を取り入れた後、データディクショナリをダウンロードをクリックして、更新された定義をエクスポートできます。
この例のデータセットは、カナダのオンタリオ州における2021年の不動産情報です。この情報には、不動産取引に関する情報、売却された物件の詳細(所在地、種類、面積、特徴など)、物件が所在する地域の人口統計データや経済データなどが含まれています。
5. エージェントと会話する
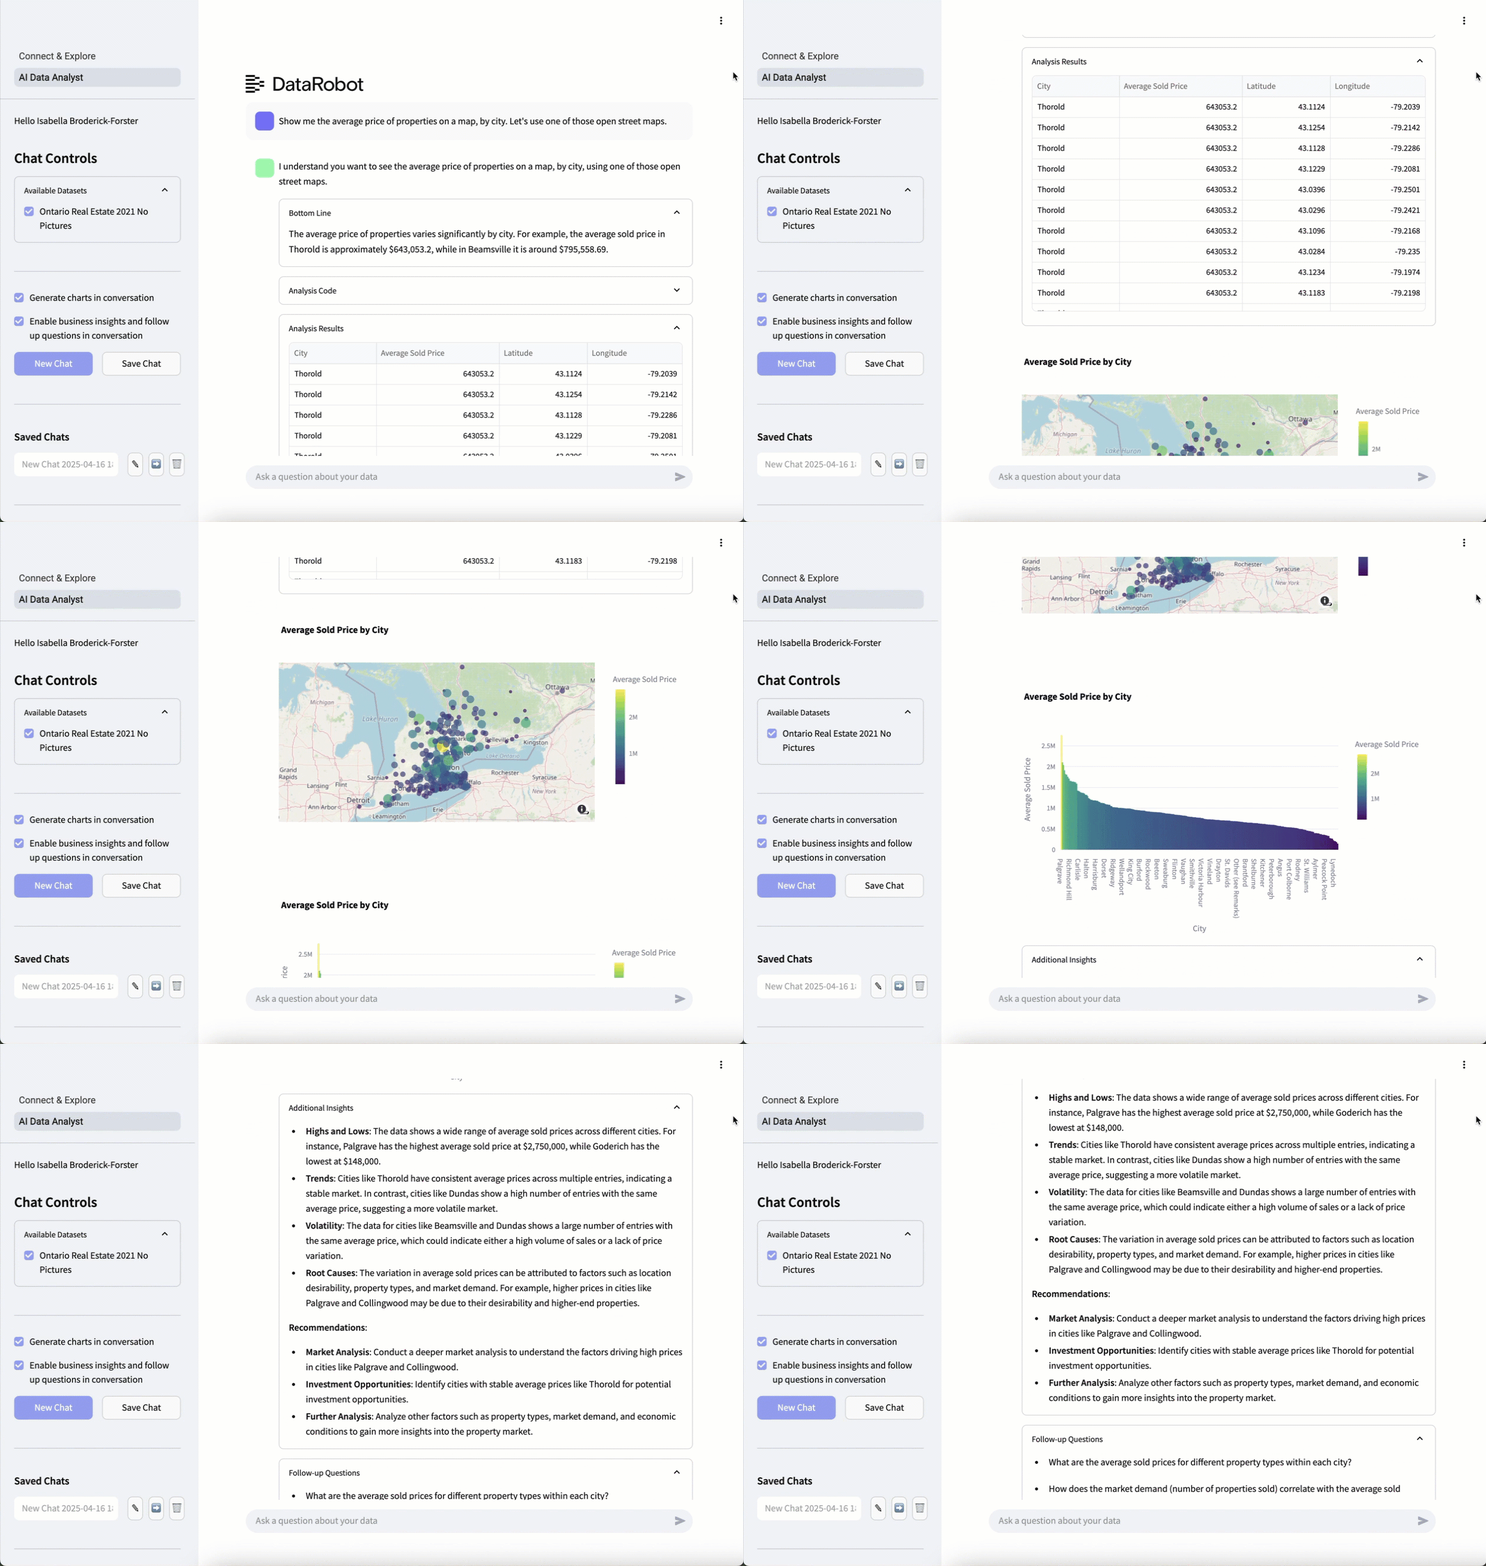
AIエージェントとの会話を開始するには、AIデータアナリストをクリックします。 下部の検索バーに、平易な言葉でリクエストを入力します。 この例では、リクエストはShow me the average price of properties on a map, by city. Let's use one of those open street maps.(地図上の物件の平均価格を都市別に示してください。オープンストリートマップを使ってみましょう。)です。
エージェントはすぐに、ユーザーが確認したい情報(オープンストリートマップを使用した、地図上の都市別の平均物件価格)を理解していることを伝えます。 リクエストを処理すると、エージェントは、要求された情報を含む表、対話型のオープンストリートマップ、および最も価格の高い地域を一目で確認できる棒グラフの形式で、実用的なインサイトと視覚化を提供します。
結果を確認した後、さらに詳しく知りたい場合は、追加の質問をすることができます。 この例では、追加のリクエストはBreak that down further by property type.(それを物件の種類ごとにさらに分類してください。)です。最初からやり直す必要はなく、エージェントは最初のリクエストを出発点として追加のリクエストを行います。
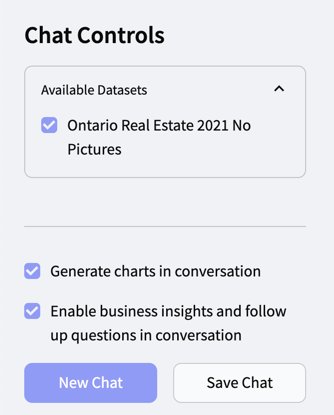
左側のチャットを保存をクリックすると、有用なチャットを保存することもできます。また、新しいチャットをクリックすると、チャットを最初からやり直すことができます。
