保険金請求に対する優先順位の設定
このページでは、保険金請求の複雑さと重大度をできるだけ早い段階で評価するユースケースの概要を紹介します。このユースケースは、請求に対するルーティングを最適化して、適度な注意を払い、請求者とのコミュニケーションを改善することを目的とします。 このユースケースは、UI操作をベースにした基本ステップとして、以下で説明します。
ビジネス上の問題
通常、保険会社の最大の費用は、保険金の支払いと保険金の調整です。 負傷した労働者の医療費や賃金の損失をカバーするといった、長期にわたる労災補償のような事業では、請求金の支払いが完了するまで数年かかる可能性があります。そのため、請求1件あたりの実際のコストが不明な状態が長年にわたって続くことがあります。 ただし、保険会社に請求が通知された時点で、支払査定手続きが開始されます。
通常、従業員が職務中に負傷した場合(Accident Date)、雇用主(被保険者)は保険会社に請求申請を行います(Report Date)、保険会社の請求システムで、報告時に請求に関するすべての情報を含む請求レコードが作成されます。 その後、請求が保険査定者に割り当てられます。 この割り当てを、完全に無作為にすることも、大まかに定義されたビジネスルールに基づいて決めることもできます。 請求過程中に、割り当てが複数回再評価され、別の保険査定者に再割り当てされる場合があります。
ただし、この処理にはコストが伴う結果が発生します。
-
保険業界では、保険請求の20%が保険金支払総額の80%を占めることがよく知られています。 請求を無作為に割り当てると、リソースが無駄になります。
-
最適な請求結果を得るには、早期介入が極めて重要です。 できる限り早く適切なリソースを割り当てないと、一見軽度の保険金請求が深刻になる場合があります。
-
重篤度と複雑度が低い請求については、他のすべての請求と一緒に処理されるまで待つ必要があり、多くの場合、カスタマーエクスペリエンスの低下につながります。
-
一般的な保険査定者は、既存の未解決の請求に加えて、毎月数百件の新しい請求を受け取る可能性があります。 保険査定者に負荷がかかりすぎると、割り当てられたすべての保険請求を処理できる能力が低減します。 長期にわたると、保険金請求者は、プロセスを早めるために弁護士を雇う可能性が高くなり、不必要に請求のコストを押し上げます。
ソリューションの価値
-
課題:保険金請求の複雑さと重篤度をできるだけ早く評価できるように保険会社を支援し、次のことを実現します。
- 重篤度と複雑度が低い請求をストレートスルー処理に回送すると、待ち時間が短くなり、カスタマーエクスペリエンスが向上します。
- 経験豊富な保険査定者と看護師のケースマネージャーが、非常に複雑な請求に必要な対処をします。
- 保険金請求者と被保険者との間のコミュニケーションが改善されると、弁護士の関与を最小限に抑えられます。
- 経験豊富な査定員と若手の査定員との間で知識が効率的に共有されます。
-
望ましい結果
- 請求リソースをより効率的に割り当てることにより、損害調査コストを削減します。
- 看護師のケースマネージャーと経験豊富な査定員を、重大度が高い請求に効果的に割り当てて、請求のコストを削減します。
-
DataRobotはどのようにお手伝いできますか。
- 初回損害通知(FNOL)の時点で請求レベルおよび保険契約レベルの属性を使用する機械学習モデルは、請求のライフサイクルの初期段階で、請求の重篤度とさまざまな保険契約の属性との間の複雑な関係を理解するのに役立ちます。 モデル予測を使用して、程度の低いものから重大なものまで新しい請求をランク付けします。 しきい値は、保険査定者が処理できる能力(低、中、高の重篤度)、または請求量の認識レベルに基づく、業務内容によって決定できます。 保険金請求の重篤度と請求件数の組み合わせに基づいて、しきい値を作成することもできます。 これらのしきい値とモデル予測を使用して、保険金請求を効率的に回送します。
| トピック | 説明 |
|---|---|
| ユースケースの種類 | 保険/請求トリアージ |
| 対象者 | 保険査定者 |
| 指標/KPI |
|
| サンプルデータセット | ダウンロードはこちら |
問題のフレーミング
機械学習モデルは、過去の観測値データから複雑なパターンを学習します。 これらのパターンを使用して、新しいデータでの予測を行うことができます。 このユースケースでは、過去の保険金請求データを使用してモデルを構築します。 新しい保険請求が報告されると、モデルにより予測が行われます。
問題の枠組みに応じて、予測は異なる意味を持つ場合があります。 この請求トリアージのユースケースの目標は、できるだけ早く、理想的には請求が報告された瞬間(初回損害通知、またはFNOL)に、モデルで労災補償請求の重篤度を評価することです。 ターゲット特徴量は請求の支払総額に関連しており、モデリング単位は個々の請求です。
請求の支払総額がターゲットとして扱われる場合、数量の予測になるため、ユースケースでは連続値問題として位置付けられます。 次に、予測された支払総額を、ビジネスニーズによって定義された重篤度の低い請求のしきい値と比較して、各請求を低、中、高の重篤度に分類します。
あるいは、このユースケースを分類の問題として捉えることができます。 これを行うには、まず前述のしきい値を保険金支払総額に適用し、それを「低」、「中」、「高」のレベルのカテゴリー特徴量に変換します。 次に、このカテゴリー型特徴量をターゲットとして使用する分類モデルを構築できます。 代わりに、モデルは、請求が低、中、高の重篤度になる確率を予測します。
問題の枠組みに関係なく、最終的な目標は保険金請求を適切な回送先に送ることです。
ROIによる見積もり
このユースケースでは、直接的な投資収益率(ROI)は、改善された請求処理結果と経費削減から得られます。 カスタマーエクスペリエンスの向上から間接的なROIが得られ、それが顧客ロイヤルティの向上につながります。 以下の手順では、次の仮定に基づく直接的なROI計算に注目します。
- 毎月1万件の請求
- カテゴリーI:請求の30%(3000)がストレートスルー処理(STP)に回されます
- カテゴリーII:請求の60%(6000)が正常に処理されます
- カテゴリーIII:請求の10%(1000)が、経験豊富な保険査定者により処理されます
- 平均的なカテゴリーIの請求の重篤度は、モデルがない場合250で、モデルがある場合275です
- 平均的なカテゴリーIIの請求の重篤度は、モデルがない場合10000で、モデルがある場合9500です
- 守られた労働力:平均年収65000の正社員3人
Total annual ROI = 65000 x 3 + [3000 x (250-275) + 1000 x (10000 - 9500)] x 12 = $5295000
データの操作
このユースケースのサンプルデータは、労災保険会社の請求データベースからの合成データセットで、個々の請求レベルで整理されています。 保険会社のほとんどの請求データベースにはトランザクションデータが含まれています。つまり、1件の請求が請求データベースに複数のレコードを持つ場合があります。 保険請求が最初に報告されると、請求システムに記録され、請求に関する初期情報が記録されます。 保険会社のガイドラインに従って、ケース準備金が設定される場合があります。 請求の支払いが行われるか、収集された追加情報によりケース準備金を変更する必要がある場合、準備金はそれに応じて調整されます。
ポリシーレベルの情報も予測することができます。 このタイプの情報には、クラス、業界、職務内容、従業員の在職期間、雇用主の規模、および職場復帰プログラムの有無などが含まれます。 この例では無視されていますが、モデリングデータセットを形成するには、ポリシー属性を請求データと結合する必要があります。
保険金請求のトリアージに関しては、保険会社は、保険金請求がどの程度深刻であるかをできる限り早期に把握したいと考えています。 ただし、情報が不十分であるため、FNOL時点では請求の重篤度を正確に見積もることができない場合があります。 したがって、実際には、保険請求のライフサイクルのさまざまな段階 (FNOL、30日、60日、90日など)で請求の重篤度を予測するには、一連の保険請求トリアージのモデルが必要です。
各モデルの目標は、請求の重篤度を予測することです。したがって、ターゲット特徴量は請求に対する保険金支払総額です。 トレーニングデータに含まれる特徴量は、さまざまなスナップショットでのクレーム属性とポリシー属性です。 たとえば、FNOLモデルの場合、特徴量はFNOLでの請求について既知の特徴量に限定されます。 実際のFNOLデータを記録していない従来のシステムをまだ使用している保険会社の場合、多くの場合、概算は0~30日で行われます。
特徴量の概要
次の表は、 サンプルトレーニングデータセットの主要な特徴量の概要を示しています。
| 特徴量名 | データ型 | 説明 | データソース |
|---|---|---|---|
| ReportingDelay | 数値 | 事故発生日から報告日までの日数 | 保険請求 |
| AccidentHour | 数値 | 事故が発生した時間 | 保険請求 |
| Age | 数値 | 保険金請求者の年齢 | 保険請求 |
| Weekly Rate | 数値 | 週収入 | 保険請求 |
| Gender | カテゴリー | 保険金請求者の性別 | 保険請求 |
| 配偶者の有無 | カテゴリー | 保険金請求者の結婚の有無 | 保険請求 |
| HoursWorkedPerWeek | 数値 | 保険金請求者の1週間当たりの通常の労働時間数 | 保険請求 |
| DependentChildren | 数値 | 保険金請求者の扶養児童の数 | 保険請求 |
| DependentsOther | 数値 | 保険金請求者の扶養者数(児童を除く) | 保険請求 |
| PartTimeFullTime | 数値 | 保険金請求者の雇用形態(常勤/非常勤) | 保険請求 |
| DaysWorkedPerWeek | 数値 | 保険金請求者の1週間当たりの労働日数 | 保険請求 |
| DateOfAccident | 日付 | 事故の発生日 | 保険請求 |
| ClaimDescription | テキスト | 事故および怪我の説明(テキスト) | 保険請求 |
| ReportedDay | 数値 | 保険金請求が保険会社に報告された曜日 | 保険請求 |
| InitialCaseEstimate | 数値 | 請求担当者が設定した最初のケースの見積もり額 | 保険請求 |
| Incurred | 数値 | ターゲット:保険金請求の最終費用 = 保険会社による支払い総額 | 保険請求 |
データプレパレーション
サンプルデータは保険金請求単位で構成されています。各行は保険金請求レコードで、請求のすべての属性は初回損害通知(FNOL)時に取得されています。 一方、ターゲット特徴量であるIncurredは、請求処理が完了したときの支払総額です。 したがって、データには、処理が完了していない保険金請求はありません。
通常、労災保険会社の保険金請求データベースは、取引単位で保存されています。 つまり、保険金の一部支払いや積立金の変更など、請求に対して変更があるたびに新しいレコードが作成されます。 このユースケースでは、最初に保険金請求が報告されたときに請求 (および請求に関連するすべての属性) のスナップショットが作成され、その後請求処理が完了したときに (目標額から支払総額まで) 再度スナップショットが作成されます。 保険契約レベルの情報も予測できます。たとえば、職位、業種、職務内容、勤続年数、勤務先の規模、職場復帰プログラムの有無などを予測できます。保険契約の属性を保険金請求のデータと結合して、モデリングデータセットを形成する必要があります。
データの評価
モデリングデータがDataRobotにアップロードされると、 EDAはデータの簡単なサマリーを作成します。このサマリーには、特徴量型の説明、数値特徴量のサマリー統計、各特徴量の分布などが含まれます。 データ品質評価によって、モデリングプロセスでは適切なデータのみが使用されます。 データタブに移動すると、データの詳細を確認することができます。
探索的データ解析
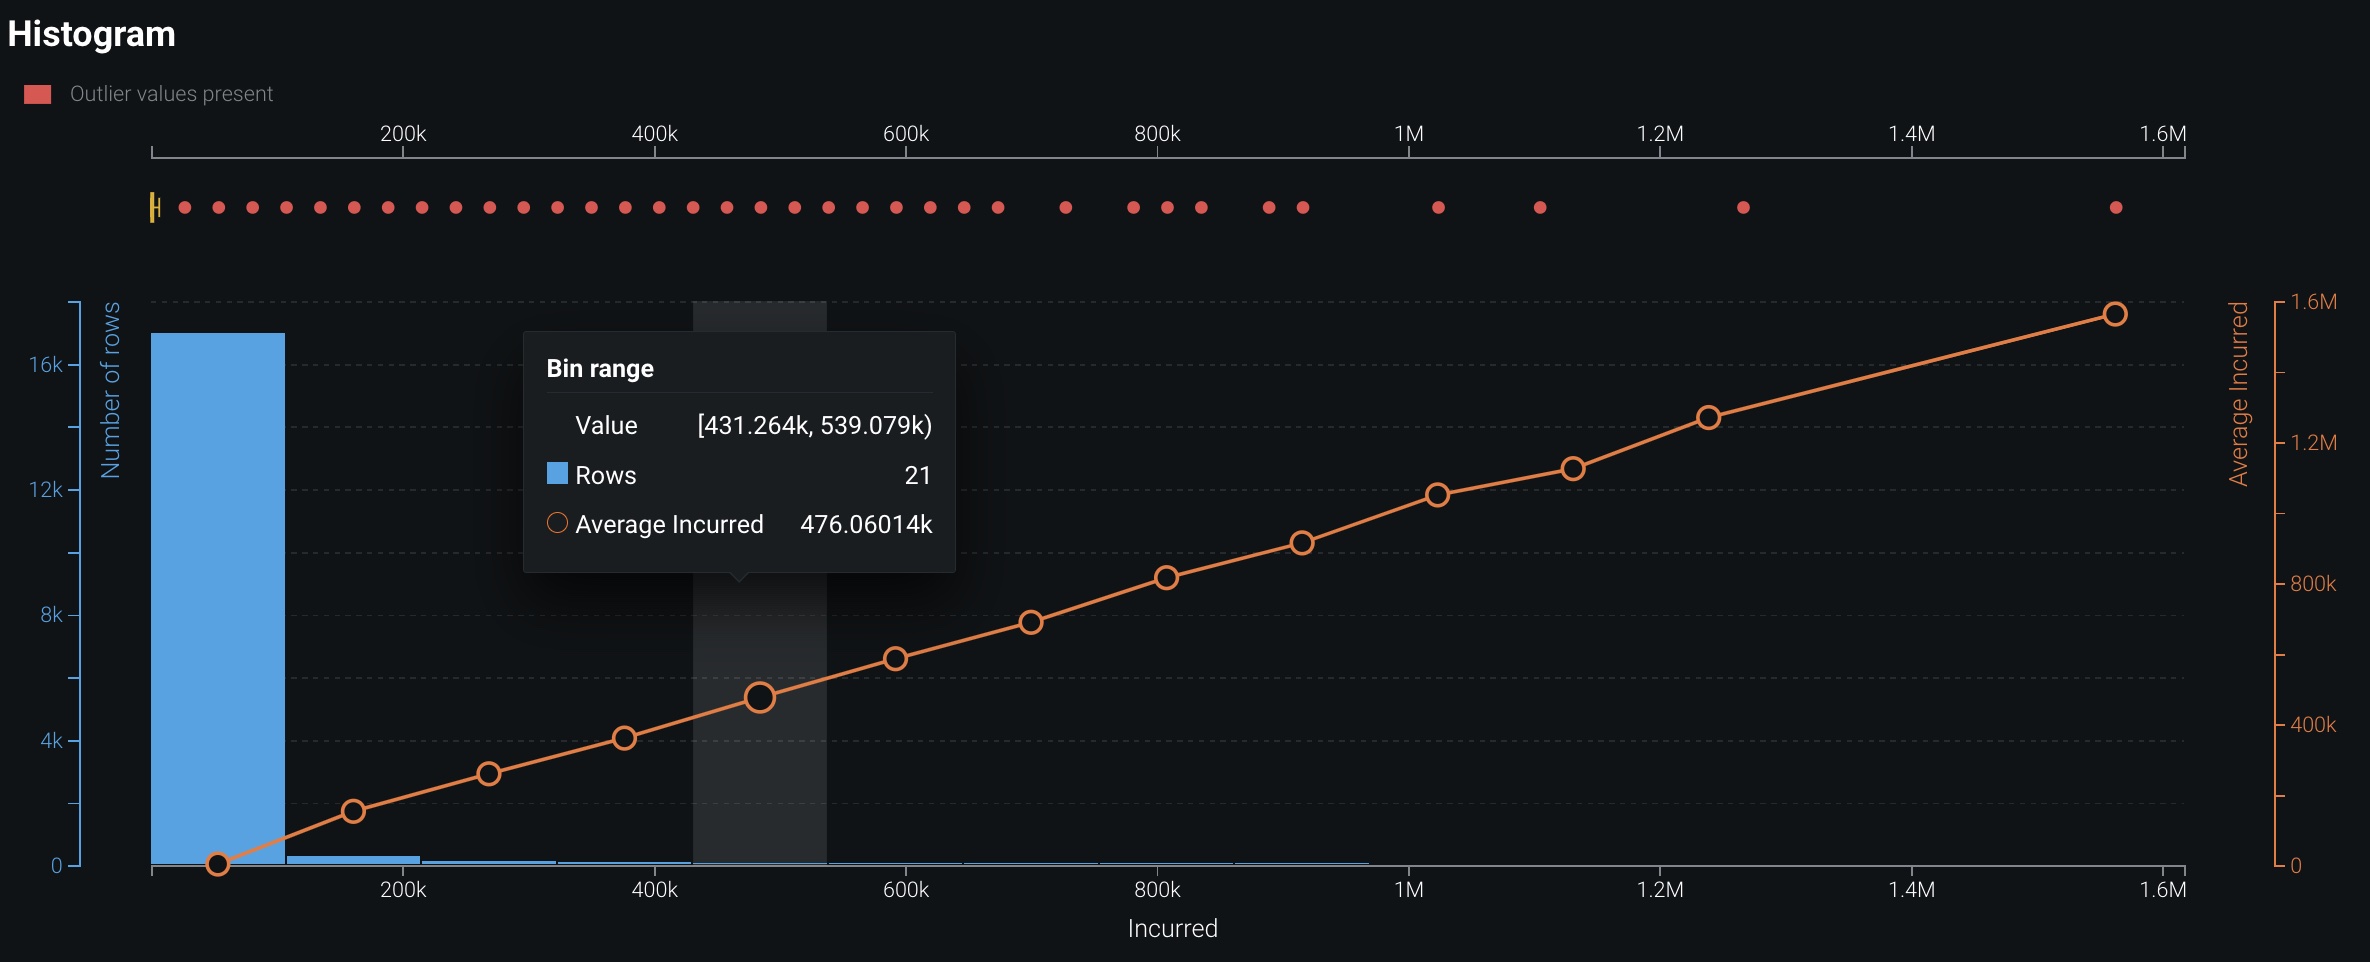
各特徴量をクリックすると、数値特徴量のサマリー統計(最小、最大、平均、標準偏差)や、特徴量とターゲットの関係性を表す ヒストグラムなどの情報を見ることができます。
DataRobotは、データ品質チェックを自動的に行います。 この例では、ターゲット特徴量で外れ値を検出しています。 外れ値を表示をクリックすると、すべて表示されます(保険金請求データには外れ値がよくあります)。 外れ値によるバイアスを回避するために、ターゲットに上限を設ける(たとえば、95パーセンタイルを上限とする)ことが一般的です。 この上限は、特に線形モデルで重要です。
特徴量の関連性
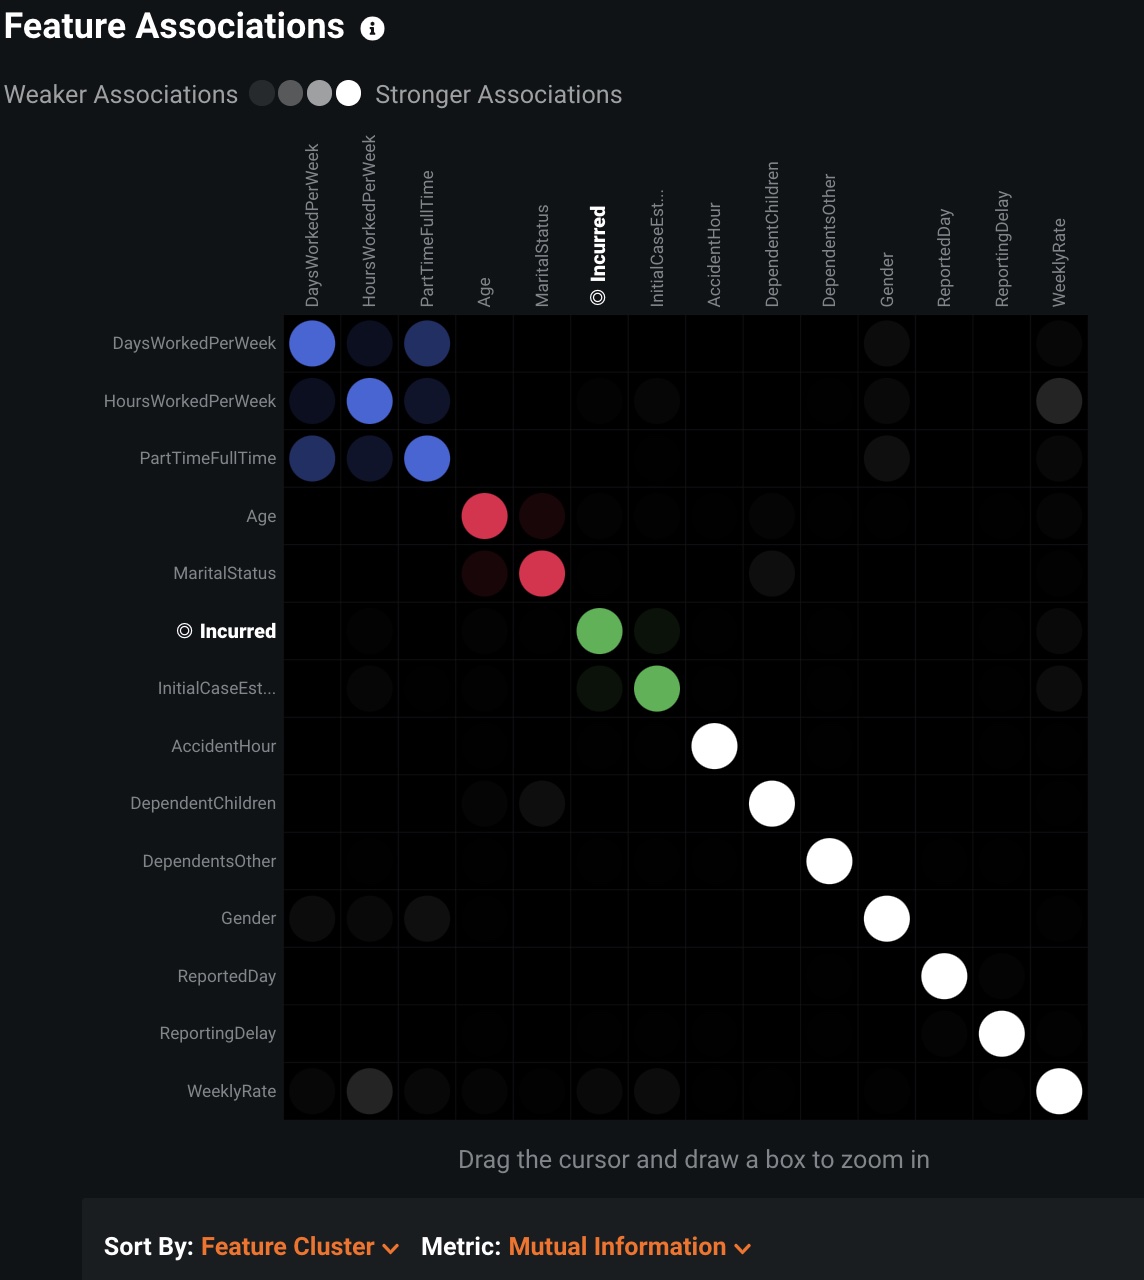
特徴量の関連性タブを使用して、入力特徴量の各ペア間の相関を視覚化します。 たとえば、以下のプロットでは、特徴量DaysWorkedPerWeekとPartTimeFullTime(左上隅)は強い関連性を持っているため、一緒に「クラスター化」されています。 この行列の各カラーブロックがクラスターです。
モデリングとインサイト
モデリングが完了したら、モデル結果の解釈を開始できます。
特徴量のインパクト
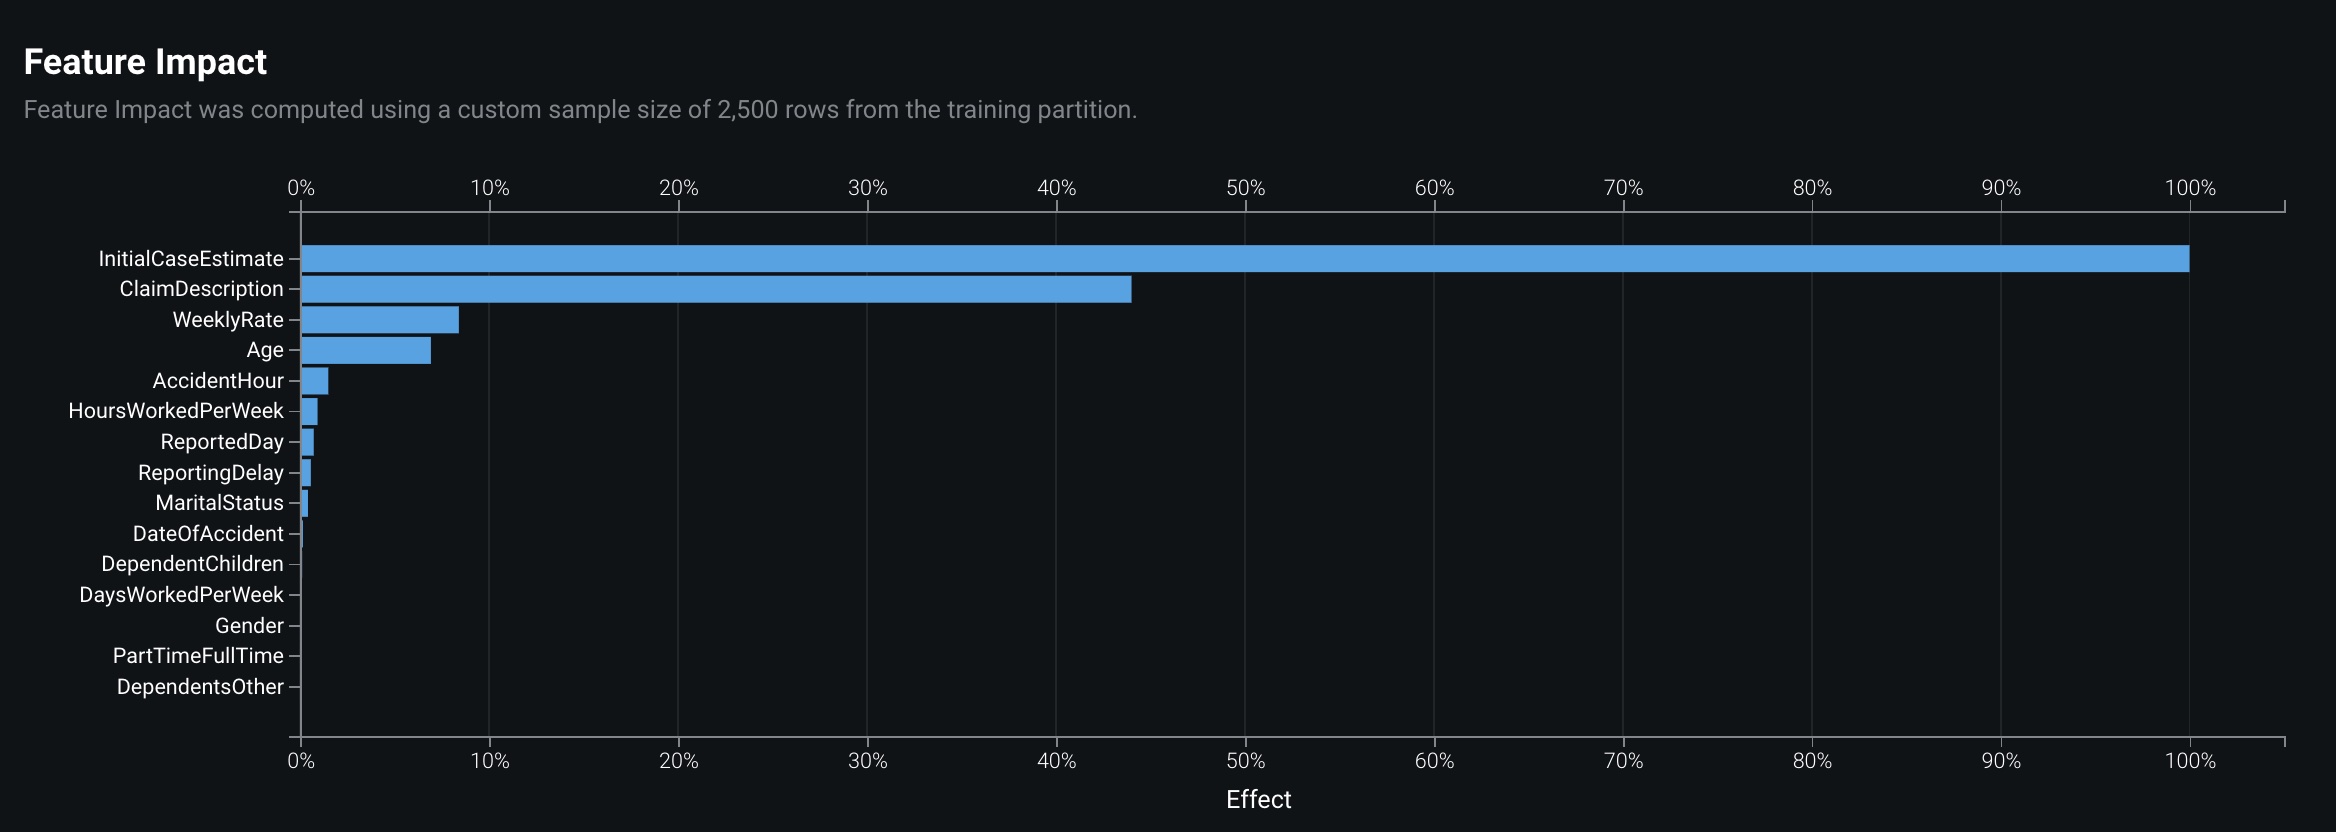
特徴量のインパクトは、各特徴量とモデルターゲットの関連性、つまりモデルのキードライバーを明らかにします。 特徴量のインパクトは、特徴量の有用性に基づいて、有用性が最も高いものから順に特徴量をランク付けし、さらにそれらの特徴量の相対的な有用性も示します。 以下の例では、InitialCaseEstimateがこのモデルで最も有用な特徴量であり、次いでClaimDescription、WeeklyRate、Age、HoursWorkedPerWeekなどとなっていることがわかります。
この例では、MaritalStatusより後の特徴量は、ほとんどモデルに貢献していないことを示しています。 たとえば、genderはモデルへの貢献度が最小限であり、保険金請求の重大度は請求者の性別に左右されないことがわかります。 性別(およびMaritalStatusよりもインパクトが小さい他の特徴量)を含まず、インパクトが非常に大きい特徴量だけを含む特徴量セットを新たに作成すれば、モデルの精度に大きな影響はないはずです。 自然な次のステップは、上位の特徴量のみで新しい特徴量セットを作成し、モデルを再実行することです。 DataRobotは、特徴量のインパクトの累積が95%となる特徴量を含めることで、新しい特徴量セット「DataRobotで削減した特徴量」を自動的に作成します。
部分依存のプロット
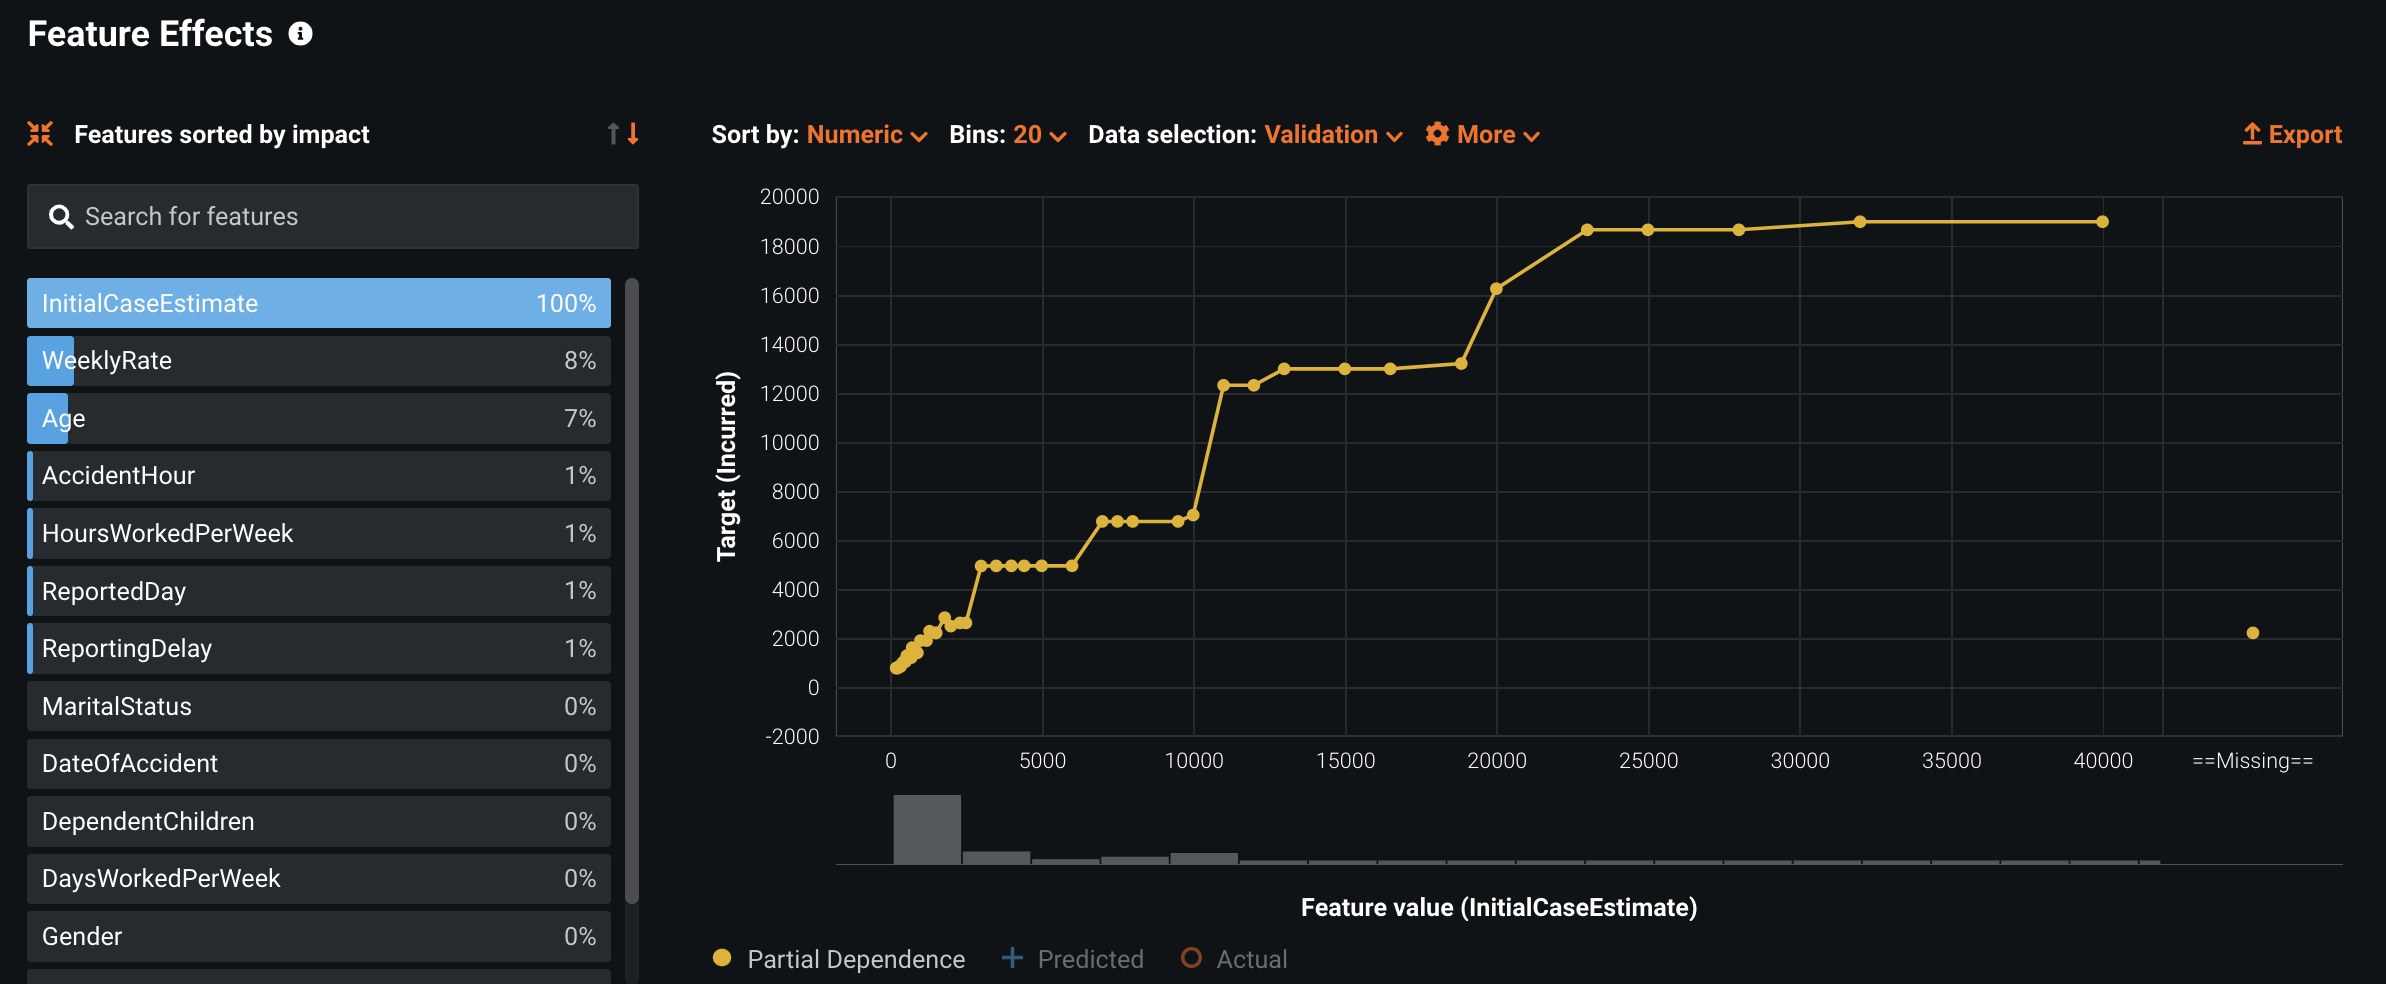
モデルにとって有用な特徴量がわかったら、各特徴量が予測にどのように影響するかを知っておくと便利です。 これは、 特徴量ごとの作用、特にモデルの部分依存プロットで確認できます。 以下の例では、WeeklyRate特徴量の部分依存に注目してください。 週給が低い保険金請求者ほど請求の重大度が低く、週給が高い請求者ほど請求の重大度が高いことがわかります。
予測の説明
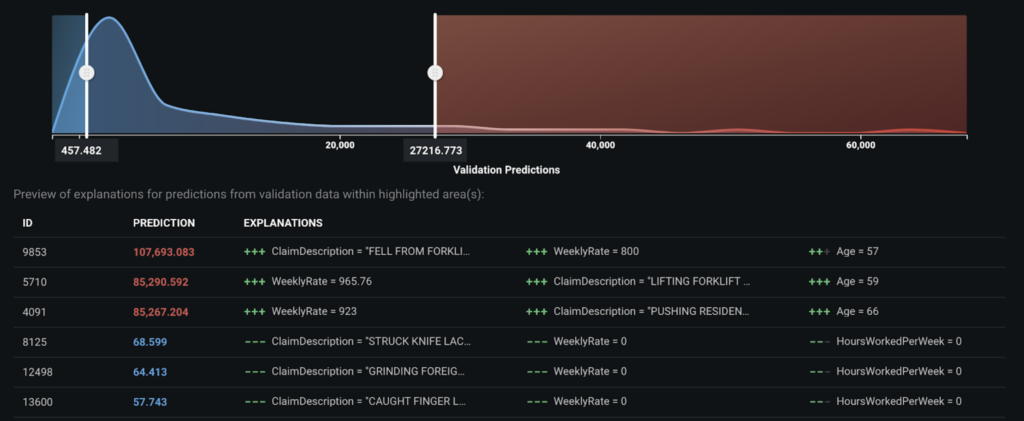
保険金の査定担当者は、保険金請求において低い予測値を見ると、そのような低い予測値の背後にある要因について最初に質問する可能性があります。 予測の説明は個々の予測レベルで提供されるインサイトです。査定担当者が予測の方法を理解し、モデルの信頼性を高めるのに役立ちます。 デフォルトでは、DataRobotから各予測に対して上位3つの説明が提供されますが、最大10個の説明を要求できます。 モデルの予測値と説明はCSV形式でダウンロードできます。予測の上限しきい値と下限しきい値を指定することで、CSVファイルに含める予測値を制御することが可能です。
以下のグラフは、予測値の上位3つと下位3つそれぞれについて、上位3つの説明を示しています。 このグラフから、一般に、高い予測値は請求者の年齢が高く、週給が高いことと関連しており、低い予測値は週給が低いことと関連していることがわかります。
ワードクラウド
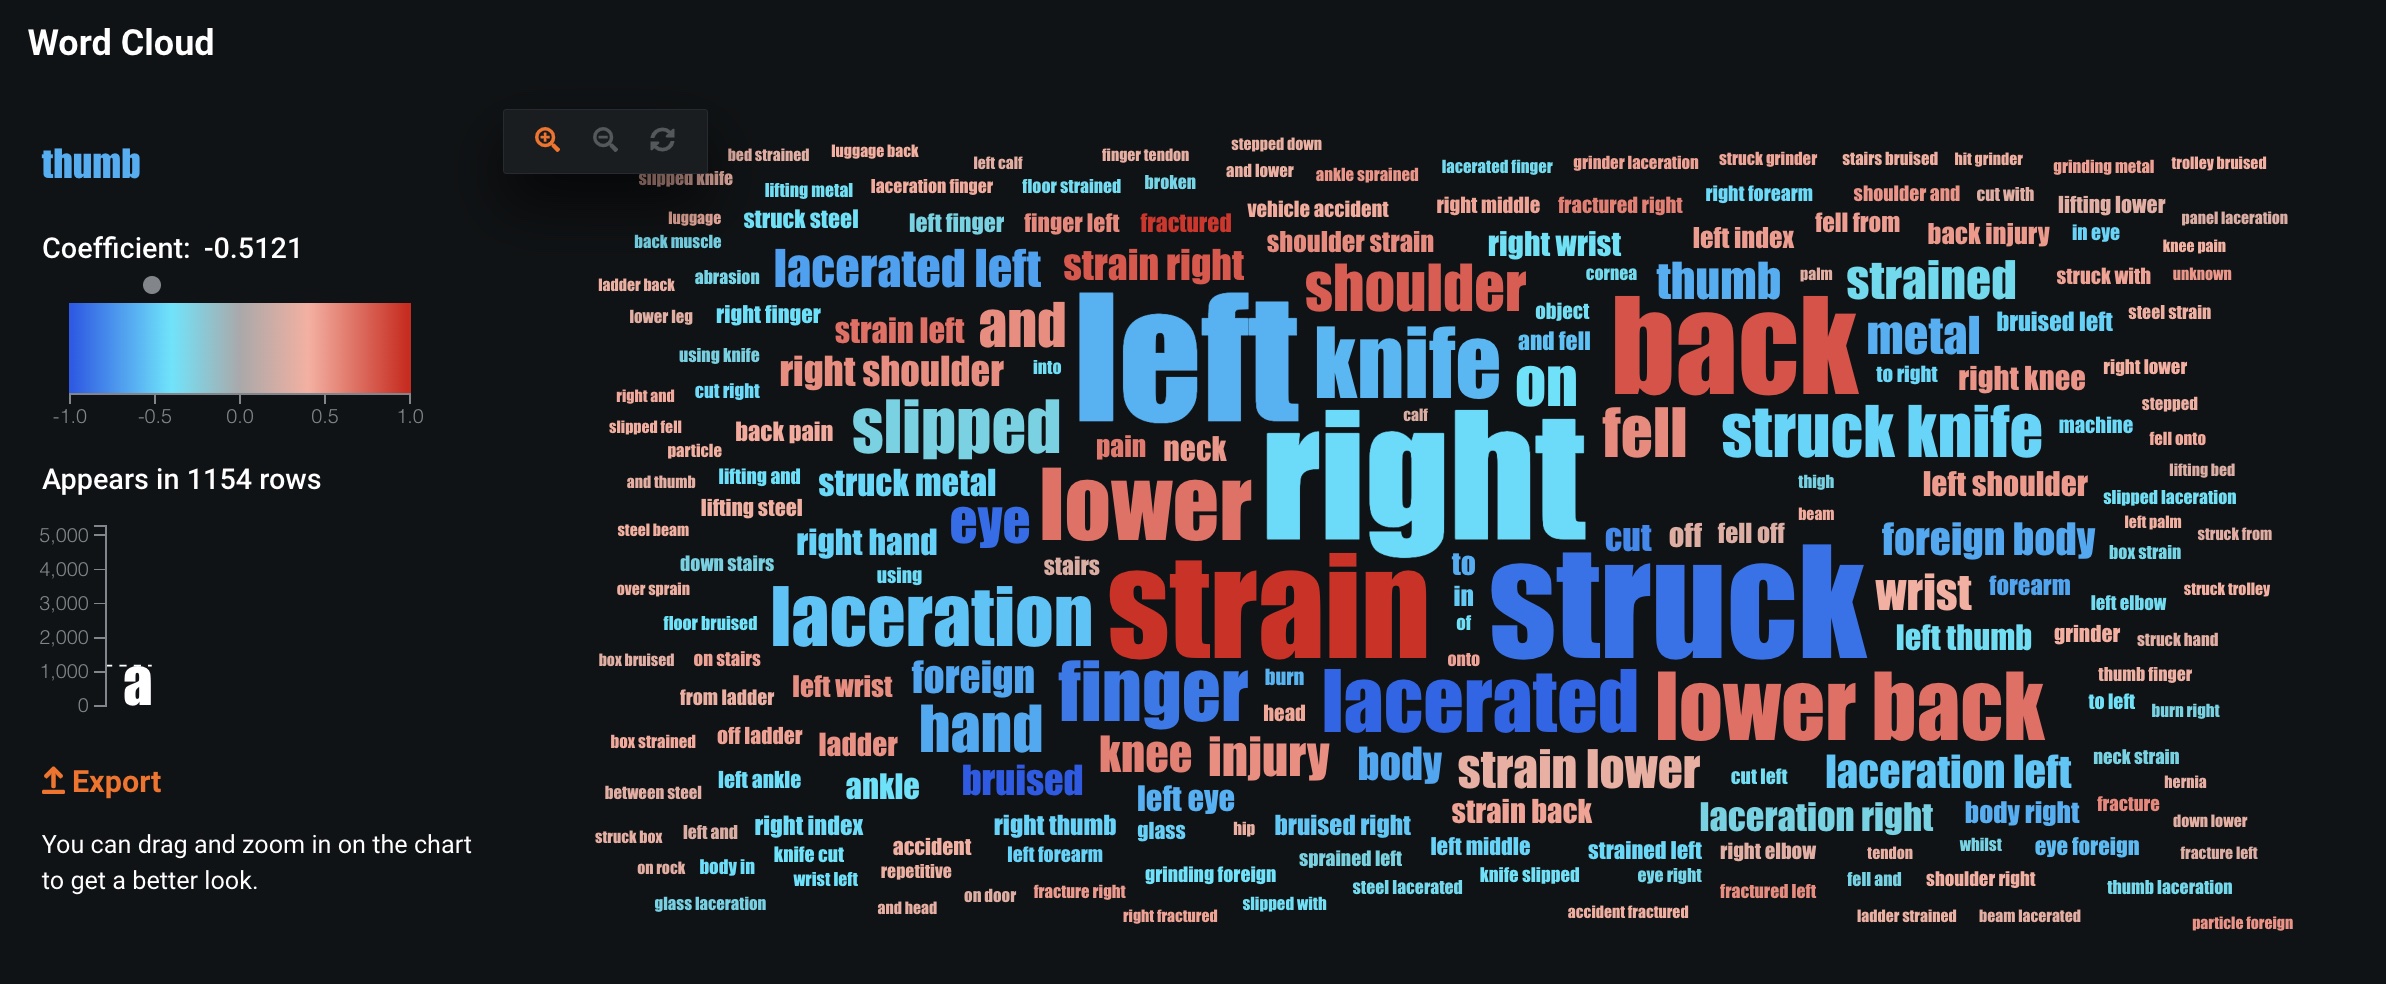
特徴量ClaimDescriptionは非構造化テキストフィールドです。 DataRobotは、テキスト特徴量からテキストマイニングモデルを構築し、そのテキストマイニングモデルからの出力結果は、その後のモデリングプロセスの入力として使用されます。 以下はClaimDescriptionの ワードクラウドで、DataRobotが解析したキーワードを示します。 単語の大きさは、その単語がデータに出現する頻度を示します。strainはデータに非常に頻繁に出現しますが、fracturedはあまり出現しません。 色は重大度を示します。strainとfractured(赤色の単語)は重大度の高い請求に関連し、fingerとeye(青色の単語)は重大度の低い請求に関連します。
精度の評価
次のインサイトは、精度を評価する上で役に立ちます。
リフトチャート
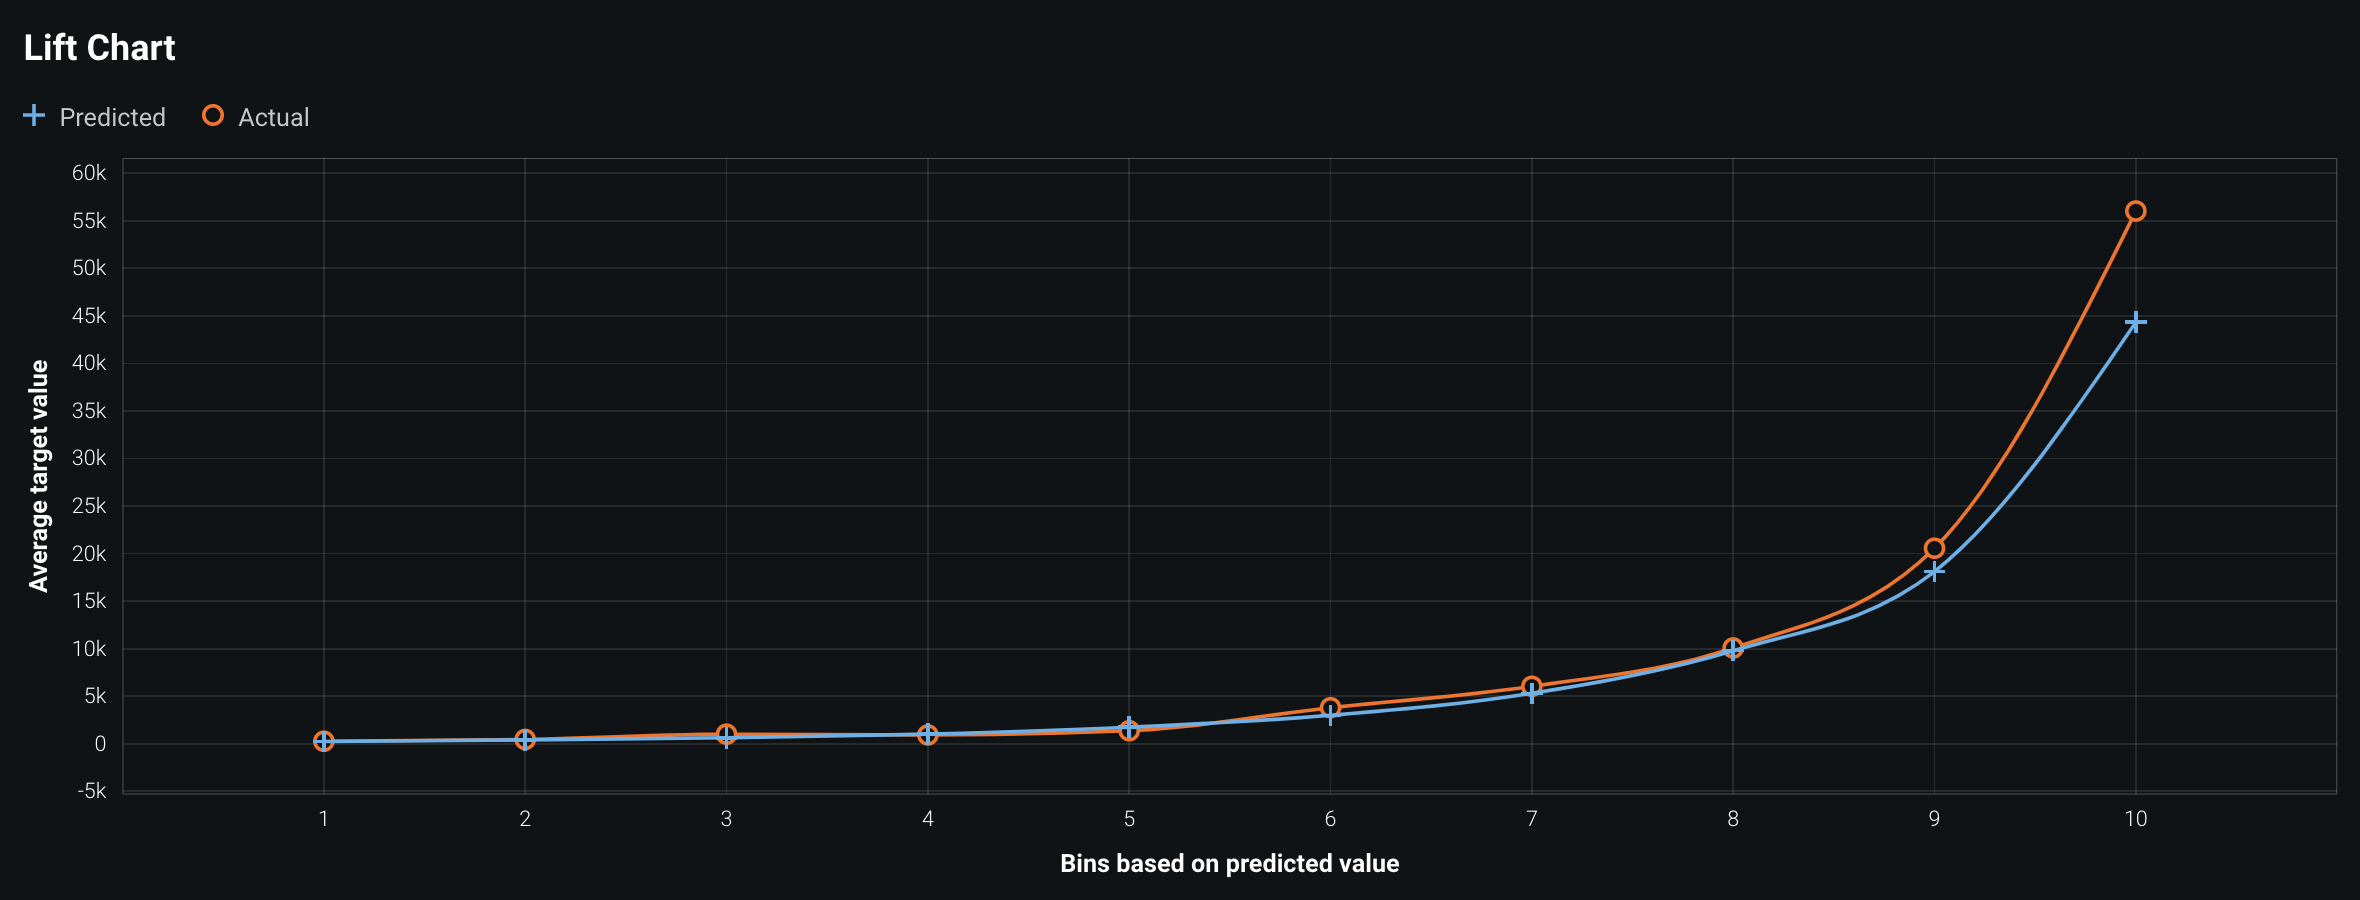
リフトチャートは、最も低いリスク(左側)と最も高いリスク(右側)を区別する上で、そのモデルがどれだけ効果的であるかを示します。 以下の例では、保険金請求にかかる平均コストについて、青色の曲線が予測値、オレンジ色の曲線が実測値を表しています。 上向きの傾きにより、左側の重大度が低い(0に近い)保険金請求と右側の重大度が高い(~45000ドル)請求をモデルが効果的に区別していることがわかります。 実測値(オレンジ色の曲線)が予測値(青色の曲線)に近いということは、モデルがデータによく適合していることを示しています。
ただし、リフトチャートは検定パーティションまたはホールドアウトパーティションでのみ表示されます。
後処理
保険金請求での重大度の予測は、さまざまな用途に使用できますが、それぞれに異なる後処理工程が必要です。 元受保険会社は、保険金請求の優先順位付け、年始責任準備金の算定、あるいは再保険会社への報告にモデルの予測を使用できます。 たとえば、FNOLの時点で保険金請求に優先順位を設定する場合、モデルの予測を使用して、請求のルーティング先を判断できます。 ある労災保険会社では、以下のことを定めるかもしれません。
- 予測される重大度が5千ドル未満の保険金請求はすべて、ストレートスループロセッシング(STP)に移行する。
- 5千ドル〜2万ドルの保険金請求については、標準的なプロセスを経る。
- 2万ドルを超える保険金請求には、看護師資格を持つケースマネージャーを割り当てる。
- 50万ドルを超える保険金請求は、必要に応じて再保険会社にも報告する。
また、別の保険会社では、保険金請求の40%をSTP、55%を通常のプロセス、5%を看護師資格を持つケースマネージャーに割り当て、それに応じてしきい値を決めるかもしれません。 これらのしきい値を業務プロセスに組み込むことで、報告された保険金請求が、あらかじめ設計されたパイプラインを通り、適切にルーティングされるようにすることができます。 STPを導入している保険会社は、予期しない請求行為を確実に把握するために、請求監視手順を慎重に設計する必要があります。
このようなさまざまな仮定をテストするには、単一または複数のA/Bテストを設計し、それらを順番または並行して実施します。 テストを停止する前に必要な観測値数を決定するため、テストの前に検出力分析とP値を設定する必要があります。 テストを設計する際は、収益性を推進する要因を慎重に検討してください。 理想的には、保険金請求にかかるコストだけでなく、その要因がもたらす変動に基づいてリソースを割り当てます。 たとえば、死亡保険金の請求は比較的高額ですが、複雑ではないため、多くの場合、経験の浅い請求処理担当者に割り当てることができます。 最後に、A/Bテストの終了時に、各テストの利益に基づいて最適な組み合わせを特定できます。
予測とデプロイ
モデルのデプロイには、モデルを本番環境にデプロイする準備状況に応じて、DataRobot UIまたはREST APIを使用できます。 ただし、モデルが本場環境に完全に組み込まれる前に、次のようなケースでパイロット版が有効な場合があります。
- 新しい保険金請求データを用いて、モデルのパフォーマンスをテストする。
- 予期しないシナリオを監視して、正式な監視プロセスを設計または変更できるようにする。
- モデルの結果を使用することに対するエンドユーザーの信頼を高めて、ビジネス上の意思決定を支援する。
ステークホルダーがモデルやプロセスに安心感を持てば、本番環境のシステムにモデルを組み込むことで、モデルの価値を最大化することができます。 モデルからの出力内容は、保険金請求管理のニーズに合わせてカスタマイズすることが可能です。
意思決定プロセス
選択したモデルを目的の意思決定環境にデプロイし、予測を通常のビジネス上の意思決定に組み込みます。 保険会社では、保険金請求の管理を別のシステムで行っていることがよくあります。 この特定のユースケースでは、保険金請求管理システムや視覚化ツール(Power BIやTableauなど)にモデルを組み込むことが、ユーザーにとって最善の利益となる可能性があります。
保険会社の保険金請求管理システム内にモデルが組み込まれていれば、新たな請求が報告されたとき、FNOL担当スタッフは利用可能なすべての情報をシステムに記録することができます。 そして、このモデルをバックグラウンドで実行することで、最終的な重大度を評価できます。 推定された重大度は、年始責任準備金と、その後の請求処理の適切なルーティング(つまり、STP、通常の保険金査定、または経験豊富な査定担当者による保険金査定(場合によっては看護師資格を持つケースマネージャーの関与や再保険会社への報告を伴う))を提案するのに役立ちます。
保険会社は、請求の最終的な重大度以外の要因による意思決定を把握するために、ルールベースの意思決定も含めることを希望するでしょう。
ほとんどの保険会社は、STP対象の保険金請求に年始責任準備金を設定していません。 STPで処理できない保険金請求については、モデルの予測を用いることで、FNOLの時点で年始責任準備金を設定できます。 保険金の査定担当者と看護師資格を持つケースマネージャーは、一定のしきい値を超えた請求に対してのみ関与します。 再保険会社への報告プロセスも、モデル予測からメリットを得られます。保険金請求の重大度が非常に高くなってから報告するのではなく、FNOLのタイミングで報告を開始できます。 再保険会社は、重大度が高い保険金請求がタイムリーに報告されることを確実に評価し、これにより、元受保険会社と再保険会社の関係はさらに改善されるでしょう。
意思決定の関係者
意思決定のステークホルダーとして、以下を検討してください。
- 保険金請求管理チーム
- 保険査定者
- リザービングを担当するアクチュアリー
モデル監視
保険金請求の重大度に関するモデルを導入している保険会社では、通常、異常な動作が収拾できなくなる前に確実に把握できるよう、ビジネスルールを厳格に定義しています。 異常な動作(たとえば、予測値が異常に高い、入力の欠落が多すぎるなど)が検出された場合、手作業による確認に切り替えることができます。 DataRobotの パフォーマンス監視機能—(特にサービスの正常性、データドリフト、精度)を使用して、定期的なレポートを作成し、関係者に配布します。
実装に関する考慮事項
保険金請求におけるFNOL時点での重大度に関するモデルは、時系列で重大度を監視するために構築された一連のモデルの1つである必要があります。 FNOLモデルに加えて、保険金請求の各段階(30日、90日、180日など)でモデルを構築し、利用可能な追加情報を活用して、請求の重大度をさらに評価します。 治療や診断、欠勤などの情報は時間の経過とともに追加されます。請求の詳細が明らかになるにつれて、モデルの精度を向上させることができます。
AIアプリ
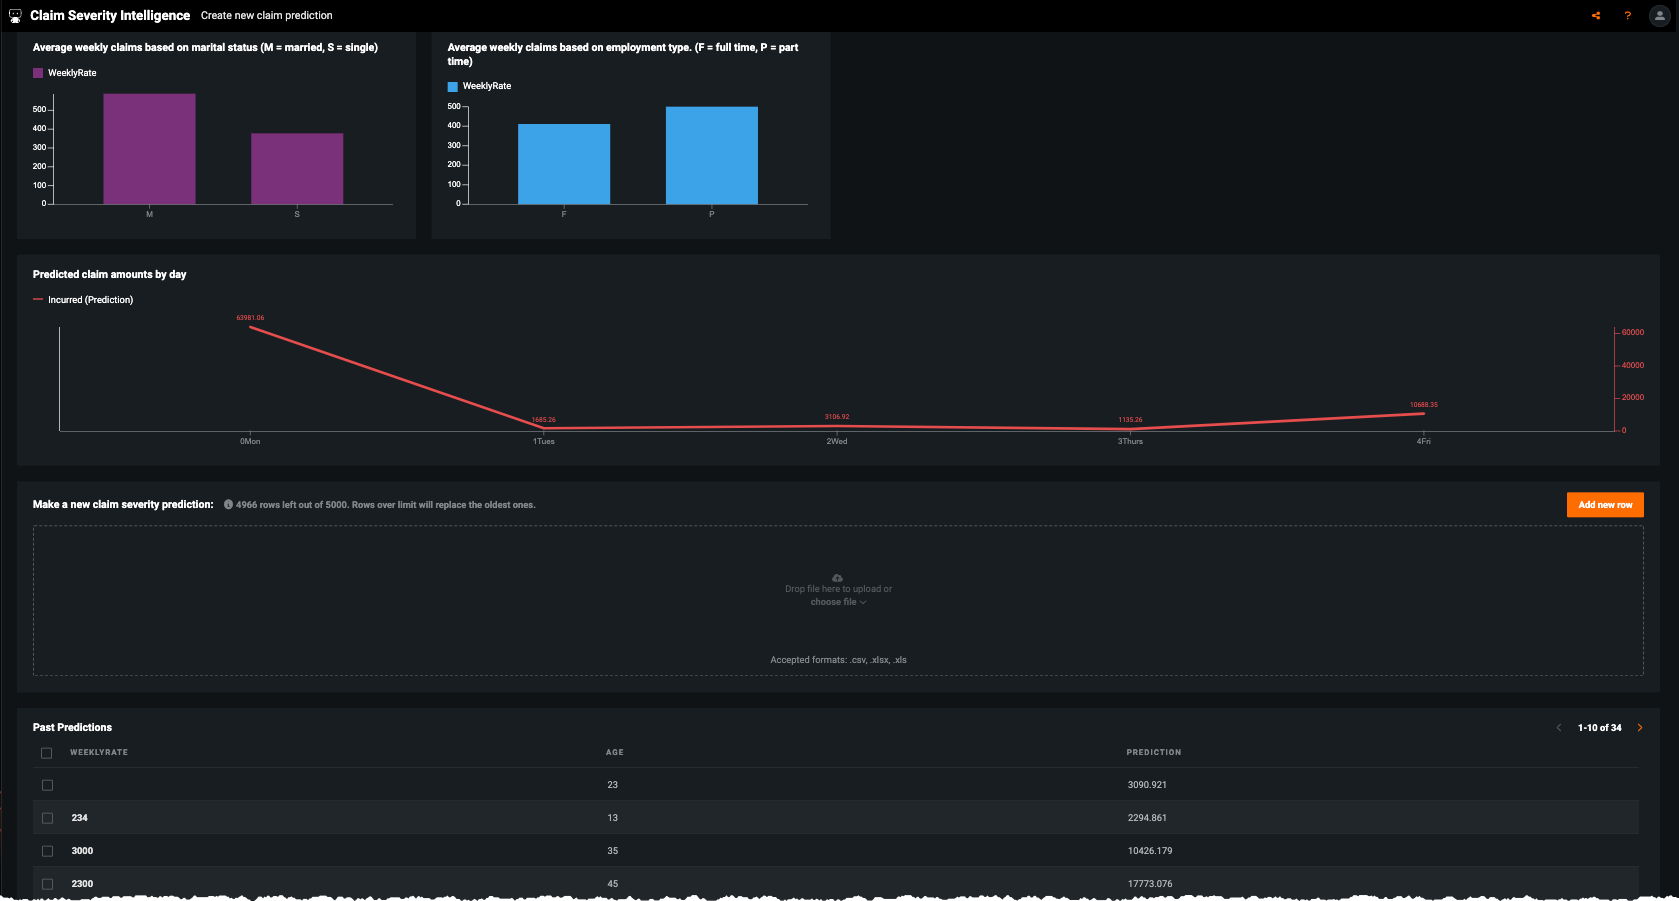
利害関係者が予測を活用して、調査結果を記録できるカスタムアプリケーションの構築を検討してください。 モデルがデプロイされると、予測を 意思決定プロセスで使用できます。 たとえば、この AIアプリは、ノーコードインターフェイスを使用して、簡単に共有できるAI搭載のアプリケーションです。
