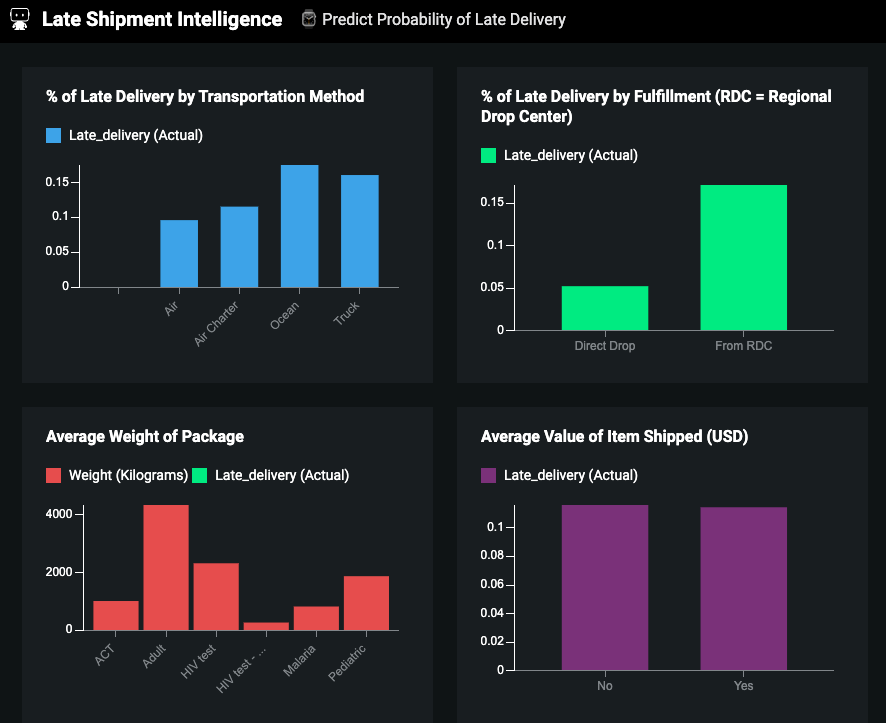
出荷遅延の予測
翌日や当日の配達が可能になったことで、お客様の時間厳守やスピードに対する基準はかつてないほど高まっています。 通常、配達の遅れは消費者個人が迷惑するだけですが、スピードに対する要求は、最終的にサプライチェーンに及び、小売業者や製造業者は常に時間に追われています。 これらの企業にとって、スケジュールを守るということは、何百万ドルもの顧客からの注文や契約上の義務に関わる問題です。 残念ながら、サプライチェーンの変動性を管理する上で避けられない課題がある中、最も有名な物流業者でさえ、2019年第1四半期に合計で50万個以上の荷物を配送した100社のeコマース小売業者による出荷全体で平均6.9%の遅延が発生しました。
このユースケースで使用するサンプルトレーニングデータは"Supply Chain Shipment Pricing Data"です。
ここをクリックすると、データの操作から始まる実践的なセクションに直接ジャンプします。 それ以外の場合は、次のいくつかの項で、このユースケースのビジネス上の正当な理由と問題の枠組みについて説明します。
ビジネス上の問題
サプライチェーンネットワークの重要な要素は、特に土壇場で発生した場合の部品不足を防ぐことです。 部品が不足すると、機械や輸送が十分に活用されないだけでなく、ネットワーク全体での配送が遅れるというドミノ効果が発生します。 さらに、時間どおりに到着する部品の予測数と実際の数の不一致により、サプライチェーンマネージャーは材料計画を最適化できません。
遅延がサプライチェーンに与える影響を軽減するために、製造業者は、過剰在庫の保有、さらに標準化するための製品設計の最適化、単一調達戦略からの脱却などのアプローチを採用しています。 ただし、これらのアプローチのほとんどは、部品、保管、およびロジスティクスに不要なコストをもたらします。
多くの場合、サプライチェーンマネージャーが根本原因を判断し、将来発生しないように短期的および長期的な調整を実施できるようになるまで、出荷の遅延が続きます。 残念ながら、サプライチェーンマネージャーは、時間とリソースが限られているため、MRPシステムで利用可能な履歴データを効率的に分析することができませんでした。
ソリューションの価値
AIは、サプライチェーンマネージャーが出荷遅延の発生を予測することで、調整のための時間を確保できるため、部品不足の解消に役立っています。 AIは、過去の出荷遅延の事例とそれに関連した特徴を学習することで、そのパターンを将来の出荷に適用し、遅延の可能性を予測します。 複雑なMRPシステムとは異なり、AIはサプライチェーンマネージャーに、直感的であっても科学的な方法で、各出荷遅延の背後にある統計的な理由を提供します。 たとえば、AIがサプライチェーンマネージャーに出荷の遅れを通知する際、その理由を説明し、出荷業者、輸送手段、国などを提示します。
この情報をもとに、サプライチェーンマネージャーは、出荷の遅延に対して短期的および長期的な防止策を講じることができます。 短期的には、その特徴を踏まえ、輸送や配送のルートを調整することで、出荷の遅れを防ぐことができます。 長期的には、サプライチェーンマネージャーは、根本原因の集計分析を行うことで、遅延の体系的な原因を発見し解決することができます。 サプライチェーンマネージャーは、この情報を利用して、よりアクセスしやすい地域の業者を選択したり、出荷スケジュールや数量を見直すなど、戦略的な意思決定ができます。
ROIによる見積もり
このソリューションを実装するためのROIは、次の要因を考慮して見積もることができます。
-
製造会社や生産ラインの停止を起点に、生産工程のサイクルタイムから、生産ロスのうちどの程度が部品不足に関連しているかを把握できます。 たとえば、サイクルタイム(1つの部品を完成するのにかかる時間)が60秒で、部品不足が原因で毎日15分生産ラインがストップすると、15分の生産量低減は15個の製品に相当します。 同様の計算を使用して、部品不足による年間損失を見積もることができます。
-
物流業者の場合、部品不足を早期に予測できれば、在庫を減らせるという点でコスト削減を促進することができます。 これは、AIソリューションの導入前と導入後で部品在庫の維持数がどのように変わったかを検出することで大まかに見積もることができます。 単位あたりの保有コストと在庫コストを掛けたときの在庫の差異が、全体的なROIを示します。 さらに、部品の需要が(部品不足のために)満たされないままになっている場合、充足されない需要に関連する機会費用は、それに対応するビジネスチャンスの損失に直結します。
データ
このアクセラレーターでは、米国大統領エイズ救済緊急計画(PEPFAR)によって提供された、 一般に公開されているデータセットを使用して、製造企業や物流企業がAIモデルを活用して意思決定を改善する方法を説明します。 このデータセットには、サプライチェーンの健全な商品の出荷と価格のデータが含まれます。 具体的には、抗レトロウイルス薬(ARV)とHIVラボからの支援対象国への出荷を特定できます。 さらに、このデータセットには、商品の価格設定と、商品を他国に出荷して使用するために必要な関連サプライチェーンの費用が含まれています。
特徴量とサンプルデータ
データセットに含まれる特徴量は、遅延を予測する上で重要な要素の一部を表しています。
ターゲット
ターゲット特徴量:
Late_delivery
この特徴量は、出荷が遅延するかどうかをTrue \\ False、1 \\ 0などの値で表します。このようにターゲットを選択することで、二値分類の問題になります。 ターゲット特徴量の分布は不均衡で、11.4%が1(遅れた配送)で、88.6%が0(予定どおりの配送)です。
サンプル特徴量セット
このユースケースでの特徴量の例を以下に示します。
| 特徴量名 | データ型 | 説明 | データソース | 例 |
|---|---|---|---|---|
| ベンダー | カテゴリー | 配送品を出荷するベンダーの名前。 | 注文書 | ランバクシー社、サンファーマ社など |
| 品目の説明 | テキスト | 出荷される部品/品目の詳細 | 注文書 | 30mg HIV検査キット、600mgラミブジンカプセル |
| 品目数 | 数値 | 注文された製品の数量。 | 注文書 | 1000、300など |
| ライン項目の値 | 数値 | 注文したライン項目の単価。 | 注文書 | 0.39, 1.33 |
| 製造現場 | カテゴリー | 製造を行ったベンダーの拠点(同じベンダーでも複数の異なる拠点から部品を出荷できるため)。 | 請求書 | Sun Pharma, India |
| 製品グループ | カテゴリー | 注文された製品のカテゴリー。 | 注文書 | HRDT, ARV |
| 輸送手段 | カテゴリー | 部品配送のための搬送方法。 | 請求書 | 航空、トラック |
| 配送遅延 | ターゲット(二値分類) | 配送が遅れたか、予定どおりだったか | ERPシステム、発注書 | 0または1 |
上記の特徴量に加えて、組織内で収集している、遅延に関連しそうな追加データを組み込みます。 (DataRobotは、選択によってモデリングが改善されない場合でも、有用な特徴量と有用でない特徴量を区別できます。) これらの特徴量は、通常、組織のERPシステムで利用可能な独自のデータソースに保存されています。
データプレパレーション
データセットには、調達取引に関する履歴情報が含まれています。 データセット内の分析の各行は、個々の注文であり、その配達を予測する必要があります。 すべての注文には配達予定日と実際の配達日があり、これらの差異を使用してターゲット特徴量(Late_delivery)を定義します。 配達日が予定日を過ぎた場合、ターゲット特徴量の値は1になり、それ以外の場合は0なります。 全体として、データセットにはターゲット特徴量を含めて、約10,320行と26の特徴量が含まれています。
モデリングとインサイト
DataRobotでは、 ここで説明するように、データセットの処理や分割など、モデリングパイプラインの多くの部分が自動化されます。
このユースケースでは、モデリングのセクションをスキップして、モデルの解釈に直接進みます。データセットが不均衡であるため、DataRobotでは、最も精度が高いモデルを特定するために、最適化指標として LogLossの使用を自動的に推奨していることに注目してください。LogLossは、誤った予測にペナルティを与える誤差指標です。
このデータセットの場合は、オープンソースのXGboostライブラリーを使用する教師無し学習による特徴量を用いたExtreme Gradient Boosting Tree Classifierが、最も精度の高いモデルとして検出されました。
以下のセクションでは、モデル構築後に利用できるインサイトについて説明します。
特徴量のインパクト
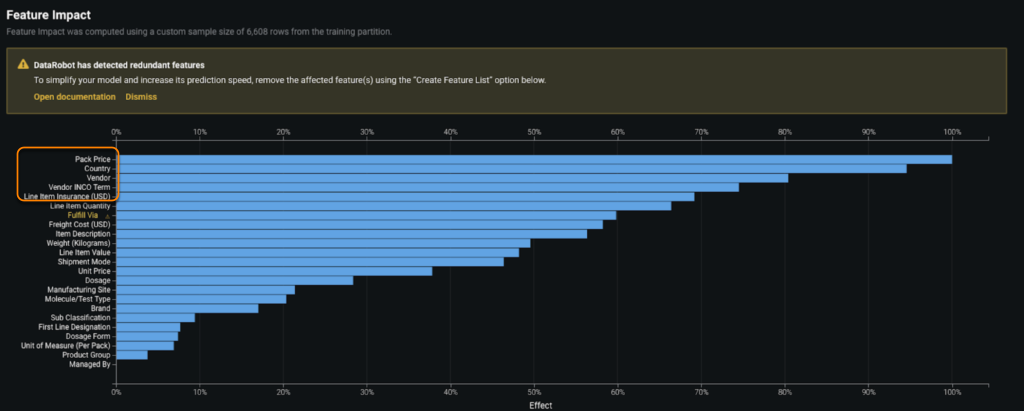
モデルの仕組みを明確化するために、DataRobotはグローバルレベルとローカルレベルの両方のモデルを説明します。 特徴量のインパクトは、どの特徴量がモデルの決定を左右しているか(選択されたターゲット特徴量に関連した、データセット内での各特徴量の相対的有用性)を大まかに示します。
ご覧のとおり、Pack Price、Country、Vendor、Vendor INCO TermおよびLine item Insuranceのモデルが部品出荷の遅延に影響を与える最も重要な要因の一部として特定されました。
予測の説明
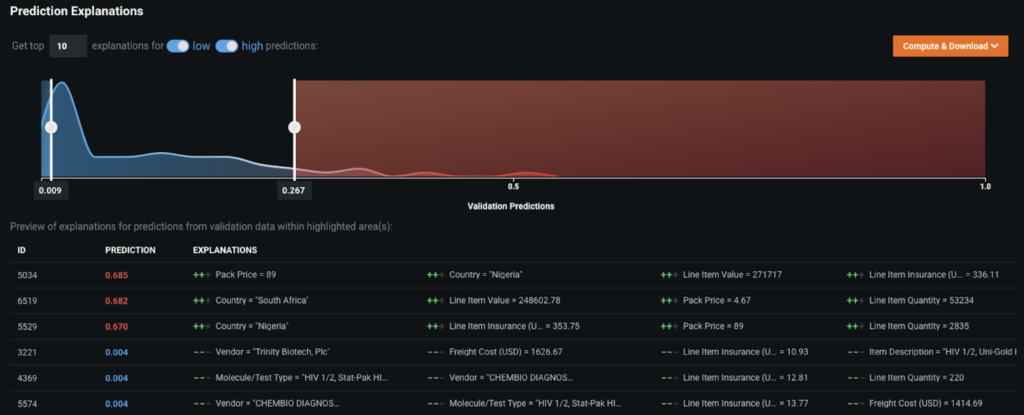
また、DataRobotは、生成された各予測の10個のキードライバーを理解するのに役立つ 予測の説明を提供しています。 これにより、不足する部品ごとの固有の事情に合わせて措置をきめ細かく調整できるようになります。
たとえば、特定の国が主な出荷遅延の原因である場合、これらの国のベンダーと連絡を取り、出荷ルート全体を綿密に監視する措置を取れます。
同様に、遅延の上位の理由として特定のベンダーが検出されている場合、それらのベンダーに前もって働き掛け、サプライチェーンネットワークに影響を及ぼすような出荷の遅れを回避するための是正措置を実施できます。 これらのインサイトは、新しいルールや代替の購買先を組み込んでサプライチェーンプロセスを改善するという、意思決定をデータに基づいて行えるようになります。
ワードクラウド
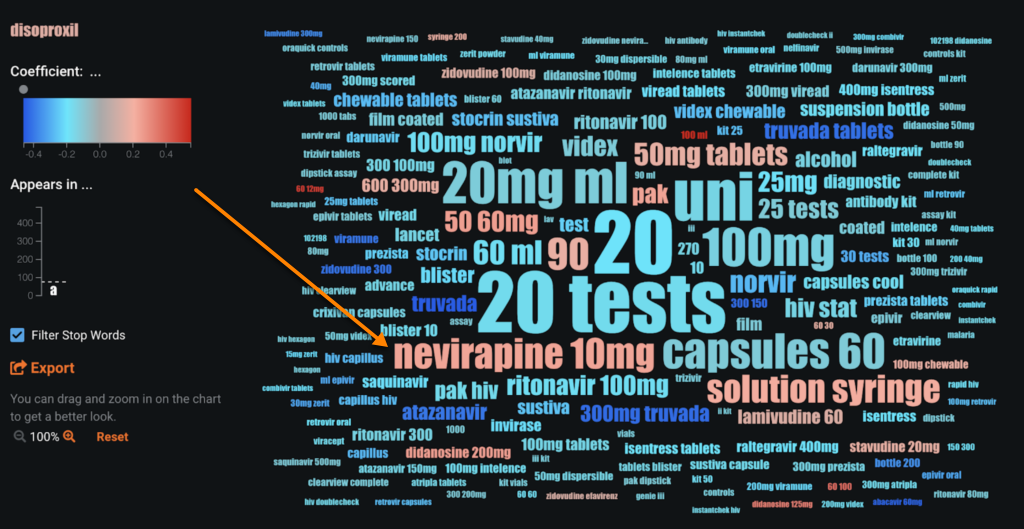
テキスト変数(付属のデータセットでのPart descriptionなど)については、ワードクラウドを使用して、出荷の遅延と強く関連する単語やフレーズを検出します。 テキスト特徴量のモデリングは一般に最も難しく、時間がかかります。DataRobotでは、それぞれのテキスト列が個々の分類器として自動的に機能し、NLP手法(tf-idf、nグラムなど)で直接前処理されます。この場合、nevirapine 10 mgという表される品目がそれ以外の品目に比べて遅延する可能性が高いことがわかります。
精度の評価
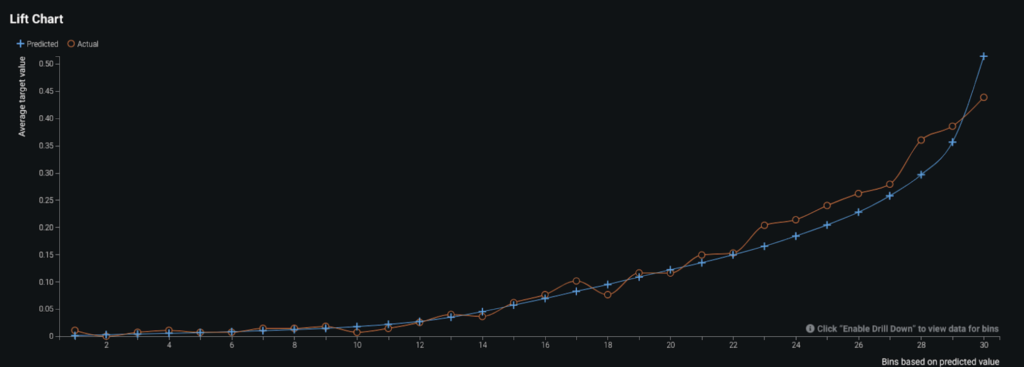
DataRobotはモデルのパフォーマンスを評価するにあたって、デフォルトで5分割交差検定を実行しました。出力されたAUCスコア(ROC曲線)はおよそ0.82でした。ホールドアウトセット(目に見えないデータ)に対するAUCスコアもおよそ0.82のため、モデルの一般化は良好で過剰適合していないことが確認できます。 モデルの評価でAUCスコアを調べる理由は、AUCは実測値を調べるのではなく出力(つまり、出荷遅延の確率)のランク付けを行うからです。 以下のリフトチャートでは、データを予測値で並べ替えた場合の予測値(青い線)と実測値(赤い線)が比較されています。 遅延する可能性が高い注文でやや予測値のほうが低くなっています。 ただし、全体としては、モデルのパフォーマンスは良好です。 さらに、最終的な問題の枠組みに応じて、選択したモデルの 混同行列を確認し、必要であれば、予測しきい値を調整して、プレシジョンとリコールを最適化することも可能です。
予測とデプロイ
モデルを選択したら、目的の意思決定環境にデプロイできます。 意思決定環境とは、モデルで生成された予測結果を組織内の適切な関係者が使用する方法、およびそれらの関係者がその予測値に基づいて全体のプロセスに影響する意思決定を行う方法を指します。
このユースケースによる予測は、サプライチェーンマネージャーがロジスティクスに近い将来遅延が生じるかどうかを予想して行う意思決定を強化します。 マネージャーの意思決定と組み合わせると、サプライチェーンネットワーク全体の改善に役立つインテリジェントなマシンとして機能します。
意思決定の関係者
次の表は、意思決定に関わる可能性があるステークホルダーの一覧です。
| 利害関係者 | 説明 |
|---|---|
| 意思決定の実行者 | サプライチェーンネットワークにボトルネックがないことを確認するために必要な情報を得られるサプライチェーンマネージャーおよび調達チーム。 これらの担当者は、ベンダーと強力な関係を持ち、モデルの予測を使用して是正措置を実施できます。 |
| 意思決定の管理者 | 主要なベンダーとの大規模なパートナーシップを管理するエグゼクティブステークホルダー。 これらの利害関係者は、全体的な結果に基づいて、ベンダーとの関係の健全性を四半期ごとに確認し、長期的な投資とビジネスパートナーシップに関する戦略的決定を下すことができます。 |
| 意思決定の作成者 | この意思決定環境を構築するビジネスアナリストやデータサイエンティスト。 これらのアナリストは、普段サプライチェーンマネージャーとそのチームと連携して働いている、社内のサプライチェーンチーム、エンジニアリングチーム、ベンダー開発チームに所属するエンジニアやアナリストが該当します。 |
モデルデプロイ
DataRobot予測APIを使用して、モデルをデプロイできます。 REST APIエンドポイントでは、新規注文から新しいスコアリングデータを受け取ると、ほぼリアルタイムで予測を返すことができます。
AIアプリ
モデルが(組織が決定した方法で)デプロイされると、いくつかの方法で予測を使用できます。 たとえば、サプライチェーンのレポートツールとして機能するフロントエンドアプリケーションを使用して、新しいスコアリングデータをモデルへの入力として提供できます。これにより、予測値と予測の説明がリアルタイムで返され、 意思決定プロセスに利用されます。 たとえば、この AIアプリは、ノーコードインターフェイスを使用して、簡単に共有できるAI搭載のアプリケーションです。
意思決定プロセス
マネージャーや経営陣の関係者が、潜在的なボトルネックを特定するための予測結果とPrediction Explanationsに基づいて下す意思決定は、サプライチェーンネットワーク内の該当するベンダーチームにまで影響し、データに基づくインサイトに応じたコラボレーションを促進するでしょう。 意思決定は、部品不足がビジネスに与える影響の重大度に応じて、長期的なものにも短期的なものにもなり得ます。
監視および管理
製品ライフサイクル管理と同様に、モデルの健全性の追跡は、適切なモデルライフサイクル管理に非常に重要です。 MLOpsを使用すると、一元化されたプラットフォームを通じて組織全体のすべてのモデルをデプロイ、監視、および管理できます。
実装に関する考慮事項
このソリューションを実業務に導入する際の大きなリスクの1つは、現場レベルでの導入方法です。 ベンダーとの間に強力で透明性の高い関係があることも、是正措置を講じる上で決定的に重要です。 ベンダー側にモデルの予測結果を信頼してデータに基づく戦略を採用する準備ができていない場合に、リスクが生じます。
