パーチェシングカードの不正検知
このユースケースでは、パーチェシングカード取引の100%を確認し、手作業による検査でさらに調査すべき高リスクの取引を特定できるモデルを構築します。 このソリューションは、取引の確認という人手に頼るタスクの多くを自動化するだけでなく、組織レベルで予測を集計するなど、高度なインサイトを提供して、監査や追加介入の対象となる問題のある部門や機関を特定することができます。
このユースケースで使用するサンプルトレーニングデータ:
ここをクリックすると、データの操作から始まる実践的なセクションに直接ジャンプします。 それ以外の場合は、次のいくつかの項で、このユースケースのビジネス上の正当な理由と問題の枠組みについて説明します。
背景情報
多くの監査役室や同様の役割を持つ部門は、ビジネスルールと人手による処理に頼って、毎週数千件のパーチェシングカード取引を管理しています。 たとえば、あるオフィスでは、Excelのスプレッドシートを使って手作業で取引を確認しているため、確認に時間がかかり、不正を見逃すという事態が発生しています。 このプロセスを大幅に簡略化し、かつ不正を確実に発見する方法が求められています。 また、各取引のリスクスコアをフロントエンドの意思決定アプリケーションにシームレスに組み込む方法も必要です。このアプリケーションは、さまざまなユーザーの確認処理を完了させる主要な方法として機能させます。
主なユースケースのポイント:
戦略/課題:パーチェシングカードを購買に利用している組織では、不正や悪用を監視することが難しく、全購入品の3%以上を占めることもあります。 調査担当者はほぼ手作業で業務を行っているため、明らかな不正の事例をほぼ安全な取引の中から探したり、ルールベースのアプローチを適用することでリスクの高い行為を見落としたりしています。
モデルのソリューション:機械学習モデルは、取引の100%を確認し、さらに調査すべき高リスクの取引を特定することができます。 リスクの高い取引を組織単位で集計することで、問題のある部門や機関を特定し、監査や追加介入の対象とすることが可能です。
ユースケースの適用性
次の表は、このユースケースの特徴をまとめたものです。
| トピック | 説明 |
|---|---|
| ユースケースの種類 | 公共部門/銀行・金融/パーチェシングカードの不正検知 |
| 対象者 | 監査役室や不正調査部門のリーダー、不正調査の担当者、データサイエンティスト |
| 望ましい結果 |
|
| 指標/KPI |
|
| サンプルデータセット | synth_training_fe.csv.zip |
提案されたソリューションには、以下の高度な技術コンポーネントが必要です。
-
ETL(抽出、変換、ロード):パーチェシングカードデータのクリーニング(TSYSなどの銀行または処理会社との間で確立されたフィード)および追加の特徴量エンジニアリング。
-
データサイエンス:AutoMLを使用した不正リスクのモデリング、特徴量の選択/重み調整、予測しきい値のチューニング、モデルのデプロイ、MLOpsによる監視。
-
フロントエンドアプリの開発:フロントエンドアプリケーション(Streamlitなど)にデータの取込みと予測を埋め込みます。
ソリューションの価値
以下に、このユースケースで対処する主な問題と、それに対応する機会を挙げます。
| 問題 | 機会 |
|---|---|
| 政府の説明責任/信頼 | 政府支出における国民の信頼を高めるために、調達取引を100%確認します。 |
| 未検出の不正行為 | リスクのある取引の特定件数が40%以上アップします(組織の規模により100万ドル以上の価値)。 |
| 従業員の生産性 | 高リスクの取引だけを手作業で確認するため、人的効率が向上します。 |
| 組織の見える化 | 組織内のリスク領域について高度なインサイトが得られます。 |
ROIの計算例
このユースケースでのROIの計算は、大きく2つの要素に分けることができます。
- 取引を事前に検査することで、時間を短縮する
- リスクのある取引をさらに検出する
備考
ROIまたは評価演習と同様に、計算は「概算の」数値または範囲であり、財務会計目的での正確な数値というより、影響の規模を理解する上で役立ちます。 ユースケースに適用する場合、計算方法や仮定の不確定性を考慮することが重要です。
取引の事前検査による時間短縮
True Negativesを 自動的に 検出する(「安全」として正しく識別する)モデルによって、調査担当者が手作業で取引を確認するのと比較して、どれだけ時間を短縮できるかを考えてみてください。
入力特徴量
| 特徴量 | 値 |
|---|---|
| モデルのTrue Negative + False Negativeの比率 これは、自動的に確認される取引の数です(False PositivesとTrue Positivesには依然として手作業での確認が必要であるため、時間短縮の要素はありません)。 |
95% |
| 1年あたりの取引数 | 100万 |
| 手作業で確認される取引の割合(%) | 25%(残りの75%は確認しないと仮定) |
| 手作業での確認に費やした平均時間(1取引当たり) | 2分 |
| 時給(完全に投入されているFTE) | $30 |
計算方法
| 特徴量 | 式 | 値 |
|---|---|---|
| 今日、調査担当者が手作業で確認した取引 | 100万 * 25% | 250,000 |
| 事前にモデルで確認 不要 と判断された取引 | 100万 * 95% | 950,000 |
| モデルで手作業による確認が必要と判断された取引 | 100万 - 950,000 | 1,000,000 |
| 手作業による確認が不要になった正味取引 | 1,000,000 | 200,000 |
| 手作業による取引確認時間/年 | 200,000 * (2分/60分) | 6,667時間 |
| 1年当たりのコスト削減 | 6,667 * $30 | $200,000 |
毎年検出される追加不正の計算
入力特徴量
| 特徴量 | 値 |
|---|---|
| 1年あたりの取引数 | 100万 |
| 手作業で確認される取引の割合(%) | 25%(残りの75%は確認しないと仮定) |
| 平均取引額 | $300 |
| モデルのTrue Positiveの比率 | 2%(必ずしも不正ではないが「リスクが高い」とモデルが検出すると仮定) |
| モデルのFalse Negativeの比率 | 0.5% |
| 実際に不正であるリスクが高い取引の割合(%) | 20% |
計算方法
| 特徴量 | 式 | 値 |
|---|---|---|
| これまでは未確認で、モデルによって確認されるようになった取引の数 | 100万 * (100%-25%) | 750,000 |
| リスクが高いと正確に特定される取引数 | 750k * 2% | 15,000 |
| リスクが高い不正取引の割合(%) | 15,000 * 20% | 3,000 |
| 新しく特定された不正金額(ドル) | 3,000 * $300 | $900,000 |
| (不正のリスクに関して)False Negativeである取引数 | 0.5% * 100万 | 5,000 |
| 手作業で確認されたであろうFalse Negativeの数 | 5,000 * 25% | 1,250 |
| 実際に不正であるFalse Negative取引数 | 1,250 * 20% | 250 |
| 見逃した不正金額(ドル) | 250 * $300 | $75,000 |
| 正味金額(ドル) | $900,000 - $75,000 | $825,000 |
年間総節減額の見積もり:102万5,000ドル
ヒント
仮定に基づいて不確定性の程度を伝達するために、モデルの範囲内の値を伝えます。 上記の例では、80万ドル~110万ドルの推定範囲を伝達できます。
注意事項
このモデルを実装するために、その他の価値ある分野または潜在的なコストが存在する場合があります。
-
調査担当者による手作業での確認では見逃されていた不正事例が、このモデルで見つかる可能性があります。
-
これまで確認されることのなかったFalse PositiveやTrue Positiveの確認には、追加コストがかかる場合があります。 とはいえ、この金額は通常、確認不要になった取引数による時間短縮に比べればはるかに小さいです。
-
調査担当者が発見したであろう不正をモデルが見逃すという、False Negativeによる金額的損失を減らすため、一般的な戦略としては、予測しきい値を最適化してFalse Negativeを減らし、このような状況を発生しにくくします。 予測しきい値は、False Negative対False Positiveの推定コストに密接に従う必要があります(この場合、前者の方が、はるかにコストがかかります)。
データ
リンクされた合成データセットは、パーチェシングカードの不正検知プログラムを示します。 具体的には、このモデルは不正取引(承認されていない/ビジネスに関連しない購入をするパーチェシングカード所有者)を検出します。
このデータセットの分析単位は、1取引ごとに1行です。 データセットには取引レベルの詳細が含まれていなければならず、入手できる場合は明細も必要です。
- 子項目が存在しない場合は、1取引ごとに1行です。
- 子項目が存在する場合、親取引に1行と、関連する親取引の特徴量がある下層の各購入項目に1行あります。
データプレパレーション
データを使用する場合は、次の点に注意してください。
分析範囲の定義:初期モデルトレーニングでは、必要なデータ量は、取引が発生する率や購入および不正の傾向における季節的な変動など、いくつかの要因に依存します。 この例では、ラベル付けされた6か月の取引データ(または約30万の取引)を使用して初期モデルを構築します。
ターゲットの定義:以下に示すように、ターゲットを設定するオプションがいくつかあります。
risky/not risky(監査部門の調査担当者がラベル付けしたもの)。fraud/not fraud(実例の結果により記録されるもの)fraudやwaste、abuseとしてマークされた取引をターゲットとして 多クラス/多ラベルにすることもできます。
その他のデータソース:場合によっては、他のデータソースを結合して、追加特徴量を作成することができます。 この例では、従業員リソース管理システムからのデータおよびタイムカードデータを取得します。 各データソースには、取引レベルの詳細(従業員ID、カード所有者IDなど)にまで戻って結合する方法が必要です。
特徴量とサンプルデータ
以下の特徴量セットのほとんどは、業界標準のTSYS(DEF)ファイル形式から派生した取引または項目レベルのフィールドです。 これらのフィールドには、銀行のレポートソースからアクセスすることもできます。
このユースケースを組織に適用するには、データセットに少なくとも次の特徴量を含める必要があります。
ターゲット:
risky/not risky(または上記のオプション)
必要な特徴量:
- トランザクションID
- アカウントID
- 取引日
- 投稿日
- エンティティ名(組織、部門、または機関名)
- マーチャント名
- 加盟店カテゴリーコード(MCC)
- 与信限度額
- 単一取引制限
- アカウント開設日
- 取引金額
- 行項目の詳細
- アクワイアラーリファレンス番号
- 承認コード
推奨するエンジニアリング済み特徴量:
- Is_split_transaction
- アカウントと加盟店のペア
- エンティティとMCCのペア
- Is_gift_card
- Is_holiday
- Is_high_risk_MCC
- Num_days_to_post
- 取引に占める項目値の割合
- 疑わしい取引金額(5ドルの倍数)
- 2ドル未満
- 2,500ドルの制限近く
- 疑わしい取引金額(整数)
- 疑わしい取引額(595で終了)
- 単一取引制限に占める項目値の割合
- アカウント制限に占める項目値の割合
- アカウント制限に占める取引値の割合
- 過去180日間の平均取引額
- 平均取引額に占める項目値の割合
以下に役立つその他の機能を示します。
- 加盟店の市町村
- 加盟店の郵便番号
- カード所有者の市町村
- カード所有者の郵便番号
- 社員ID
- 売上税
- 取引のタイムスタンプ
- 従業員のPTO(有給休暇)またはタイムカードデータ
- 従業員の在職期間(現在の役割)
- 従業員の在職期間(合計)
- ホテルの宿泊明細書データ
- その他の一般的な特徴量
- 不審な取引のタイミング(有給休暇中の従業員)
探索的データ解析(EDA)
-
スマートダウンサンプリング:ラベル付けされた不正サンプルがほとんどない大規模なデータセットの場合、 スマートダウンサンプリングを使用して、マジョリティークラスのサイズを小さくすることで、データセット全体のサイズを小さくします。 (データページから、高度なオプションを表示 > スマートダウンサンプリングを選択し、ダウンサンプルデータをオンにします。)
-
時間認識:より長い時間範囲の場合、 時間認識モデリングが必要になるか、有益である可能性があります。
データセット内の時間依存性の確認
取引のタイムスタンプから年+月の特徴量を作成し、モデリングを実行してこれを予測できます。 上位モデルのパフォーマンスが優れている場合、時間認識モデリングを活用する価値があります。
-
データ型:データには、取引特徴量が数値としてエンコードされている場合がありますが、 カテゴリーに変換する必要があります。 たとえば、加盟店カテゴリーコード(MCC)は、クレジットカード会社がビジネスを分類する際に使用する4桁の番号ですが、コードの順番に何らかの関係があるとは限りません(たとえば、1024は1025に似ていません)。
二値特徴量には、カテゴリー型特徴量が必要です。数値の場合は、
0または1の値が必要です。 サンプルデータでは、is_holiday、is_gift_card、is_whole_numなどの特徴量エンジニアリングからいくつかの二値チェックが生成されることがあります。
モデリングとインサイト
データのクリーニング、特徴量エンジニアリングの実行、データセットのDataRobotへのアップロード(AIカタログまたは直接アップロード)、および上記のEDAチェックの実行後、モデリングを開始できます。 迅速な結果/インサイトのために、 クイックオートパイロットモードでは、探索されたモデリングアプローチと結果に至るまでの時間の最適な比率が表示されます。 または、完全なオートパイロットモードまたは包括的モードを使用して、特定のデータセットとプロジェクトタイプに合わせた完全なモデル探索を実行します。 ドロップダウンから適切なモデリングモードを選択したら、モデリングを開始します。
以下のセクションでは、モデル構築後に利用できるインサイトについて説明します。
モデルのブループリント
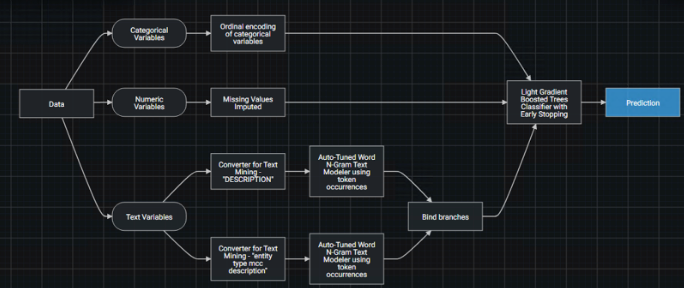
リーダーボードに表示され、精度でランク付けされた「適者生存」スキームによってソートされたモデル ブループリントは、モデルパイプライン処理への全体的なアプローチを示します。 以下の例では、元のデータのスマートな処理(テキストエンコーディング、欠損値補完など)と、決定木プロセスに基づく堅牢なアルゴリズムを使用して、取引のリスクを予測します。 結果として得られる予測は、不正の確率(0~100)です。
特徴量のインパクト
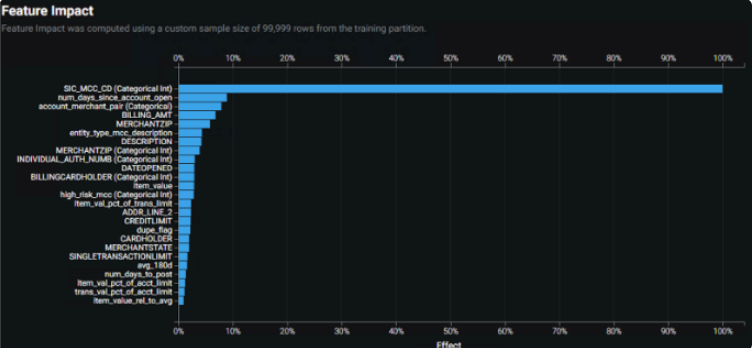
特徴量のインパクトは、どの特徴量がモデルの決定を左右しているかを大まかに示します。
上の特徴量のインパクトチャートは、以下のことを示しています。
-
加盟店情報(MCCとそのテキスト説明など)は、モデル予測を推進するインパクトのある特徴量となる傾向があります。
-
カテゴリー情報やテキスト情報は、数値特徴量よりも大きな影響を与える傾向があります。
チャートは、少なくとも1つの特徴量である加盟店カテゴリーコード(MCC)への依存度が過剰であることを明確に示しています。 依存度を効果的に下げるには、この特徴量を除外した 特徴量セットの作成、上位モデルのアンサンブル、あるいはその両方を検討します。 これらの手順により、特徴量依存とモデル性能のバランスを取ることができます。 たとえば、このユースケースでは、MCCを除外した追加の特徴量セットと、SMEによって高リスクと認識されたMCCに基づく追加のエンジニアリング済み特徴量が作成されます。
また、多数のエンジニアリング済み特徴量から開始すると、特徴量のインパクトプロットが生成され、多くの特徴量への依存度が最小限に抑えられることがあります。 削減済み特徴量で再トレーニングすると、精度が向上し、モデルの計算要求も減少します。
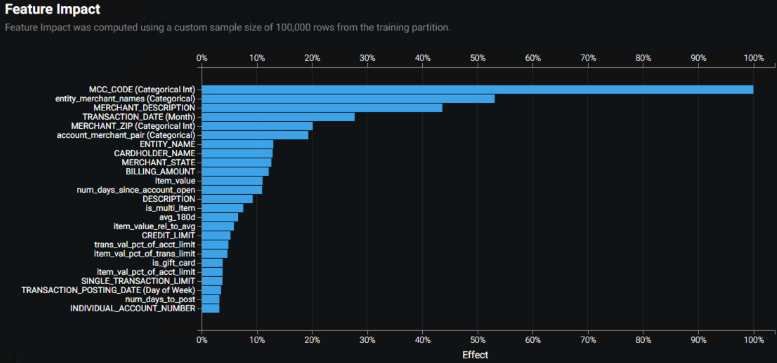
最終的なソリューションでは、変更した2つの特徴量セットそれぞれからの上位モデルを組み合わせて作成されたアンサンブルモデルを使用しました。 それは、MCC依存モデルと同等の精度を達成しましたが、よりバランスの取れた特徴量のインパクトプロットとなりました。 下のプロットを上のプロットと比較してください。
混同行列
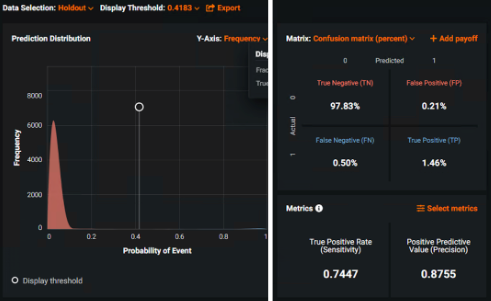
ROC曲線を活用して、監査役室が求めるリスク許容度と確認能力などに基づき、予測しきい値をチューニングします。 混同行列と 予測分布グラフは、しきい値を試し、False PositiveとFalse Negativeの数/パーセントに対する効果を表示する優れたツールを提供します。 モデルでは、取引をリスクが高く、さらに確認が必要なものとしてマークするため、False Negativeを最小限に抑えることを優先するしきい値が望ましいです。
ROC曲線ツールを使用して、最適化戦略間のトレードオフを説明することもできます。 この例でのソリューションは、確認が必要な取引の数を若干増やす一方で、False Negative(不正の見逃しなど)をほぼ最小限に抑えます。
上記の例では、モデルがリスクの確率を出力していることがわかります。
-
設定された確率しきい値を超える取引はリスクが高い(つまり確認が必要)と判断され、その逆も同様です。
-
ほとんどの予測はリスクが低い可能性があります(左の予測分布グラフ)。
-
最適なパフォーマンス評価指標は、感度とプレシジョンです(右の混同行列チャート)。
-
デフォルトの予測分布表示しきい値0.41では、False PositiveとFalse Negativeの量のバランスが取られます(リスク許容度に応じて調整できます)。
予測の説明
DataRobotでは、各取引リスクスコアに、 予測の説明によって生成された2つの関連 リスクコード が提供されます。 これらのリスクコードは、ユーザーが特定のリスクスコアに対して最も影響を与えた2つの特徴量とその相対的な大きさを示します。 予測の説明を含めると、予測の「理由」が伝わり、モデル出力の信頼度チェックやトレンドの特定に役立つため、信頼を構築できます。
予測とデプロイ
上記のツール(リーダーボード上のブループリント、特徴量のインパクトの結果、混同行列/ペイオフ行列)を使用して、データ/ユースケースに最適なブループリントを決定します。
バッチスケジュールの各取引のリスクスコア予測(および付随する予測の説明)を提供するモデルを、最終アプリケーションが読み取るデータベース(Mongoなど)にデプロイします。
ETLおよび予測スコアリングの頻度を利害関係者と確認します。 TSYS DEFファイルは毎日提供され、投稿日の数日前からの取引が含まれます。 通常、DEFの毎日のスコアリングは問題ありません。購入取引後の確認をリアルタイムで実行する必要はありません。 参考までに、場合によっては、購入後取引の確認に最大30日かかることがあります。
ノーコードアプリやStreamlitアプリは、モデルの集計結果(エンティティレベルでのリスクの高い取引など)を表示する場合に役立ちます。 利害関係者が予測を活用して、調査結果を記録できるカスタムアプリケーションの構築を検討してください。 便利なアプリを使用すると、直感的で自動化されたデータの取込み、リスクが高いと判断された各取引の確認、ならびに組織レベルとエンティティレベルの集計ができます。
監視および管理
不正行為は、新たな手口が対策された手口に取って代わるため、常に変化し続けています。 モデルの精度を追跡し、モデルの有効性を検証するには、SME/監査役からグラウンドトゥルースを取得することが極めて重要です。 データドリフト、および概念ドリフトは、重大なリスクをもたらす可能性があります。
不正検知の場合、モデルを再トレーニングするプロセスでは、監査役が手作業で注釈を付けた追加のデータバッチが必要になる場合があります。 このプロセスを、プロジェクトのセットアップフェーズの早い段階で、明確に伝達します。 チャンピオン/チャレンジャー分析は、このユースケースに適しているため、有効化する必要があります。
(確認された不正とは対照的に)riskyとラベル付けされたターゲットデータでトレーニングされたモデルの場合、トレーニングデータの量が増えるにつれて、confirmed fraudモデリングを探索することが将来有用になります。 モデルのしきい値は、低いFalse Negative率を維持しながら、モデルのイテレーションによって上昇する可能性がある信頼性の調整つまみとして機能します。 結果のリスクではなく実際の結果を予測するモデルに移行すると、主に(エンドユーザーアプリから収集した)実際の結果としてラベル付けされたデータで再トレーニングする際の潜在的な難易度にも対処できます。


