Metric Scores
| Tab | Description |
|---|---|
| Performance | Provides a single-view listing all partition scores for all metrics (for the selected model). |
The Metric Scores insight shows a model's score for all supported metrics across all partitions. Click Score to calculate scores for any partition that was not calculated automatically.
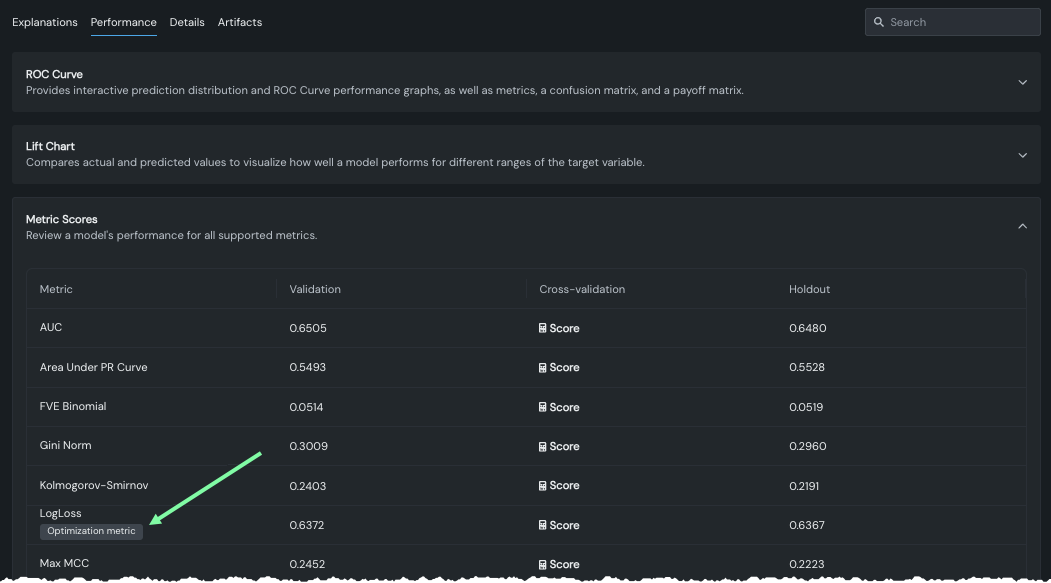
See the optimization metric reference for information about each metric.
Next steps
Drill into a specific metric with a visual insight for further analysis.
- Lift Chart: Visualize how well the model segments the target population and predicts across value ranges.
- ROC Curve: For classification models, explore performance and statistics at any point on the probability scale.
- Residuals: For regression models, examine how well predictions scale linearly with actual values.